Communication
Printed in Brazil - ©2015 Sociedade Brasileira de Química0103 - 5053 $6.00+0.00*e-mail: [email protected]
Kinetic Parameters of Soot Oxidation Catalyzed by Nanosized ZnO-CeO
2Solids
Leandro F. Nascimento, Paulo C. de Sousa Filho, Juliana F. Lima and Osvaldo A. Serra*
Departmento de Química, Faculdade de Filosofia, Ciências e Letras de Ribeirão Preto, Universidade de São Paulo, 14040-901 Ribeirão Preto-SP, Brazil
Catalytic combustion of soot was performed over ZnO:CeO2 catalysts obtained via a non-alkoxide sol-gel route. Different kinetics parameters were calculated through thermal analyses, thus, enabling the correlation between the experimental data and the decomposition mechanisms probably associated with the soot decomposition in each case.
Keywords: soot oxidation, mixed oxides, ceria, automotive catalysis, kinetics parameters
Introduction
In the recent decades, the change in the air quality caused by pollutant emissions that are harmful to human health and to the environment has been a subject of an increasing concern.1,2 Among these pollutants, particulate emissions arising from the incomplete combustion of diesel deserve a special attention due to many adverse health effects, especially on the respiratory system.3-6 In view of this scenario, several studies have focused on practical ways to overcome this problem through the development of devices able to mitigate the emission of particulate matter in engines operating in diesel cycles.7-11 In this sense, catalytic filters are designed to reduce the amount of soot generated in the diesel combustion through the retention or low-temperature oxidation of carbonaceous materials.12,13 The construction of catalytic converters usually involves the use of several metals and metal oxides and rare earth-based compounds are a promising class for such systems.13-18 Particularly, cerium oxide is a widely employed catalyst due to its stability, high oxygen lability and redox behavior arising from its non-stoichiometric structure.10,17-19 In addition, the modification of CeO2 with other metals usually enables the formation of defects and vacancies, which are directly associated to the formation and diffusion of reactive oxygen species.16,19,20 This, in turn, results in a more efficient soot oxidation at low temperatures, thus allowing for the use of less expensive metals and lower amounts of loaded compounds for the construction of the catalytic converters.21,22 Prior to the development of the final catalysts and the composition of the ceramic substrates,
which are commonly placed in the engines exhaust tubes, the evaluation of the catalytic properties in model conditions is proved to be highly valuable. In these cases, generally, thermal analyses of mixtures of soot standards and solid catalysts provide essential information about the involved mechanisms, energies and temperatures.23,24 Recently,25 it has been shown that the addition of zinc oxide to CeO2 solids leads to a large enhancement of the stability and catalytic ability of such compounds in the decomposition of soot generated in diesel engines. Therefore, this communication presents the evaluation of the synergistic effects of the addition of ZnO on the catalytic ability of CeO2 nanoparticles for soot oxidation. For this, the determination of the kinetic activation parameters (i.e., activation energies, enthalpies, entropies and Gibbs free energies of activation, and pre-exponential factors) can be readily obtained from thermal analysis experiments, which involved on the oxidation of a soot model (Printex-U®, Degussa) in the presence of the prepared catalysts in non-isothermal transient experiments.
Experimental
and ZnO were also prepared by using only Ce(NO3)3 or Zn(CH3COO)2.2H2O as precursors.
For the evaluation of the catalytic properties, commercial carbon black samples (Printex-U®, Degussa), with a surface area of 76 m2 g-1 and average particle size of 25 nm, was used as model soot. Loose contact soot/catalyst mixtures (1/9, m/m) were prepared by gentle mixing of the solids with a spatula instead of milling in a mortar, in order to simulate the real conditions of contact between soot and the catalyst. The mixtures were then evaluated through thermogravimetry and differential thermal analysis, in which ca. 20 mg of the mixtures containing each catalyst and the soot are placed in platinum crucibles and thermally treated in a Thermal Analyst 2100-TA Instruments STD 2690-Simultaneous TGA-DTA modulus, operating under synthetic air atmosphere, with a heating rate of 10 °C min-1, from room temperature to 700 °C in air flow of 75 mL min-1. Aluminium oxide (α-Al
2O3) was used as inert reference for the acquisition of thermogravimetric (TG) and differential thermal analysis (DTA) curves. In order to evaluate the reusability of the sample, the ZnO:CeO2 catalyst was recovered from the catalytic assays and tested again in the same soot/catalyst conditions, in a total of three catalytic cycles.
Results and Discussion
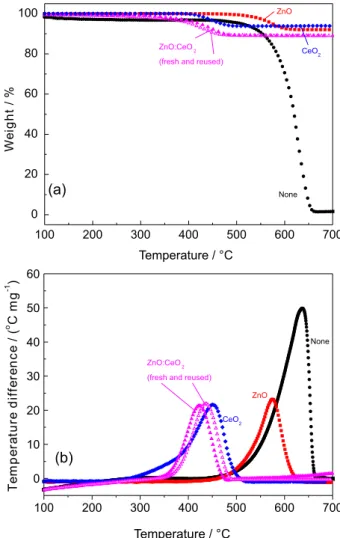
Figures 1a and 1b show the thermogravimetry (TGA) and differential thermal analysis (DTA) of the soot and soot/catalyst mixtures, for which weight losses of 100% and ca. 10%, respectively, are observed on the TGA curves, thus corresponding to the combustion of the total masses of soot. The TGA curves provide the temperature values Ti (related to the beginning of the soot combustion) and Tf (temperature in which the complete conversion of soot takes place). The DTA curves (Figure 1b) evidence that all processes occur in a single exothermic process. The maximum of the DTA plots correspond to the temperature in which the highest difference between the reference and sample temperatures occurs and, for all samples, it is a good approximation to consider these points as being the temperatures of highest combustion rate (Tc),
28 since they coincide with the maxima of the first derivative of the TGA curves. The catalytic properties of the prepared solids are then evaluated by comparing the values of Tc with those of the soot combustion without catalyst in the same conditions. Figure 1 reveals that the non catalyzed reaction occurs between Ti = 450 °C and Tf = 660 °C.
The addition of ZnO leads to a low-efficiency displacement of Tc to ca. 575 °C, thus indicating a low catalytic activity of ZnO towards soot oxidation
in comparison to the cerium-based compositions as summarized in Table 1.
On the other hand, the CeO2 and ZnO:CeO2 catalysts lead to a large decrease in the combustion temperatures (270-510 and 340-480 °C, respectively), thus, revealing their very high reactivity at this temperature ranges. The results (Table 1) also evidence that the reuse of
100 200 300 400 500 600 700
0 0 20 40 60 10 30 50 20 40 60 80 100 W e ig h t / %
Temperature / °C
ZnO:CeO2
(fresh and reused)
ZnO
CeO2
(a) None
100 200 300 400 500 600 700
T e m p e ra tu re d if fe re n c e / ( o C m g -1 )
Temperature / °C (b)
ZnO:CeO 2 (fresh and reused)
ZnO
CeO 2
None
Figure 1. TGA (a) and DTA (b) curves of pure Printex® U (black circles, ●); ZnO (red squares, ■); CeO2 (blue rhombi, ♦); and fresh (magenta triangles, ▲) and reused (magenta unfilled triangles; ∆) ZnO:CeO2 samples.
Table 1. Catalytic performance of the prepared samples in soot oxidation
Catalyst Tia / oC Tcb / oC Tfc / oC
Noned 450 610 660
ZnO 450 575 630
CeO2 270 451 510
ZnO:CeO2-fresh 340 420 480
ZnO:CeO2-used 345 436 493
aT
i: soot oxidation ignition temperature; bTc: temperature of the highest rate of soot combustion; cT
f : end of weight loss; dNone: corresponding to Printex-U® oxidation without a catalyst.
100 200 300 400 500 600 700 0 0 20 40 60 10 30 50 20 40 60 80 100 W e ig h t / %
Temperature / °C
ZnO:CeO2
(fresh and reused)
ZnO
CeO2
(a) None
100 200 300 400 500 600 700
T e m p e ra tu re d if fe re n c e / ( o C m g -1 )
Temperature / °C
(b)
ZnO:CeO 2 (fresh and reused)
ZnO
CeO 2
None
the ZnO:CeO2 catalyst after thermal analysis runs do not affect the involved Ti, Tc and Tf temperatures, thus, confirming that its catalytic ability is not lost after a total of three cycles.
To better understand the catalytic activity of the prepared materials, we evaluated the soot decomposition kinetics by fitting the thermal decomposition profiles using the Coats-Redfern methodology29-31 and the relation:
RT E E
RT E
AR T
g a
a
a 2.303
2 1 log ) ( log
2 −
− Φ =
α (1)
where T is the temperature, A is the pre-exponential factor of the Arrhenius equation, R is the gas constant,
Φ is the heating rate, and Ea is the activation energy associated with the decomposition step. The g(α) function is an integral form of a reaction model function, which is a mathematical representation of the decomposition mechanism.30-32 To calculate the activation parameters (∆H‡, ∆S‡, and ∆G‡), it is necessary to test different forms of the g(α) function, to fit equation 1 with the experimental data. The function for which the correlation is the highest corresponds to the most probable thermal decomposition mechanism. The enthalpies, entropies and Gibbs free energies of activation are calculated from the obtained Ea and A values,
30,31 since:
‡
‡ H‡ T S
G =∆ − c∆
∆ (2)
where Tc is the temperature of the highest soot combustion rate (DTA peak). The enthalpy of activation can be calculated from the Arrhenius activation energy, since:
a RT U
E
c+∆
= (3)
where ∆U‡ is the variation of the internal energy in the formation of the transition states. From the definition of enthalpy, one can write:
∆H‡ = ∆U‡ + P∆V‡ (4)
in which P is the pressure and ∆V‡ is the activation volume. Therefore, the activation energy becomes:
V P H RT E
c
a= +∆ − ∆
‡ ‡
(5)
The parameter P∆V‡ depends on the reaction stoichiometry, and can be equaled to a ∆n‡RT
c, in which ∆n‡ is the variation in the number of moles of the species for the formation of the transition states. In the present case, the solid-gas decompositions can be considered to
have ∆n‡ = +2, then the term P∆V‡ equals to 2RT c. The activation energy can thus be expressed as:
RT
H
E
a=∆ −
‡
(6)
Finally, the entropies of activation can be obtained from the statistical thermodynamic treatment of the transition state theory, assuming that A >> 1 and that Tc is not a too high temperature, which yields:
R S c
B e
h T k A
‡
∆
= (7)
where kB is the Boltzmann constant and h is the Plank constant.
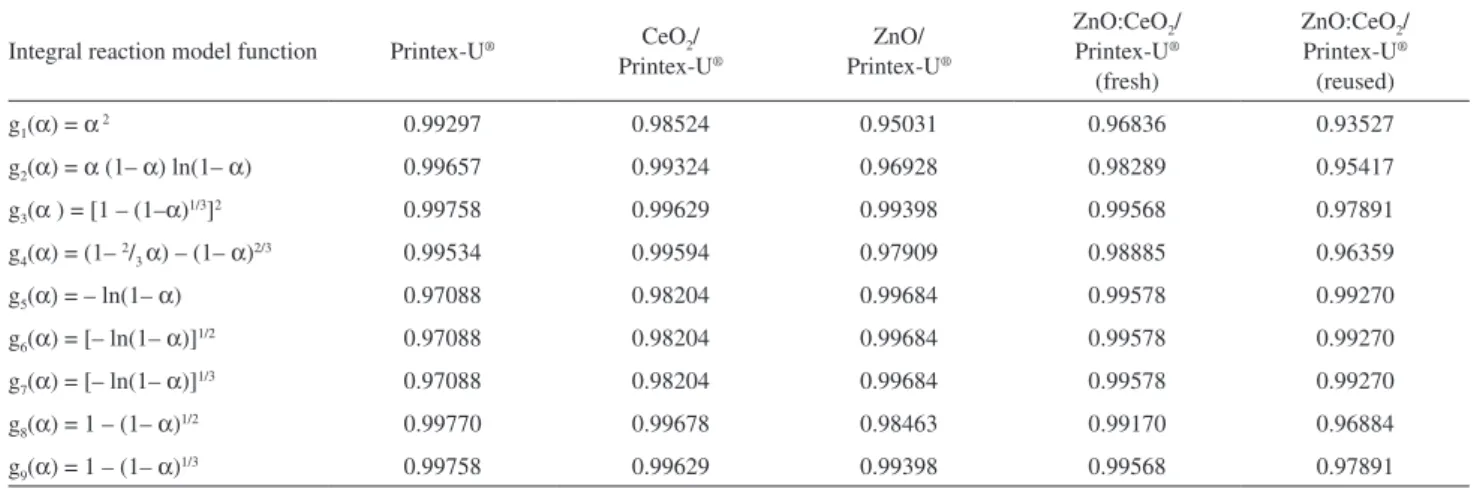
Table 2 shows the correlation coefficients for the linear fit of equation 1 using nine g(α) function for the samples. The decomposition of the pure soot model Printex-U® fits functions with the form g3(α) = [1 – (1 – α)1/3]2 and g9(α) = 1 – (1 – α)
1/3 better, as a consequence of competing mechanisms. The g3(α) = [1 – (1 – α)1/3]2 function refers to a diffusion-limited mechanism, in which the decomposition takes place as the oxygen molecules permeate the porous structure of the soot particles to react in the particle core.33 On the other hand, the g9(α) = 1 – (1 – α)1/3 function is associated with a geometrical contraction model (contracting volume) in which the reaction interface moves progressively toward the core of the soot particles; i.e., the particle volume decreases due to oxygen reaction at their surface. The g9(α) function yields activation parameters that are closer to reported values,34-36 so we select it for the calculations. Decomposition of the soot model in the presence of CeO2 also occurs according to a geometrical contraction model, which in this better fits the g8(α) = 1 – (1– α)1/2 function. This model corresponds to a contracting area mechanism and indicates that the CeO2 particles enhance the number of oxygen active species at the surface of the soot particles, progressively reducing their areas. The presence of zinc oxide (both pure and combined with CeO2) alters the dominating decomposition mechanism, because the weight loss profiles better fit functions with the form g(α) = [– ln(1 – α)]1/n (g
coherent values of activation parameters,34-36 we chose it for the calculations.
Table 3 and Figure 2 displays the calculated activation parameters for the different samples. Compared with the pure soot model, the activation and free Gibbs energies decrease in the presence of the prepared materials, attesting to their catalytic ability. The values of ∆G‡ decrease from ca. 174 kJ mol-1 for the pure Printex-U® to ca. 140 kJ mol-1 for the most active samples, namely ZnO:CeO2, thus corresponding to a decrease of ca. 20% in the Gibbs free energy of activation. The results evidence that the combination of CeO2 and ZnO is more effective than the pure CeO2 and ZnO, i.e., soot oxidation in the presence of the ZnO:CeO2 solids requires lower temperatures and energies, which confirms the efficiency of the proposed composition. The Arrhenius activation energies display more prominent decreases, since pure carbon black samples require ca. 175 kJ mol-1 for the activation of the combustion process, while in the presence of the fresh ZnO:CeO2 catalyst the activation involves only 54 kJ mol-1, a reduction of ca. 70% in the activation energy. The enthalpies of activation follow the same trend observed for the activation energies, though involving larger values, as expected for reactions with positive activation volumes.
In addition, during the decomposition of pure carbon black, the entropy of activation assumes a slightly positive value, which can be due to a limiting step of dissociative nature (i.e., increase of entropy), agreeing with the geometric contraction model in this case. This observation also corroborates with the larger values of the pre-exponential factors, which are higher for the non-catalyzed reactions in comparison to the catalyzed combustions. In other words, at the sufficiently high temperatures, the decomposition of pure carbon black can
Table 2. Correlation factors for the thermal decomposition of the soot model Printex-U® and the soot model in the presence of different catalysts/catalyst mixtures obtained by using nine forms of g(α) functions
Integral reaction model function Printex-U® CeO2/ Printex-U®
ZnO/ Printex-U®
ZnO:CeO2/ Printex-U®
(fresh)
ZnO:CeO2/ Printex-U®
(reused)
g1(α) = α 2 0.99297 0.98524 0.95031 0.96836 0.93527
g2(α) = α (1– α) ln(1– α) 0.99657 0.99324 0.96928 0.98289 0.95417
g3(α ) = [1 – (1–α)1/3]2 0.99758 0.99629 0.99398 0.99568 0.97891
g4(α) = (1– 2/3 α) – (1– α)2/3 0.99534 0.99594 0.97909 0.98885 0.96359
g5(α) = – ln(1– α) 0.97088 0.98204 0.99684 0.99578 0.99270
g6(α) = [– ln(1– α)]1/2 0.97088 0.98204 0.99684 0.99578 0.99270
g7(α) = [– ln(1– α)]1/3 0.97088 0.98204 0.99684 0.99578 0.99270
g8(α) = 1 – (1– α)1/2 0.99770 0.99678 0.98463 0.99170 0.96884
g9(α) = 1 – (1– α)1/3 0.99758 0.99629 0.99398 0.99568 0.97891
Table 3. Pre-exponential factors, activation energies, entropies, enthalpies, and Gibbs free energies of activation calculated for the thermal decomposition of the soot model and the soot model in the presence of catalyst/catalyst mixtures
A / s-1 Ea / (kJ mol-1)
∆H‡ / (kJ mol-1)
∆S‡ / (J mol-1 K-1)
∆G‡ / (kJ mol-1)
Printex-U® 7.5 × 10¹² 175 181 7.4 174
CeO2/Printex-U® 6.3 × 10⁷ 79 73 –102 147
ZnO/Printex-U® 9.8 × 10⁸ 104 98 –81 166
ZnO:CeO
2/Printex-U® (fresh) 1.9 × 10⁶ 54 49 –131 141
ZnO:CeO
2/Printex-U® (reused) 3.4 × 10⁸ 81 75 –88 138
20 40 60 80 100 120 140 160 180
-200 -150 -100 -50 0 50
(fresh) (reused) Printex-U
+ ZnO-CeO 2 Printex-U
+ ZnO-CeO 2 Printex-U
+ ZnO Printex-U
+ CeO 2
∆
H
and
∆
G
/
(kJ
mol
-1 )
Samples ∆G
∆H
∆S
Printex-U
∆
S
/
(J
mol
-1
K
-1 )
Figure 2. Calculated activation parameters: ∆G‡ (blue circles, ●); ∆S‡ (black triangles, ▲); and ∆H‡ (red squares, ■) for the catalytic ability of the prepared compounds on Printex-U® (soot standard) oxidation.
20 40 60 80 100 120 140 160 180
-200 -150 -100 -50 0 50
(fresh) (reused) Printex-U
+ ZnO-CeO 2 Printex-U
+ ZnO-CeO 2 Printex-U
+ ZnO Printex-U
+ CeO 2
∆
H
and
∆
G
/
(kJ
mol
-1 )
Samples
∆G
∆H
∆S
Printex-U
∆
S
/
(J
mol
-1
K
-1 )
occur simultaneously over the entire solid surface, thus resulting in larger frequency factors. However, this process involves larger activation energies, thereby requiring higher oxidation temperatures. On the other hand, the decomposition of the soot standard in the presence of the catalyst involves a limiting step of associative nature, which is related to the negative values of activation entropy. This suggests that oxidation processes occur at reactive sites on the particles surface. Therefore, the soot oxidation in the presence of the ZnO:CeO2 catalysts follows a nucleation model, which is illustrated by the lower values of the pre-exponential factors. In these cases, the soot decomposition is induced to occur at specific sites in which the catalyst and the soot particle are in contact, which results in lower frequency factors. Despite this, reduced frequency factor and non-favorable entropic characteristics, the reactivity of the catalyst surfaces overcomes this fact and leads to lower activation energies, which is reflected in lower oxidation temperatures. Table 3 also reveals that the fresh ZnO:CeO2 sample displays a more negative activation entropy and a lower pre-exponential factor in comparison to the reused sample, thus evidencing an increased frequency of effective sites or a higher accessibility to them in the last case. This can be related to the stoichiometric state of the prepared solids. As the fresh catalyst is obtained after calcination in air, it presents a high degree of oxidation. On the other hand, as the catalytic tests consist in calcinations under reducing conditions, the reused catalysts present a higher degree of reduced metal centers. As a consequence, a larger amount of structural defects is created, thus inducing a higher oxygen mobility, which culminates in higher frequency factors (and less negative activation entropies). However, the catalytic cycles also induce the sintering of the solids and the occlusion of their pores, which results in the elevation of the energetic barrier for the contact between catalyst and soot. The two effects lead to no significant alteration in total energy involved in the processes, since the free energies of activation remain practically the same after three catalytic cycles. Therefore, the calculated parameters also evidence that the reuse does not affect the efficiency of the ZnO:CeO2 catalysts. This, in turn, attests for the high efficiency and the applicability of the proposed composition for soot oxidation in automotive systems, also revealing that the introduction of large amounts of the cheaper zinc precursors in the composition of ceria catalysts leads to an improvement in the catalytic properties.
Conclusions
We applied a non-alkoxide procedure for the obtainment of ZnO:CeO2 nanostructures, which effectively lower the
soot combustion temperature. Compared with the pure soot standard, the values of ∆G‡ decrease in the presence of the prepared materials, attesting to their catalytic ability. The combination of CeO2 and ZnO is more effective than the pure CeO2 and ZnO. Therefore, the soot oxidation in the presence of the ZnO:CeO2 solids requires lower temperatures and energies, which confirms the efficiency of the proposed composition. The value of ∆S‡ assumes a slightly positive value for the carbon black decomposition, then this process can be related to a geometric contraction model. On the other hand, the decomposition of the soot standard in the presence of the catalyst involves a limiting step of associative nature, thus, suggesting that oxidation processes occur at reactive sites on the particles surface.
Acknowledgements
The authors are grateful to the Brazilian agencies CAPES, CNPq (Proc. 105477/2012-5, LFN, and 303184/2010-5, OAS), and FAPESP (Proc. 2013/01669-1, PCdSF, and Proc. 2012/24165-6, JFL) for the financial support.
References
1. Frank, B.; Schlögl, R.; Su, D. S.; Environ. Sci. Technol.2013,
47, 3026.
2. Gill, S. S.; Herreros, J. M.; Tsolakis, A.; Turner, D. M.; Miller, E.; York, A. P. E.; RSC Adv.2012, 2, 10400.
3. Chuang, H. C.; Bérubé, K.; Lung, S. C. C.; Bai, K. J.; Jones, T.;
J. Hazard. Mater.2013, 244-245, 142.
4. Shengsu, D.; Serafino, A.; Müller, J. O.; Jentoft, R.; Schlögl, R.; Fiorito, S.; Environ. Sci. Technol.2008, 42, 1761.
5. Zhang, H.; Gu, F.; Liu, Q.; Gao, J.; Jia, L.; Zhu, T.; Chen, Y.; Zhong, Z.; Su, F.; RSC Adv.2014, 4, 14879.
6. Miguel, A. H.; Hansen, A. D. A.; J. Braz. Chem. Soc.2012, 23, 1140.
7. Yang, R.; Gao, Y.; Wang, J.; Wang, Q.; Dalton Trans.2014, 43, 10317.
8. Simonsen, S. B.; Dahl, S.; Johnson, E.; Helveg, S.; J. Catal.
2008, 255, 1.
9. Maricq, M. M.; J. Aerosol Sci.2007, 38, 1079.
10. Sousa Filho, P. C.; Gomes, L. F.; Oliveira, K. T.; Neri, C. R.; Serra, O. A.; Appl. Catal., A2009, 360, 210.
11. Kumar, P. A.; Tanwar, M. D.; Russo, N.; Pirone, R.; Fino, D.;
Catal. Today2012, 184, 279.
12. Tighe, C. J.; Twigg, M. V.; Hayhurst, A. N.; Dennis, J. S.;
Combust. Flame2012, 159, 77.
13. Gálvez, M. E.; Ascaso, S.; Tobías, I.; Moliner, R.; Lázaro, M. J.;
Catal. Today2012, 191, 96.
14. Nascimento, L. F.; Martins, R. F.; Serra, O. A.; J. Rare Earths
15. Sudarsanam, P.; Kuntaiah, K.; Reddy, B. M.; New J. Chem.
2014, 38, 5991.
16. Silva, R. F.; Oliveira, E.; Sousa Filho, P. C.; Neri, C. R.; Serra, O. A.; Quim. Nova2011, 34, 759.
17. van Setten, B. A. A. L.; Makkee, M.; Moulijn, J. A.; Catal. Rev. Sci. Eng.2001, 43, 489.
18. Fino, D.; Sci. Technol. Adv. Mater. 2007, 8, 93.
19. Trovarelli, A.; Fornasiero, P. In Catalysis by Ceria and Related Materials; Hutchings, G. J., ed.; Imperial College Press:
London, 2013, vol. 12, ch. 2.
20. Alammar, T.; Chow, Y. K.; Mudring, A. V.; New J. Chem. 2015,
39, 1339.
21. Liang, Q.; Wu, X.; Weng, D.; Lu, Z.; Catal. Commun.2008, 9,
202.
22. Gupta, A.; Waghmare, U. V.; Hegde, M. S.; Chem. Mater.2010,
22, 5184.
23. Zhdanov, V. P.; React. Kinet., Mech. Catal. 2013, 108, 41. 24. Chigrin, P. G.; Lebukhova, N. V.; Ustinov, A. Y.; React. Kinet.,
Mech. Catal.2014, 113, 1.
25. Nascimento, L. F.; Martins, R. F.; Silva, R. F.; Serra, O. A.;
J. Environ. Sci.2014, 26, 694.
26. Lima, J. F.; Martins, R. F.; Neri, C. R.; Serra, O. A.; Appl. Surf. Sci.2009, 225, 9006.
27. Lima, J. F.; Martins, R. F.; Serra, O. A.; Opt. Mater.2012, 35, 56.
28. Akita, K.; Kase, M.; J. Phys. Chem.1968, 72, 906. 29. Coats, A. W.; Redfern, J. P.; Nature1964, 201, 68.
30. Faria, E. A.; Prado, A. G. S.; React. Funct. Polym.2007, 67, 655.
31. Moura, A. O.; Prado, A. G. S.; J. Colloid Interface Sci.2009,
330, 392.
32. Khawam, A.; Flanagan, D. R.; J. Phys. Chem. B2006, 110, 17315.
33. Ma, X.; Zangmeister, C. D.; Zachariah, M. R.; J. Phys. Chem. C
2013, 117, 10723.
34. Hernandes, S.; Blengini, G. A.; Russo, N.; Fino, D.; Ind. Eng. Chem. Res.2012, 51, 7584.
35. Dernaika, B.; Uner, D.; Appl. Catal., B 2003, 40, 219. 36. Tomasic, V.; Brnardic, I.; Jenei, H.; Kosar, V.; Zrncevic, S.;
Chem. Biochem. Eng. Q.2011, 25, 283.
Submitted: January 30, 2015
Published online: April 24, 2015