Corresponding author: Hakan Akat, Department of Chemistry, Faculty of Science, Ege University, 35100, Izmir, Bornova, Turkey, e-mail: [email protected]
Synthesis and Thermal Degradation Kinetics of D–(+)–
Galactose Containing Polymers
Fehmi Saltan, Hakan Akat
Ege University, Faculty of Science, Department of Chemistry, Turkey
Abstract: In this study, it is investigated the synthesis and characterizations of polymerizable vinyl sugars. Carbohydrate containing polymers were synthesized via free radical polymerization. Thermal behavior of polymer derivatives was analyzed by using DSC and TG. Molecular weight dispersion of polymer derivatives was also analyzed with GPC. Molecular structures were analyzed by FT-IR and 1H-NMR spectrophotometer. We found that molecular weight of copolymers could effect to the thermal stability. According to TG data related to the copolymers, molecular weight of polymers increased while the thermal stability decreased. Thermogravimetric analysis of polymers also investigated. The apparent activation energies for thermal degradation of carbohydrate containing polymers were obtained by integral methods (Flynn–Wall–Ozawa, Kissinger– Akahira–Sunose, and Tang).
Keywords: Copolymers, carbohydrates, radical polymerization, thermal properties, kinetics.
Introduction
Large amounts of carbohydrates are commercially available and a substantial part of the surplus of their agricultural production may be spent in this way. One possibility to prepare macromolecules from sugars makes use of the preparation of vinyl sugars and their polymerization. Unlike polysaccharides, such polymers have an all-carbon backbone and pendant saccharide units. They can be tailor-made for many purposes. The polymers are water-soluble unless the sugars stil carry protecting groups which make them more hydrophobic. Possible applications can be seen for water-soluble non-ionic polymers, which are hydrophilic due to their large number of hydroxyl groups. The polymers might then find use as thickeners (e. g. in the tertiary oil recovery), as flocculating agents, as polymeric detergents, or for surface modification of standard polymers. They might also be of interest as models for intercellular recognition
processes[1-5]. Crosslinked poly(vinyl saccharides)
form water-swellable gels which have potential as superabsorbers. They can also be used as stable dextran analogues for the immobilization of enzymes and as gel-permeation chromatography (GPC) materials for the separation of water soluble substances. Polymers that still have protecting groups (such as isopropylidene) are interesting polymers of medium polarity.
Many natural polysaccharides possess a complex branched backbone architecture and undoubtedly this feature plays an important part in their biological activity, whether the latter is primarily a physical function or
a biochemical one[6]. Significant research has now
been published on various synthetic macromolecules
that attempt to mimic glycopolymers[7-10].
Well-defined synthetic glycopolymers have been prepared by using techniques such as ring- opening metathesis
polymerization (ROMP)[11,12] reversible addition–
fragmentation chain transfer (RAFT) polymerization[13-15],
atom transfer radical polymerization (ATRP)[16-20]
cyanoxyl-mediated free-radical polymerization[21,22]
or ‘click chemistry’ for the preparation of saccharide terminated dendritic structures[23,24].
The O-isopropylidene acetal group is a common protecting group extensively used in carbohydrate chemistry for the preparation of valuable building
blocks[25,26]. Especially, acetonation of an aldohexose
results in the formation of an O-isopropylidene derivative with a selective unmasked hydroxyl group, depending upon the nature of the sugar.
In this study, a major requirement was to prepare a polymerizable derivative of galactose. Although the copolymerization of polymerizable galactose derivatives with styrene was seen at the literature reports, we could not find any detailed of thermal behaviour of these polymers and so we are worthful to research thermal behaviour of synthesized of polymers. Thermal degradation kinetics
of the poly(galactomonometharcrylate) (P(GaMA)) and
poly(galactomethacrylate-co-styrene) (P(gm-co-st)5)
were also studied to compare their thermal properties. The apparent activation energies for thermal degradation of the polymers were obtained by using Flynn-Wall-Ozawa, KAS and Tang methods.
Kinetic Analysis
[27-29]Thermogravimetric analysis can be used for determination of degradation kinetic a lot of polymer. In general, the thermal degradation reaction of a solid polymer can be shown as:
A solid → B solid + C gas
where A is the starting material, B solid and C gas are the solid residue and the gas product, respectively.
The kinetic of thermal degradation of polymers is generally expressed by the following typical kinetic equation
P
R
Á
T
I
C
A
S
I
N
D
U
S
T
R
I
A
I
r = dα/dt = k.(T) × f(α) (1)
Where T is the absolute temperature (in K); r is the rate of change conversion or composition per unit time (t) and f(α) is the conversion function (reaction model). The
conversion degree (α) was calculated with Equation 2,
where mo, mt and mf are the weights of sample before degradation, at time t and after complete degradation, respectively.
α= mo-mt/ mo-mf (2)
k is the reaction constant which can be expressed by the Arrhenius equation:
k(T) = Ao e–( Ea / RT) (3)
where A is the pre-exponential factor, Ea is activation
energy and R is the gas constant.88.
By combining Equation 1 and Equation 3 the following quation is obtained
dα/dt = Ao e–(Ea / RT) × f(α) (4)
According to non-isothermal kinetic theory, the
fractional conversion α is expressed as a function of
temperature, which is dependent on the time of heating. Thus the heating rate (β) can be described as:
β = dΤ/ dt (5)
Equation 4 is modified as follows:
dα/dT = (1/β) Ao e–( Ea / RT) × f(α) (6)
Equation 4 and Equation 6 are the basis for the many equations derived to evaluate thermal analysis data.
Integral Methods
Flynn-Wall-Ozawa method[28-31]
This method is one of the integral methods that can be determined the activation energy without knowledge of reaction mechanism. Pre-exponential factor (A) and
activation energy (Ea) do not depend on degradation
fraction, but they depend on the temperature. This method uses Equation 7.
log g (α) = log (AEa/R)-log β+log p(E/RT) (7)
Doyle approximation is used and Equation 7 can be obtained.
log β = log (AEa/R)- log g(α) –2.315-0.4567(E/RT) (8)
the plot of log β versus 1000/T should be linear with the slope Ea/R, from which Ea can be obtained.
Kissenger-Akahira-Sunose(KAS) method[29,30]
The activation energy can be determined by KAS method, using the following equation
ln (β/Τ2)= ln AR/E
ag (α) - (Ea/RT) (9)
According to this method, the plots of ln (β/Τ2) versus
1000/T at same α value give straight lines with slope
equal to –Ea/R.
Tang method[32,33]
The Tang method is based on the following equation:
ln (β/Τ1.894661)= ln AE
a/Rg (α) + 3.635041 - 1.894661
ln Ea – (1.001450Ea/RT) (10)
the plot of ln (β/Τ1.894661) versus 1000/T can give E a from
slope
Experimental
Materials
All chemicals and solvents used in this study were analytical grade. Main chemicals used in this study
were as follow: D-(+)- galactopyranose, Ga, (%98,
BDH), zinc chloride (pure exsiccated, Riedel-de Haёn),
Phosphorus pentoxide (%99.95, Sigma-Aldrich), Phosphoric acid (%85, Merck), acetone (%99, Riedel-de
Haёn), dichloramethane (%99, Sigma-Aldrich), toluene
(%99.5, Riedel-de Haёn), styrene (min. %99,
Sigma-Aldrich), sodium carbonate (anhydrous %99.5, Merck), magnesium sulfate (anhydrous %99.5, Sigma- Aldrich),
diethyl ether (%99.5, Riedel-de Haёn), triethylamine
(min %99, Sigma-Aldrich), methacryloyl chloride (%97, Fluka), Methanol (%99.9, Elkim), AIBN (%98, Merck).
Measurement and characterization
Fourier-transformed infrared (FT-IR) spectra were recorded with a Perkin-Elmer Spectrum 100 FT-IR
spectrometer.1H NMR spectra were recorded with a
Varian 400 MHz NMR spectrometer in chloroform as solvents at room temperature. The thermal analysis was
performed in both N2 and air (flow rate 100ml/min) with
a heating rate of 10 °C/min using a Perkin Elmer TG and Perkin Elmer DSC. All of the products were dried in vacuum oven at 40 °C on 10 mbar pressure before the thermal analyses.Molecular weights were determined by a gel permeation chromotography (GPC) instrument, viscotek GPC max. Autosampler system, consisting of a pump, three visco GEL GPC columns (G2000HHR, G3000HHR and G4000HHR) a viscotek UV detector and a viscotek differential refractive index (RI) detector with a THF flow rate of 1.0 ml min–1 at 30 °C. Both detectors
were calibrated with PS standarts having narrow molecular weight distribution data were analyzed using viscotek OmniSEC Omni-01 software.
Synthesis of isopropylidene-protected D-(+)-galactose: pGa[34,35]
To a solution of D-(+)-galactopyranose Ga (10 g,
of sodium carbonate. The inorganic salts formed were then filtered off and washed with acetone. The filtrate and solution were combined and acetone removed by rotary evaporation. The remaining aqueous solution was then extracted with three 150 ml portions of diethyl ether after which the combined organics were dried over magnesium sulfate. After filtration, to remove the hydrated magnesium sulfate, the solution was evaporated to dryness, leaving the protected D-(+)-galactopyranose
pGa (quantitative yield) as an oil. 1H-NMR (CDCl3
δ:ppm): 1.25-1.30(6H), 1.40-1.45(3H), 1.50-1.55(3H),
2.15-2.20(H), 3.85-3.90(2H), 4.25-4.30(1H), 4.30-4.35(1H), 4-60-4.70(2H), 5.55-5.60(1H).
Synthesis isopropylidene-protected D-(+)-galactosemonomethacrylate: pGaMA[36]
To a 0.1 M solution of protected D-(+)-galactopyranose pGa (7.0 g, 26.8 mmol) in anhydrous dichloromethane (DCM) (275 ml) were added triethyl amine (Et3N) (6.8 g, 67.4 mmol) and a catalytic amount of 4-dimethylaminopyridine (DMAP) (0.350 g, 2.86 mmol) under nitrogen. The reaction mixture was cooled to 0 °C for 1 h and then a 0.5 M solution of methacryloyl chloride (3.37 g, 32.2 mmol, 1.2 eq) in anhydrous DCM (65 ml) was added. The reaction mixture was allowed to reach room temperature and left for 36 h to ensure reaction completion (TLC system, toluene/methanol 9:1). Three 150 ml portions of DCM were added to the mixture, which was then extracted with two 100 ml portions of saturated sodium carbonate and two 100 ml portions of distilled water. The resulting organic phase was dried with magnesium sulfate and the solvent was
removed under vacuum to give pGaMA as a yellow oil
(%75 yield). 1H-NMR (CDCl3 δ:ppm): 1.25-1.30(6H),
1.40-1.45(3H), 1.50-1.55(3H), 1.85-1.90(3H), 3.80-3.85(1H), 4.05-4.10(1H), 4.25-4.35(2H), 4.60-4.65(2H), 5.50-5.55(1H), 5.60-5.65(1H), 6.10-6.15(1H).
General procedure for free radical polymerizations
The functional monomer pGaMA with the styrene
(1 ml for all experiments) was dissolved in anhydrous toluene (2 ml), followed by the addition of AIBN (typically 0.03 g, ~2 mol% wt styrene). The reaction vessels were sealed and degassed individually with four nitrogen-vacuum purge cycles. The temperature was then set at 70 °C and the polymerizations were accomplished for 22 h. To check for reaction completion, small samples were taken for analysis by FT-IR spectroscopy. After cooling down, the reaction mixtures were added dropwise into methanol to precipitate the polymer product, which was filtered off and vacuum- dried at 40 °C to constant mass. (yield higher than 85%). Also, other polymerization reactions were carried out to obtain different mole ratios
of copolymers using the same procedure. 1H-NMR,
P(pGaMA), (CDCl3 δ:ppm): 1.25-1.30(6H),
1.40-1.45(3H), 1.50-1.55(3H), 1.85-1.90(3H), 3.80-3.85(1H), 4.05-4.10(1H), 4.25-4.35(2H), 4.60-4.65(2H),
5.60-5.65(1H). 1H-NMR, P(pgm-co-st)s, (CDCl3 δ:ppm):
6,60-7.20(6H).
General procedure for the deprotection of (co)polymers
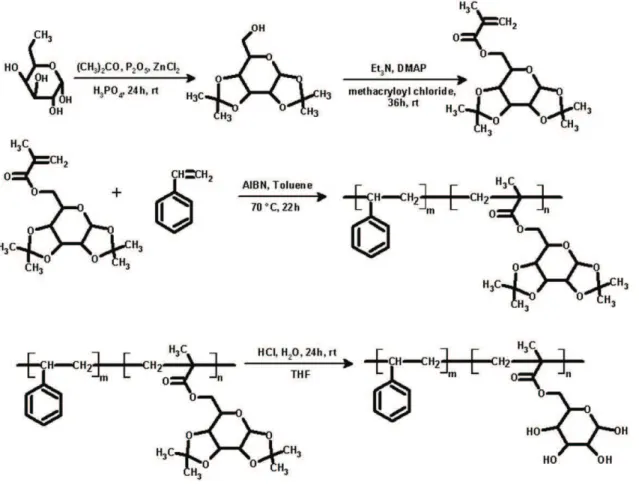
Typically the copolymers (100 mg) were dissolved in THF (2 ml) and then 0.5 ml hydrochloric acid was added to the reaction mixture. After one hour, 0.5 ml distillate water was added dropwise. The reaction mixture was allowed to reach room temperature and left for overnight. The solvent was removed under vacuum. Purification of the product was carried out by washed with water. Over all processes can be seen in Scheme 1.
Results and Discussions
Characterization of synthesis polymers
In our study, we first synthesized pGa and pGaMA.
Following experiment was carried out for different protected copolymer compositions and homopolymers. Deprotection copolymers and homopolymers was
used to obtain P(gm-co-st) copolymers and P(GaMA)
polymers. Chemical structure of both homopolymers and copolymers were identified several techniques which are FT-IR, NMR, GPC, TG and DSC.
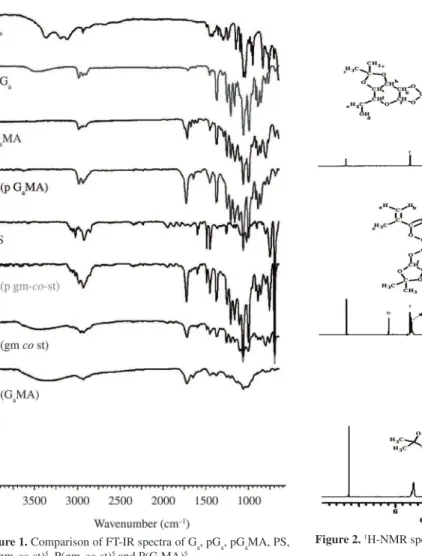
Firstly, Ga was reacted with acetone for obtaining
protected Ga (pGa). The FT-IR spectrums of Ga, pGa,
pGaMA, PS, P(pgm-co-st)5, P(gm-co-st)5 and P(G aMA)
5
are shown in Figure 1. This figure shows that after
protection of Ga, the appearance of a broad –OH stretch
belong to- CH2- in Ga is clear at around 3450 cm–1. As
well as, this is also supported by the appearance of the
—CH— stretching between 2950 and 3000 cm–1 and the
C–O stretching are seen between 1000 and 1500 cm–1.
Secondly, pGa was reacted with methacryloylchloride to
get pGaMA. The appearance of C=O and C=C streching
of pGaMA can be seen at around 1716 cm–1 and 1637 cm–1
in the spectra respectively. On the other hand, it is also supported by disappearance of a broad –OH stretch around 3450 cm–1. This shows successful of the synthesis
of pGaMA.
The homopolymers and random copolymers were synthesized using free radical polymerization. The polymerization reactions were performed in toluene. AIBN was used as an initiator. The FT-IR spectra of these homopolymers and copolymers can be seen in Figure 1. Stretching vibrations of ⱱ (C=C) in PS unit are observed
around 1800-1900 cm–1. CH stretching of aromatic ring
is observed at around 3000 cm–1 for PS and copolymers.
The bands around 1490 cm–1 may be also attributed to
stretching vibrations of the carbons in the aromatic rings. Otherwise, when we look at the spectrum in Figure 1, it can be seen disappearance of C=C stretch at around
1637 cm–1 for P(pG
aMA) and copolymer. According to
data obtained from FT-IR spectrum, it is clear that success of the polymerization.
Figure 1 also shows the comparison between the
protected polymers (P(pgm-co-st)s) and deprotected
polymers (P(gm-co-st)s) using their FT-IR spectra. After
deprotection of P(pgm- co-st)s, the appearance of a broad
We have also supported these results by 1H NMR.
Figure 2 is belong to the 1H NMR spectrum of pG
a,
pGaMA, P(pGaMA). From the 1H NMR spectrum of pG
a,
it can be seen that the –CH3, –OH, –CH2 and galactose
signals. After reaction of pGa with methacryloyl chloride, two new signals were observed. One of them is a singlet
at 1.95 ppm, this signal assigned to–C=C–CH3protons.
The second signals are assigned to –C=CH2– protons
which are Ha and Hb. Ha is observed at 5.5 ppm and Hb signal is observed at 6.15 ppm. The Figure 2 also
shows NMR spectrum of P(pGaMA). -C=CH2– protons at
5.5 ppm - 6.15 ppm are disappeared after polymerization
of pGaMA. From the 1H NMR spectrum of
P(pgm-co- st)s (Figure 3), it can be seen that the aromatic CH,
galactose and CH2– signals. The signals of galactose
protons are observed at between 4.25-5.5 ppm. CH2–
signals are seen at between 1.5-2.25 ppm. The Figure 3 is belong to an example NMR spectrum of deprotected copolymer (p(gm-co-st)s). It shows the appearance of the
–OH signal at 3.75 ppm. According to data obtained from NMR spectrum (Figure 3), it is clear that success of the deprotection of polymer. Similar results are also obtained for other copolymers.
Molecular weights of the synthesized polymers are shown in Table 1. According to these results, molecular weight of PS is lower than the others. Molecular weight
of P(GaMA) is higher than PS. When mole feed ratio of
sugar in the copolymer composition ((p(gm-co- st)s) is
raised, molecular weight of polymer increases. Reason of this increasing may be rising of methacrylate group in the copolymer composition. Polydispersity (PDI) raitos of polymers give similar results for all polymers.
TG measurements were obtained to study the thermal behavior and thermal stability of the prepared
PS, P(GaMA) and carbohydrate containing copolymers.
TG curves of the polymers are shown in Figure 4.
TG thermograms under N2 atmosphere revealed that
polystyrene degradation takes place in two stages the first being at a temperature around 180 °C that corresponds to a very small mass loss about %4. The second occurs at about 360 °C that corresponds to mass loss about %100 and it is the main degradation stage[37]. TG curves
of copolymers are similar to PS curves but when mole fraction of sugar in the copolymer is enhanced, TG curves
of copolymers ((p(gm-co-st)s) start to neat P(G
aMA)
curve. According to data obtained from TG studies, it is clear that char yield of the copolymers is enhanced when compared with PS.
Glass temperature of polymers is also investigated by DSC. In the DSC curves, (Figure 5) the glass transitions
of the PS, P(GaMA) and copolymer compositions are
detected between 95 °C and 128 °C. These values are
ranged in Table 2. Tg of PS was found to be 95 °C and
the Tg of P(GaMA) was found to be 128 °C. Tg values
of copolymer compositions was also obtained to between 95 °C and 128 °C as expected. When the mole fraction of
sugar was enhanced at the copolymer composition, the Tg values of copolymers regularly increased.
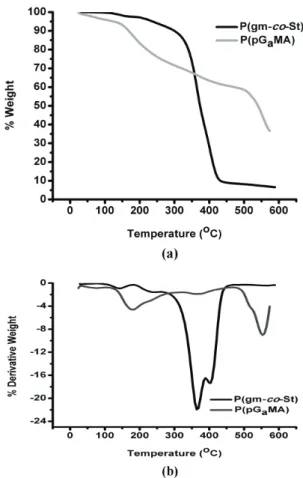
Thermal Degradation Study
Figure 6 shows the respective TG and DTG curves of for P(GaMA)and P(GaMA-co- st). under N2 atmosphere over a temperature range 30 to 600 °C with heating
rate of 10 °C min–1. The TG thermogram of P(G
aMA)
shows that homopolymer includes three decomposition stages. The Tmax for the first, second, and third stages are about 180, 368 and 554 °C, respectively. As far as thermal decomposition of P(GaMA-co-st)5 is concerned,
two main decomposition stage is observed. First one appears to begin around 265 °C and stop around 388 °C with maximum rate at 363 °C for heating rate 10 °Cmin–1.
Second one appears to begin around 390 °C and stop around 468 °C with maximum rate at 402 °C for heating rate 10 °Cmin–1.There are also two small peaks which can
be seen between 100 °C and 300 °C for P(GaMA-co-st)5
in the thermogram. The first and second decomposition stages may due to degradation from the MMA in the copolymer backbone. The PMMA obtained by radical polymerization may contain some head to head (H-H) linkages and some early decompositions which occur around 110-150 °C is due to breakage at these linkages
Figure 1. Comparison of FT-IR spectra of Ga, pGa, pGaMA, PS, P(pgm-co-st)5, P(gm-co-st)5 and P(G
aMA) 5.
Figure 2. 1H-NMR spectra of pG
a, pGaMA, P(pGaMA).
unsaturated chain ends resulting from the termination
by disproportionation[38]. When compared to P(G
aMA),
P(GaMA-co-st) is stable up to 400 °C but this situation reverses above 400 °C.
Thermal degradation kinetics of P(gm-co-st)5 and P(GaMA)
To estimate the apparent activation energies of
P(GaMA) and P(GaMA-co-st)5, the TG measurement of
the polymers were performed under various heating rates 5, 10, 15, and 20 °C /min in the range 30 to 600 °C. When compared to all copolymers, P(GaMA-co-st)5 is chosen
for thermal degradation kinetic analysis because it is more shifted to PS. The decomposition behavior at all heating rates of the polymers were analogous to each other at
Table 1. Mole feed ratio and GPC results of synthesized polymers.
Experiment Composition (mole feed ratio) Yield % GPC analysis
pGaMA Styrene Mw (gmol–1) M
n (gmol
–1) PDI
PS - 8.6×10⁻³ 60 9500 6400 1.49
P(GaMA) 1.5×10⁻³ - 58 11300 7300 1.54
P(gm-co-st)1 0.7×10⁻³ 8.6×10⁻³ 64 11400 7500 1.5
P(gm-co-st)2 1.4×10⁻³ 8.6×10⁻³ 65 11700 7700 1.51
P(gm-co-st)3 2.8×10⁻³ 8.6×10⁻³ 62 13200 8200 1.62
P(gm-co-st)4 4.3×10⁻³ 8.6×10⁻³ 63 14400 8700 1.65
Figure 4. Comparison of TG curves of synthesized polymers.
Figure 5. DSC curves for the studied homopolymers and copolymers.
Table 2. The glass transitions of synthesized homopolymers and copolymers.
Experiments Mole ratio
(sugar monomer/styrene) Tg (°C)
PS - 95
P(GaMA) - 128
P(gm-co-st)1 1/12 96
P(gm-co-st)2 1/6 97
P(gm-co-st)3 1/3 110
P(gm-co-st)4 1/2 115
P(gm-co-st)5 1/1 118
Figure 6. a-b: Typical TG and DTG curves for P(GaMA-co-st) 5 and P(GaMA) samples in N2 atmosphere at heating rate of 10 °C/min.
different heating rates. The apparent activation energies for thermal degradation of polymers were obtained differential (Kissenger) and Integral methods (Flynn-Wall-Ozawa, Kissenger-Akahira- Sunose(KAS). These methods are most widely used of the integral methods that can be determined the activation energy without knowledge of reaction mechanism. Pre-exponential
factor (A) and activation energy (Ea) do not depend on
degradation fraction, but they depend on the temperature.
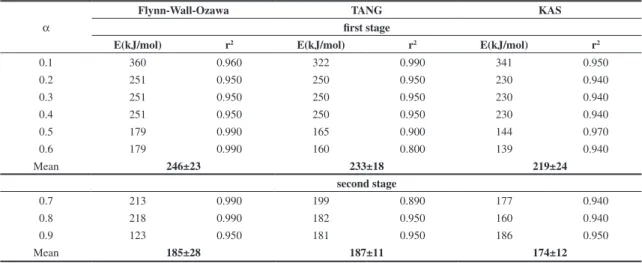
The apparent activation energies (Ea) of the polymers
were estimated by Flynn–Wall–Ozawa, TANG, and KAS. The calculated values are shown in Table 3 and Table 4. Flynn–Wall–Ozawa, TANG, and KAS methods were
first employed to analyze the TG data of P(GaMA) and
P(GaMA-co-st)5 because they were independent of any
thermal degradation mechanism.
Plotting log β and 1000/T as a function of
conversation according to the Flynn-Wall- Ozawa method is calculated for P(GaMA) and P(GaMA-co-st)5. The mean
value activation energies obtained by Tang method were calculated from the slope of the ln (β/T 1.894661) versus
1000/T as 95±12 kJ/mol (first stage), 280±39 kJ/mol (second stage) and 344±1kJ/mol (third stage) for P(GaMA)
and they have found 233±18 kJ/mol (first stage) and
187±11 kJ/mol (second stage) for P(GaMA-co-st).
Finally, KAS method is based on Equation 9 and requires several thermograms (at least four) at different heating rates. The values of activation energies were determined from plots of ln(β/T2) versus 1000/T at same a value. The
Table 3 and Table 4 summarize the activation energies of all stage obtained by the Flynn-Wall-Ozawa, TANG and KAS methods for two polymers.
Conclusion
In conclusion, molecular weight of copolymers could affect to the thermal stability. According to TG data related to the copolymers, molecular weight of polymers increased while the thermal stability decreased. The reason can be lower thermal stability of galactose. DSC curves showed us that when mole feed ratio of sugar was increased the glass transition temperature was also
increased. Tg values of copolymer composition were seen
between P(GaMA) and PS. The thermal degradations of
P(GaMA) and P(GaMA-co-st)5 were evaluated by using
Flynn–Wall–Ozawa, KAS and Tang methods. When the
thermal stabilities of P(GaMA) and P(GaMA-co-st) are
Table 3. The degradation activation energies of P(GaMA-co-st) calculated by Flynn–Wall–Ozawa, TANG, and KAS methods.
α
Flynn-Wall-Ozawa TANG KAS
first stage
E(kJ/mol) r2 E(kJ/mol) r2 E(kJ/mol) r2
0.1 360 0.960 322 0.990 341 0.950
0.2 251 0.950 250 0.950 230 0.940
0.3 251 0.950 250 0.950 230 0.940
0.4 251 0.950 250 0.950 230 0.940
0.5 179 0.990 165 0.900 144 0.970
0.6 179 0.990 160 0.800 139 0.940
Mean 246±23 233±18 219±24
second stage
0.7 213 0.990 199 0.890 177 0.940
0.8 218 0.990 182 0.950 160 0.940
0.9 123 0.950 181 0.950 186 0.950
Mean 185±28 187±11 174±12
Table 4. The degradation activation energies of P(GaMA)calculated by Flynn–Wall–Ozawa, TANG, and KAS methods.
α
Flynn-Wall-Ozawa TANG KAS
first stage
E(kJ/mol) r2 E(kJ/mol) r2 E(kJ/mol) r2
0.1 101 0.990 107 0.990 92 0.950
0.2 76 0.980 83 0.960 67 0.950
Mean 89±12 95±12 80±13
second stage
0.3 260 0.970 241 0.950 261 0.950
0.4 361 0.960 319 0.990 344 0.960
Mean 310±51 280±39 303±41
third stage
0.5 362 0.960 345 0.950 319 0.990
0.6 361 0.960 344 0.960 318 0.990
compared, the calculated activation energies indicate that P(GaMA) is thermally more stable than P(GaMA-co-st)5.
References
1. Weigel, P. H.; Schnaar, R. L.; Roseman, S. & Lee, Y. C. - Methods Enzymol., 83, p.294 (1982). http://dx.doi. org/10.1016/0076-6879(82)83023-1
2. Wulff, G.; Oppermann, W.; Diederichs, H.; Marquardt, U.; Bellmann, S.; Briiggemann, H.; Haselbach, J.; Lorenz, J. & Wehrhahn, D. - Neue Polym. Materialien (1996). 3. Paulsen, H. & Hbffgen, E. C. - Ann. Chem., 5, p.543 (1993). 4. Kobayashi, K. & Sumitomo, H. - Polym. J., 17, p.567
(1985). http://dx.doi.org/10.1295/polymj.17.567
5. Kochetkov, N. K. - Pure. Appl. Chem., 5, p.923 (1984). http://dx.doi.org/10.1351/pac198456070923
6. Dwek, R. A. - Chem. Rev., 96, p.683 (1996). PMid:11848770. http://dx.doi.org/10.1021/cr940283b 7. Okada, M. - Prog. Polym. Sci., 26, p.67 (2001). http://
dx.doi.org/10.1016/S0079-6700(00)00038-1
8. Ladmiral, V.; Melia, E. & Haddleton, D. M. - Eur. Polym. J., 40, p.431 (2004). http://dx.doi.org/10.1016/j. eurpolymj.2003.10.019
9. Cunliffe, D.; Pennadam, S. & Alexander, C. - Eur. Polym. J., 40, p.5 (2004). http://dx.doi.org/10.1016/j. eurpolymj.2003.10.020
10. Spain, S. G.; Gibson, M. I. & Cameron, N. R. - J. Polym. Chem., 45, p.2059 (2007). http://dx.doi.org/10.1002/ pola.22106
11. Fraser, C. & Grubbs, R. H. - Macromolecules, 28, p.7248 (1995). http://dx.doi.org/10.1021/ma00125a030
12. Mortell, K. H.; Gingras, M. & Kiessling, L. L. J. - Am. Chem. Soc., 118, p.209 (1996). http://dx.doi.org/10.1021/ ja953574q
13. Lowe, A. B.; Sumerlin, B. S. & McCormick, C. L. - Polymer, 44, p.6761 (2003). http://dx.doi.org/10.1016/j. polymer.2003.08.039
14. Albertin, L.; Kohlert, C.; Stenzel, M.; Foster, L. J. R. & Davis, T. P. - Biomacromolecules, 5, p.255 (2004). PMid:15002981. http://dx.doi.org/10.1021/bm034199u 15. Albertin, L.; Barner-Kowollik, C.; Stenzel, M. & Davis, T.
P. - Polymer, 47, p.1011 (2006). http://dx.doi.org/10.1016/j. polymer.2005.12.069
16. Ohno, K.; Tsujii, Y. & Fukuda, T. J. - Polym. Chem., 36, p.2473 (1998). http://dx.doi.org/10.1002/(SICI)1099-0518(199810)36:14<2473::AID-POLA5>3.0.CO;2-U 17. Liang, Y. Z.; Li, Z. C.; Chen, G. Q. & Li, F. M. - Polym. Int.,
48, p.739 (1999). http://dx.doi.org/10.1002/(SICI)1097-0126(199909)48:9<739::AID-PI283>3.3.CO;2-Y 18. Ladmiral, V.; Monaghan, L.; Mantovani, G. & Haddleton,
D. M. - Polymer, 46, p.8536 (2005). http://dx.doi. org/10.1016/j.polymer.2005.01.104
19. Narain, R. & Armes, S. P. - Chem. Commun., 23, p.2776 (2002). http://dx.doi.org/10.1039/b208654a
20. Chen, Y. M. & Wulff, G. - Macromol. Rapid Commun., 23, p.59 (2002). http://dx.doi.org/10.1002/1521-3927(20020101)23:1<59::AID-MARC59>3.0.CO;2-V 21. Grande, D.; Baskaran, S.; Baskaran, C.; Gnanou, Y. &
Chaikof, E. L. - Macromolecules, 33, p.1123 (2000). http:// dx.doi.org/10.1021/ma991579s
22. Sun, X. L.; Grande, D.; Baskaran, S.; Hanson, S. R. & Chaikof, E. L. Biomacromolecules, 3, p.1065 (2002). PMid:12217054. http://dx.doi.org/10.1021/bm025561s 23. Wu, P.; Malkoch, M.; Hunt, J. N.; Vestberg, R.; Kaltgrad,
E.; Finn, M. G.; Fokin, V. V.; Sharpless, K. B. & Hawker, C. J. - Chem. Commun., 46, p.5775 (2005). PMid:16307142. http://dx.doi.org/10.1039/b512021g
24. Srinvasachari, S.; Liu, Y.; Zhang, G.; Prevette, L. & Reineke, T. M. - Am. Chem. Soc., 128, p.8176 (2006). 25. Clode, D. M. - Chem Rev., 79, p.491 (1979).
26. Xavier, N. M. & Rauter, A. P. - Carbohydrate Res., 343, p.1523 (2008). http://dx.doi.org/10.1016/j. polymdegradstab.2010.03.003
27. Lee, S.; Jin, B. S. & Lee, J. W. - Macromol. Res., 14, p.491 (2006). http://dx.doi.org/10.1016/j. polymdegradstab.2010.05.011
28. Wang, D.; Das, A.; Leuteritz, A.; Boldt, R.; Häußler, L.; Wagenknecht, U. & Heinrich, G. - Polym. Degrad. Stabil., 96, p.285 (2010). http://dx.doi.org/10.1016/j. eurpolymj.2006.12.018
29. Yuzay, I. E.; Auras, R.; Soto-Valdez. & Selke H. S. - Polym. Degrad. Stabil., 95, p.1769 (2010). http:// dx.doi.org/10.1002/1097-4628(20010502)80:5<776::AID-APP1154>3.0.CO;2-8
30. Hamciuc, C.; Vlad-Bubulac, T.; Petreus, O. & Lisa, G. - Eur. Polym. J., 43, p.980 (2007).
31. Fraga, F. & Nũňez, E. R. - J. Appl. Polym. Sci., 80, p.776 (2001). http://dx.doi.org/10.1016/j.tca.2006.07.022 32. Dogan, F.; Akat, H.; Balcan, M.; Kaya, I. & Yurekli, M. - J.
Appl. Polym. Sci., 108, p.2328 (2008). http://dx.doi. org/10.1021/ja01273a502
33. Janković, B.; Adnađević, B. & Jovanović, J. - Thermochimica Acta, 452, p.106 (2007).
34. Grunenberg, H. V.; Bredt, C. & Freudenberg, W. J. - Am. Chem. Soc., 60, p.507 (1938). PMid:15498015. http:// dx.doi.org/10.1021/jo048957y
35. Fréchet, J. M. J.; Kelly, J. & Sherrington, D. C. - Polymer, 35, p.1491 (1984). http://dx.doi.org/10.1002/app.36888 36. Barros, M. T.; Petrova, K. T. & Ramos, AM. - J. Org.
Chern., 69, p.7772 (2004).
37. Yildirim, Y.; Dogan, B.; Muglali S.; Saltan, F.; Ozkan, M. & Akat, H. - J. Appl. Polym. Sci., 126, p.1236 (2012). 38. Ahmad, Z.; Al-Awadi, N. A & Al-Sagheer, F. - Polym.
Degrad. Stabil., 93, p.456 (2008).