Development of a Flow Injection System with Two Analytical Paths
for Ammonium Determination in Soil Extracts by Conductometry
Boaventura F. Reis*a, Jonas A. Vieirab, Francisco José Kruga, and Maria Fernanda Ginéa
a
Centro de Energia Nuclear na Agricultura, Universidade de São Paulo, Av. Centenário, 303, C.P. 96, 13 400-970 Piracicaba - SP, Brazil
b
Instituto de Química de São Carlos
Received: November 11, 1996
Um sistema de análise química em fluxo com dois percursos analíticos foi desenvolvido para determinação de amônio em extratos de solo por condutometria. A amônia era gerada em linha em um meio alcalino, permeava através de uma membrana hidrofóbica (TPFE), sendo coletada em fluxo de água desionizada que transportava o analito para a cela de condutividade. O módulo de análise compreendia dois percursos analíticos independentes, para aumentar a frequência de amostragem. O sistema foi utilizado para determinar amônia em extratos de solos em KCl 2 mol L-1. Apresentou uma produtividade analítica de 100 determinações por hora, desvio padrão relativo de 2% e recuperação de 99,9%.
A flow injection system with two analytical paths for ammonium determination in soil extracts by conductometry is described. The ammonia generated on line in an alkaline medium is permeated through a hydrophobic membrane (TPFE), collected by a deionized water stream and directed toward the conductivity flow cell. The flow network was designed with two analytical paths in order to increase the analytical throughput. The procedure was used to determine ammonium in 2 mol L-1 KCl soil extracts and allowed 100 determinations per hour with a relative standard deviation (r.s.d) of about 2% and an average recovery of 99.9% for a typical sample with concentration of 2.1 mg NH4+ L1-.
Keywords: ammonium determination, flow analysis, conductometric detection, analysis
of soil extracts
Introduction
Available ammonium ions in soils is an important pa-rameter for consideration in plant nutrition and soil fertility studies. Usually, a 2 mol L-1 KCl solution is used to extract ammonium ions in soil samples1. This high salt concentra-tion may cause difficulties in employing spectrophotomet-ric determinations, mainly those based on the Nessler2 or the Berthelot methods3. In addition, the reagents used in both methods contain mercury and phenol, respectively, and should be avoided. Ammonium determination can also be performed using titrimetry but this procedure presents low throughput since a distillation step is necessary.
Studies of soil fertility usually require the analysis of the ammonium ion in a large number of samples. Therefore, the availability of automated analytical methods presenting high throughput is very important. Among the automated analytical procedures, flow injection could be selected, considering its versatility, its inherent high throughput, and its precision4,5,6.
of KCl (2 mol L-1) could cause interference as indicated elsewhere6.
Flow injection modules with the on-line ammonia gen-eration to separate it from the sample bulk has been pro-posed earlier. This was done by diffusing the gas through an air gap that separates the sample carrier and the acceptor solution streams7, or by permeating the gas through a hydrophobic membrane8,9. Using these procedures ammo-nia is collected by an aqueous stream which flows parallel with the sample carrier stream inside the separation cham-ber. In the acceptor stream, ammonia is again converted to ammonium ions that are detected by conductometry8 or by spectrophotometry7,9. Ammonia separation with a hydro-phobic membrane is more commonly used than that with an air gap and has been employed for conductometric analysis of plant digests with high ammonium concentra-tions8.
The advantages of ammonium determination by con-ductometry, including the instrumentation simplicity and the requirement of a hydroxide solution as the only reagent, make it an attrative alternative to replace methods using mercury or phenol2,3. In this work, a flow injection proce-dure employing conductometry was developed to deter-mine ammonium in soil extracts. The content of ammonium in some types of soils is generally lower than 1 mg L-1. Therefore, to attain the appropriate limit of de-tection, it is necessary to use a large volume of sample for analysis. Ammonium permeation through a hydrophobic membrane is a slow process, resulting in an analytical method with a low sampling rate in comparison with other flow procedures. This disadvantage becomes more drastic for samples with low ammonium content and when a large number of samples must be analyzed. Considering this fact, the flow network was designed with two analytical paths in order to increase the analytical throughput by sequential sampling and detection.
Experimental
Reagents
Chemicals of analytical-reagent grade and freshly dis-tilled and deionized water were used throughout. All re-agents, standard solutions, and samples were stored in clean polyethylene bottles.
The stock ammonium solution 1000 mg NH4+ L-1 was prepared by dissolving 3.666 g of ammonium sulfate in water and diluting to 1000 mL.
The soil extracting solution, 2 mol L-1 KCl, was pre-pared by dissolving 149.1 g of the salt in water and diluting to 1000 mL with water.
The alkaline solution, 1.5 mol L-1 NaOH was prepared by dissolving 54.9 g NaOH in water and diluting to 1000 mL.
Working standard solutions of 0.00, 0.25, 0.50, 1.00, 2.00, 3.00 and 4.00 mg NH4+ L-1 were prepared by dilution of the stock solution with the 2 mol L-1 KCl solution.
Soil extracts in 2 mol L-1 KCl were prepared as de-scribed elsewhere1 and were refrigerated until analysis.
Apparatus
The flow set up consisted of a B330 Micronal conduc-tometer, a REC 61 Radiometer strip chart recorder, a MP13 Ismatec peristaltic pump furnished with pumping Tygon tubes, a proportional injector made in Perspex with two switching sections9, two electric switches with double con-tacts being one normaly open and the other closed, helicoi-dal reaction coils and transmission lines (0.8 mm i.d.) of polyethylene tubing, two gas permeation units, and two stainless steel conductivity cells.
The gas permeation units were constructed from two Perspex blocks (20 x 5 x 2 cm). A silicone rubber strip (20 x 2.5 x 0.005 cm) was glued to the face of each Perspex block. A channel (8 x 0.02 cm) was made in the rubber strip as indicated in Fig. 1. A PTFE tape was placed on one of the rubber strips covering the channel. The unit was assem-bled by attaching the two Perspex blocks together with screws. The PTFE tape was sandwiched between them, so the channel on both sides forms the flow pathway in the permeation units where the donor and acceptor streams flow. The rubber strips were used to avoid fluid leakage and to provide a soft contact with PTFE tape to increase life time of the unit.
The conductivity flow cells were constructed from two Perspex cylinders of 40 mm diameter and 30 mm depth. In each cylinder, an axial hole of 15 mm diameter was drilled, and a stainless steel cylinder was inserted in this hole as indicated in Fig. 2. The metal cylinder was sealed with epoxy glue to avoid fluid leakage. A disk of silicone rubber (25 mm diameter) with a slit (10 x 2 mm) was placed on the metallic surface (detail in Fig. 2). The conductivity flow cell was assembled by attaching the two Perspex cylinders together with screws, sandwiching the rubber disk between them. The slit on the rubber disk provides the electric
A
D
R u b b e r
P T F E
contact between both electrodes during flow of solution, allowing the detection of the solution conductivity.
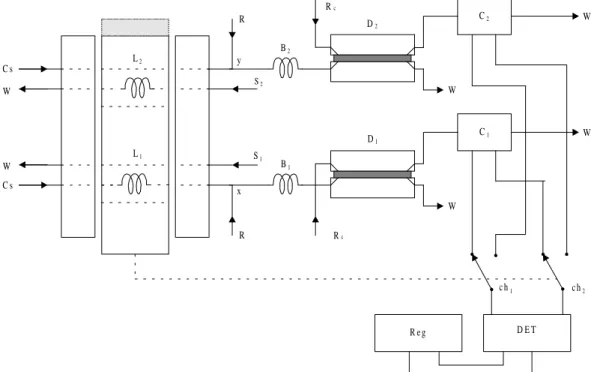
Flow set up and experimental variables
The flow set up is depicted in Fig. 3. In the position shown, the solution inside loop L1 is displaced by the carrier stream (Cs) toward the gas permeation unit (D1). At the confluence point (X), sodium hydroxide solution (R) is added, and the ammonium ions are converted to ammonia
(NH3) while passing through the reaction coil (B1). While the solutions flow through the permeation unit toward waste (W), part of the generated ammonia permeates through the PTFE membrane and is collected into the acceptor stream (Rc). Ammonia is converted to ammonium ions in the acceptor stream solution while carried to the conductivity flow cell (C1). This device is electrically con-nected to the conductometer (DET) by means of the electric switches ch1 and ch2 for detection. Variation in conductiv-ity is converted to a variation in electric potential, which is recorded by the strip chart recorder (Reg) as a function of time. While the described steps are occurring, the sample S2 flows through the sampling loop L2 toward waste.
Changing the injector to the other resting position by displacing the sliding bar, the sampling loop L1 is loaded with another sample (S1) and the sampling loop L2 is inserted into the analytical path composed of reaction coil (B2), gas permeation unit (D2) and conductivity flow cell (C2). A mechanism attached to the sliding bar of the injector (dashed line) performs the switching of the electric switches ch1 and ch2 to connect the conductometer to the conductivity flow cell C2 instead of C1. Sample processing and signal measurement occur as previously described.
To establish the optimal operational conditions, experi-ments were performed by varying the sampling loop length and the carrier and acceptor streams flow rates.
S TA IN L E S S S T E E L
S C R E W
R U B B E R to C H
to C H1 2
Figure 2. Diagram of the conductivity flow cell. The Perspex cylinder attached by screws with a central stainless steel cylinder (solid gray) where the electric contacts were fixed. The middle of the cell is represented on the detail with a rubber (in dark) with a channel over the metallic cylinder.
W
W
W
W R
R R c
Rc
C s C s
x y
S1 B2
B1
D2
1 D
c h1 c h2
W
W C2
C1
R e g D E T
S2 L2
L1
Results and Discussion
The analytical signal obtained by flow systems with phase separator devices like gas permeation membranes must be optimized by adjusting the carrier and acceptor stream flow rates. Experimental results used to determine the optimal conditions with respect to residence time and dispersion are shown in Figs. 4, 5 and 6.
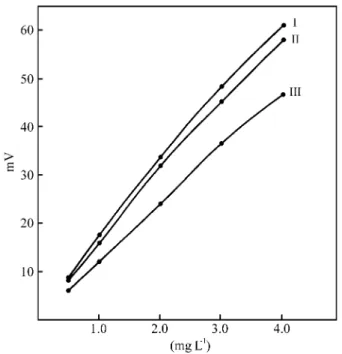
An increase in the analytical signal greater than 100% was observed when a sampling loop of 50 cm was used and the sample carrier flow rate changed from 6.0 to 1.6 mL min-1 as shown in Fig. 4. When a 100 cm sampling loop was employed using the same flow rates, the observed increase in signal was about 40% as shown in Fig. 6. In both cases the acceptor flow rate was maintained at 1.6 mL min-1.
By increasing the sample carrier flow rate, less ammo-nia permeates the membrane due to the decrease in average residence time. On the other hand, when the sampling loop length was doubled, two effects must be considered: the sample zone broadening and dispersion in the carrier solu-tion. Broadening the sample zone requires a long time-in-terval for transport through the permeation unit. In addition, decreasing the sample dispersion increases the ammonia partial pressure of the carrier solution due to the enhance-ment of the permeation rate. These two parameters favor-ably affect the ammonium permeation through the membrane. The permeation conditions were not a problem for determination of ammonium in plant digests7 due to the high analyte concentrations of the samples, however, in soil extracts this parameter must be considered.
The slopes of curve I in Fig. 6 and curve II in Fig. 5, are approximately equal (∆V/∆C ≅ 12). These two curves were obtained using the same parameters. Similar behavior is demonstrated by curves II in Figs.4 and 6. Considering these results, flow rates of 3 mL min-1 and 2.5 mL min-1 for the sample carrier and ammonia acceptor, respectively, were established for further experiments.
Figure 6. Effect of the sampling loop length. Curves I and II obtained with sampling loop of 100 and 50 cm long, respectively, Other parameters as in Fig. 3.
Figure 5. Effect of the sample carrier flow rate. Curves I, II and III obtained with sample flow rates of 1.6, 3.0 and 6.0 mL/min, respectively and sampling loop of 100 cm long. Other parameters as in Fig. 3.
Peaks recorded in Fig. 7 demonstrate how the analytical throughput was improved using the proposed flow net-work. The recorder tracing a was obtained by operating the flow system without switching ch1 and ch2 from C1 to C2, thus a FIA peak with a long tail is obtained due to the sample dispersion into the carrier stream. The peak profile reflects the intrinsic characteristic of the flow system di-mensions and the chemical solutions employed. Peak b was obtained by switching ch1 and ch2 from C1 to C2 immedi-ately after attaining the maximum peak height of the ana-lytical signal. As a result, the signal returned abruptly to the baseline. The time interval required to obtain peak profiles a and b, were about 60 and 20 s, respectively. This time
difference could be decreased by increasing the overall flow rate, but in this work the flow rates were optimized for maximum sensitivity as shown in Figs. 4 and 5. The simul-taneous movement of the injector and switches between the conductivity flow cells defined the analytical throughput. In routine analysis an average of 120 determinations per hour could be achieved.
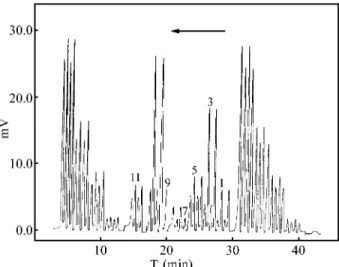
The set of recorder tracings at c in Fig. 7 shows the sequence of signals obtained by using both analytical chan-nels. The proposed flow network comprises two analytical paths, and as their dimensions are not identical, this set of peaks reveals differences in the baseline and in sensitivity. The gas permeation rate through PTFE membrane is ex-pected to be proportional to the membrane surface interfac-ing the donor and acceptor fluids. In this instance, some difference in the channel dimensions of the permeation unit (Fig. 1) could generate the difference in sensitivity ob-served. Also, some difference in the conductivity area could contribute to the effect on the baseline. The difficulty of constructing two identical analytical channels to achieve the same baseline and signal sensitivity made it imperative to calibrate both channels independently. The routine graph
Figure 8. Recording related to a set of standards and samples. From right to left peaks in duplicate obtained with standard solutions of 0.5, 1.0, 2.0 and 3.0 mg NH4+ L-1 for each analytical path, followed by those of 12 samples in duplicate and the standards again. Samples signed by odd numbers were analyzed by the analytical path comprised by reaction coil B1, permeation unit D1 and conductivity flow cell C1.
Figure 7. Effect of switching the conductivity flow cell. From right to left, a peak profile obtained from one conductivity flow cell, b peak profile obtained by switching from C1 to C2 (Fig. 3) at peak maximum followed by a set of recorder tracing obtained running the flow set up with a 3.0 mg NH4+ L-1 standard solution. Other parameters as in Fig. 3.
Table 1. Results of the recovery test after addition of 0.5 mg NH4+ l-1 to different soil extracts.
Soilextract Concentration (mg/L)*
Recovery (%)
1 0.94 96
2 1.43 98
3 1.05 102
4 0.66 101
5 1.39 97
6 1.47 99
7 1.01 104
8 1.18 102
9 1.10 100
10 0.45 97
11 0.46 98
12 1.04 104
13 0.95 105
14 1.16 102
15 1.70 96
16 1.63 101
17 1.42 96
18 1.51 99
19 1.80 103
20 1.02 98
showing a sequence of standard and sample solutions for the two independent analytical paths is shown in Fig. 8. Soil extract results are shown in Fig. 8 where it is possible to identify, without difficulty, the peaks of each sample. By observing the peaks corresponding to the two sets of stand-ard solutions (right and left in Fig. 8), one can conclude that the system is very stable. The reliability was tested by standard addition, and results are characterized by recover-ies of 96-105% (Table 1). Another feature was a relative standard deviation better than 2% calculated from 8 se-quential measurements obtained for a sample of 1.04 mg NH4+ L-1.
Conclusions
The flow system with two analytical channels for am-monium determination using sequential detection from two conductivity flow cells, allows a higher sample throughput than the single channel configuration. The conductometric method is robust for ammonium determination in high saline samples (2 mol L-1KCl soil extracts) even at low concentrations. This is a clean method and could be em-ployed instead of those based on mercuric or phenolic reagents.
Acknowledgments
The authors thank CNPq (Conselho Nacional de Desen-volvimento Científico e Tecnológico), CAPES
(Coorde-nadoria de Aperfeiçoamento de Pessoal de Nível Superior) for financial support, and Helen Boylan for language im-provements.
References
1. Piccolo, M.C.; Neil, C.; Cerri, C.C. Plant and Soil 1994, 162, 61.
2. Stewart, J.W.B.; Ruzicka, J.; Bergamin F, H.; Zagatto, E.A.G. Anal. Chim. Acta 1976, 81, 371.
3. Hansen, E.H.; Krug, F.J.; Ghose, A.K.; Ruzicka, J.
Analyst 1977, 102 714.
4. Ruzicka, J.; Hansen, E.H. In Flow Injection Analysis; 2nd Ed. John Wiley & Sons, New York, 1988. 5. Valcarcel, M.; Luque de Castro, M.D. In
Flow-Injec-tion Analysis; John Wiley & Sons, N. York, 1987.
6. Esmadi, F.T.; Kharoaf, M. Abdulrahman Anal. Lett. 1990, 23(6), 1086.
7. Zagatto, E.A.G.; Reis, B.F.; Bergamin F, H.; Krug, F.J. Anal. Chim. Acta 1979, 109, 45.
8. Faria, L.C; Pasquini, C. Anal. Chim. Acta 1991, 245, 183.
9. Tryzell, R.; Karlberg, B.; Anal. Chim. Acta; 1995, 308, 206.
10. Reis, B.F.; zagatto, E.A.G., jacintho; A.O., Krug, F.J.; Bergamin F, H. Anal. Chim. Acta 1980, 119, 305.