A Multibiometric Speaker Authentication
System with SVM Audio Reliability Indicator
Abstract—Performances of biometric speaker authentication systems are good in clean conditions but their reliability drops severely in noisy environments. Implementation of multibiometric systems using audio and visual experts is one of the solutions to this limitation. In this study, weighting for fusing the audio and visual expert scores is proposed to be adapted corresponding to the current environment. Frequent approach uses fixed weighting but this is inappropriate if the systems are executed in uncertain conditions. In this study, we propose a novel approach by introducing Support Vector Machine (SVM) as indicator system for audio reliability estimation. This approach directly validate the quality of the incoming (claimant) speech signal so as to adaptively change the weighting factor for fusion of both subsystems scores. It is important to priory check the speech signal quality because unreliable speech data give incorrect scores hence affect the accuracy of the total scores of the fusion systems. The effectiveness of this approach has been experimented to a multibiometric authentication system that employs lipreading images as visual features. This system uses SVM as a classifier for both subsystems. Principle Component Analysis (PCA) technique is executed for visual features extraction while for the audio feature extraction; Linear Predictive Coding (LPC) technique has been utilized. In this study, we found that the SVM indicator system is able to determine the quality of the speech signal up to 99.66%. For comparison, EER percentages at 10dB are observed as 51.13% for audio only system, 9.3% for fixed weighting system and 0.27% for adaptive weighting system.
Index Terms—multibiometric system, authentication system,
reliability indicator, Support Vector Machine.
I. INTRODUCTION
Biometric speaker authentication is a science of executing behavioral and physiological information of speech signal for the purpose of authentication of individual for identity claim. According to [1], [2], the advantages of using speech signal trait for biometric systems are that the signal is natural and
Manuscript received October 14, 2009. This work was supported by Fundamental Research Grant Scheme, Malaysian Ministry of Higher Education, FRGS UKM-KK-02-FRGS0036-2006 and Science Fund, Malaysian Ministry of Sciences, Technology and Innovation 01-01-02-SF0374.
Dzati Athiar Ramli is with School of Electrical & Electronic Engineering, Universiti Sains Malaysia, MALAYSIA and currently as PHD candidate at Department of Electrical, Electronic & System Engineering, Engineering Faculty, Universiti Kebangsaan Malaysia, MALAYSIA, e-mail: [email protected], [email protected] ).
Salina Abdul Samad is with the Department of Electrical, Electronic & System Engineering, Engineering Faculty, Universiti Kebangsaan Malaysia, MALAYSIA (e-mail: [email protected]).
Aini Hussain is with the Department of Electrical, Electronic & System Engineering, Engineering Faculty, Universiti Kebangsaan Malaysia, MALAYSIA (e-mail: [email protected]).
Dzati Athiar Ramli, Member, IAENG Salina Abdul Samad Aini Hussain
easy to produce, requiring little custom hardware, has low computation requirement and is highly accurate (in clean noise-free conditions). However, in uncontrolled conditions, the reliability of the system drops severely as the signal to noise ratio (SNR) of the speech signal decreases. This becomes the main problem when utilizing speech signals for biometric systems.
Furthermore, since voice is categorized as a behavioral signal, the signal is likely to vary in time due to the change of speaking rates, health and emotional conditions of speakers. Different microphones and channels also affect the accuracy of the system performance. Consequently, the implementation of biometric systems has to appropriately discriminate the biometric features from one individual to another, and at the same time, the systems also need to deal with the distortions of the features. One of the solutions to overcome these limitations is by implementing fusion approach to the biometric system [3].
This research proposes two methods to overcome these problems. First, multibiometric systems that integrate information from speech and lipreading traits are suggested. Implementation of multibiometric systems can enhance the performances of audio only systems in clean conditions. In noisy conditions, this implementation can maintain the verification performances by using the information from the lipreading expert that might give a correct verification. Moreover, multibiometric systems tackle the problem of spoof attack since it is difficult for an intruder to simultaneously spoof the multiple biometric information of a legitimate user.
With prior knowledge about the quality of current speaker’s speech signal proposed in adaptive weighting approach, the contribution of the audio expert weight can be adapted according to the reliability of the current speaker’s speech signal. This practice is imperative in order to avoid the unreliable audio score to be fused together in the total score hence spoils the accuracy of the fusion systems.
Research on fixed weighting approach can be found in [4]. This study has presented fusion of scores produced independently by speaker recognition system and face recognition system using a weighted merged score. The optimal weight was found by maximizing the performance of the integrated system on one of the available training sets. The identification of 51% was achieved for the speech only system and 92% for the face only system. Consequently, 95% performance is observed by the integration system using the optimal weight.
In another study, a weighted product approach to fuse two voice features i.e. static and dynamic and three face features i.e. eye, noise and mouth was evaluated [5]. The tan-estimators were used for score normalization and weighted geometric average was used for score combination. The correct identification rate of the integrated system is 98% which represents a significant improvement with respect to the 88% and 91% rates provided by the speaker and face recognition systems respectively. Reference [5] combined different biometric cues i.e. voice, lip motion and face image. The EER performance of face recognition, voice recognition and integrated face and voice recognition are obtained as 3%, 3.4% and 1.5% from this experiment.
Reference [6] integrated the scores of speech and lip modality using weighted summation fusion. The performance of the integrated system outperformed each subsystem and reduced the false acceptance rate of the speech subsystem from 2.3% to 0.5%. In another experiment, information from speaker verification system (SVS) and profile verification system (PVS) using a weighted summation fusion was combined [7]. A weighting factor
is fixed between 0 and 1. Fusion system using gives verification rates of 95.57% (40dB) and 72.82% (5dB) while performances of 90.31% (40dB) and 78.75% (5dB) are then observed using .
w 33 . 0 = w
5 . 0 = w
In [9], a novel fuse-HMM that integrates the audio and visual features of speech was reported. In this method, the learning algorithm maximizes the two HMMs separately and consequently fuse the HMM by Bayesian fusion method. The experimental results showed that the fuse-HMMs constantly performed better than the unimodal method under clean and low noise conditions. But under stronger noise level, the performance of the fusion systems is worse compared to the speech only system. Multistage information fusion by taking both feature fusion and decision fusion approach was implemented in [10]. The study observed that the multistage system achieves significant improvement over both feature fusion and decision fusion system at different SNR levels.
For the adaptive weighting approach, the reliability estimation of the current speech signal is performed either relying on the statistics-based measure or directly based on the quality of the speech signal. Here, the weight for fusion
scheme is adapted correspondingly to the quality of the current input (claimant) speech signal instead of using the optimum weight that is estimated from the available training set. Two methods have been proposed for the statistics based reliability measures i.e. entropy of a posteriori probabilities and dispersion of a posteriori probabilities. The reliability information can be obtained by the shape of a posteriori probabilities distribution of HMM states, GMM and MLP as studied in [11], [12] and [13], respectively. A high entropy interprets low confidence hence signifies very unreliable input. Consequently, a mapping function between the entropies and the corresponding weight is calculated.
On the other hand, study on reliability estimation based on the quality of the speech signal was reported in [13]. This study described the use of voicing index as audio reliability measure. Voicing index is a ratio of the energy of the harmonic to the non-harmonic components contain in particular signal. Implementation of the degree of voicing index as reliability measure is also reported in [14]. This study proposes a hybrid cascaded fusion by taking the output score reliability estimates of each audio-video based module for biometric person authentication task using AVOZES database contained 20 subjects. The results show that at severe level of audio and video mismatch (21dB SNR), the audio, mouth, 3D face and fusion module EER performances are 42.9%, 32%, 15% and 7.3%, respectively.
In this study, we propose a novel approach by introducing Support Vector Machine as indicator system for audio reliability measure. The development of the overall system is made up of 3 subsystems i.e. an audio front-end subsystem, a visual front-end subsystem and a fusion subsystem. For audio front-end subsystem, a vector of LPC coefficients is computed from the autocorrelation vector using Durbin recursion method. The LPC-derived cepstral coefficients (cepstrum) are then extracted.
For the visual front-end subsystem, lipreading features are employed to the system. Lipreading features are the sequence of lip images while the speaker utters the words for example, zero to nine. The advantages of utilizing lipreading features together with speech signals include the simple process of data collection and the cost effective factor since they can be simultaneously captured using the same hardware, i.e., digital video camera. In addition, the use of lip features, compared with face, can also minimize the storage capacity and increase the speed of computation as well. Several researches using lip information as features to recognition systems have been reported. As in [15], shape and intensity information from a person’s lip were used in a speaker recognition system. The utilization of geometric dimension such as height, width and angle of speaker’s mouth as features was also investigated [16]. Apart from lip contour-based features, pixel-based features i.e. Discrete Cosine Transform (DCT) has also been experimented as features for person recognition in [17].
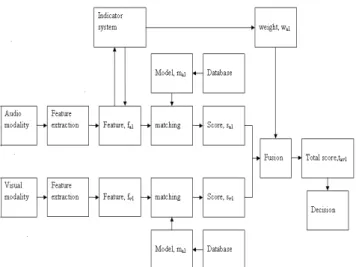
architecture of the proposed multibiometric system with adaptive weighting is illustrated in Fig. 1.
Fig. 1 Multibiometric system with adaptive weighting approach
The database used in this study is the Audio-Visual Digit Database (2001) [18]. The database consists of video and the corresponding audio recording of people reciting digits zero to nine. The video recording of each person is stored as a sequence of JPEG images with a resolution of 512 x 384 pixels while the corresponding audio recording provided is a monophonic, 16 bit, 32 kHz, WAV format. For the purpose of evaluating the systems in noisy conditions, the clean testing audio data are corrupted into 30dB, 20dB and 10dB SNR data by using the simulated additive white Gaussian noise (AWGN). Due to the objective of this research is to investigate the biometric systems in uncertain audio condition, no artificial degradation was imposed to the visual data. However, some natural challenges such as facial expression, pose and illumination invariant are occurred within the sequence of the images and from session to session.
The first objective of this study is to develop an audio only biometric system with SVM classifiers and then to investigate its performances based on different numbers of training data and also its performances at different levels of audio conditions. Secondly, to develop visual only biometric system with SVM classifiers and then to investigate its performances based on different numbers of training data. Thirdly, to perform optimum weight estimation experiments and subsequently to develop multibiometric system using fixed weighting approach. Systems performances at different levels of audio conditions are then evaluated. Finally, to develop an audio reliability indicator system based on SVM classification in order to estimate the quality of current speaker’s speech signal hence to investigate its capability to estimate the quality of speech signal. Consequently, multibiometric system using adaptive weighting approach is developed and its performance at different levels of audio conditions is evaluated. This study also compares the performances of the adaptive fusion system with the fixed fusion system and audio only system at different levels of SNR.
This paper is organized as follows. In section II, the theory
of Support Vector Machine is explained. Section III and IV describe the audio front-end subsystem and visual front-end subsystem, respectively. Fusion and verification module is then represented in section V. In section VI, we discuss our results and finally, some conclusions are summarized in section VII.
II. THEORY OF SUPPORT VECTOR MACHINE
This section aims to provide a description of the fundamental ideas behind support vector machine (SVM) classifier which was developed in the early to mid 1990s. Support vector machine (SVM) classifier in its simplest form, linear and separable case is the optimal hyper plane that maximizes the distance of the separating hyper plane from the closest training data point called the support vectors [19], [20].
From [19], the solution of a linearly separable case is given as follows. Consider a problem of separating the set of training vectors belonging to two separate classes,
( ) (
)
{
x y xL yL}
D= 1, 1,... , , (1)
{
1, 1, ∈ − − ℜ
∈ y
x n
}
with a hyperplane,
0 ,x +b=
w (2)
The hyperplane that optimally separates the data is the one that minimizes
2
2 1 ) (w = w
φ (3)
which is equivalent to minimizing an upper bound on VC dimension. The solution to the optimization problem (3) is given by the saddle point of the Lagrange functional (Lagrangian)
∑ ⎟
⎠ ⎞ ⎜
⎝
⎛ −
⎥⎦ ⎤ ⎢⎣
⎡ +
− =
=
L
i
i i
i y w x b
w b
w
1 2
1 ,
2 1 ) , ,
( α α
φ (4)
where αare the Lagrange multipliers. The Lagrangian has to be minimized with respect to and maximized with respect to
b , w 0
≥
α . Equation (3) is then transformed to its dual problem. Hence, the solution of the linearly separable case is given by,
∑ − ∑ ∑
=
= = =
L
k k L
i L
j i j i j i j x x y y
1
1 1
, 2
1 min arg
* αα α
α
α (5)
with constrains,
∑ =
= ≥
=
L
j j j
i i L y
1
0
and ,..., 1 ,
0 α
α (6)
non-separable case. Non-separable case is considered by adding an upper bound to the Lagrange multipliers and non-linear case is considered by replacing the inner product by a kernel function. The solution of the non-linear and non-separable case is given as:
(
)
− ∑∑ ∑ =
= = =
L
k k L
i L
j i j i j i j x x K y y
1
1 1
, 2
1 min arg
* αα α
α
α (7)
with constrains, ,..., 1 ,
0≤αi≤C i= L (8)
∑ =
=
L
j j j y
1
0
and α x
( )
t =(
s( )
t −0.95) (
∗xt−1)
(9)In common, the kernel functions are polynomials, radial basis functions and certain sigmoid functions. In this study, polynomial kernel is employed.
III. AUDIO FRONT-END SUBSYSTEM
According to [21] and [22], Linear Predictive Coding is a time domain analysis that approximates a speech sample as a linear combination of past speech samples. A unique set of predictor coefficients are determined by minimizing the sum of the squared differences between the actual speech samples and the linearly predicted ones. Let assume the relation between the present sample x
( )
m and first-order linear combination of the previous samples as in equation (10) below.p
( )
m x(
m)
... px(
m p)
x ≈α1 −1+ +α − (10)
Consequently, LPC cepstrum coefficients can be derived through the LPC model. For a time sequence , complex cepstrums are represented as below:
( )
m x mcˆ
1 1=−α
cˆ (11)
n m cˆ n m
n m
n m
m
cˆ − −
= ⎟⎠ ⎞ ⎜ ⎝ ⎛ − − −
= α ∑1 α
1
1 , 1<m≤ p (12)
n m cˆ n p
n m
n m
cˆ −
= ⎟⎠ ⎞ ⎜ ⎝ ⎛ − −
= ∑ α
1
1 , m>p (13)
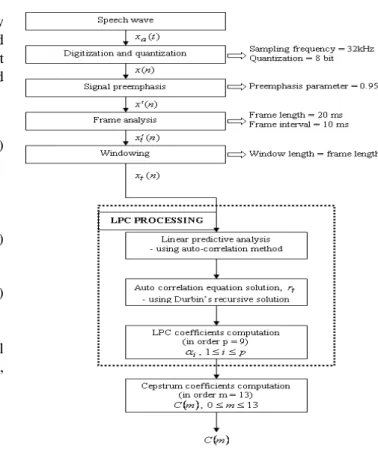
The steps for obtaining Linear Predictive Coding (LPC) are summarized in Fig. 2. The parameter values that have been used at each stage of the experiment are also indicated. A set of feature vector computed from each frame consists of 14 cepstrum coefficients.
Fig. 2 The process of LPC feature extraction Experiments for audio only biometric system are divided into two categories. Firstly, to evaluate the system using different numbers of training data and secondly, to evaluate the system based on different SNR levels.
Clean training speech data and clean testing speech data are used for this purpose. In order to model the classifier discriminatively, each speaker model is trained using 3, 6, 10 and 20 client data as well as with 108, 216, 360 and 720 imposter data, respectively. Thus, four types of speaker models are developed for each speaker. During testing, each type of speaker model from each speaker is tested on 40 client data and 1440 (40x36) imposter data from the other 36 persons.
Consequently, three experiments are conducted in order to evaluate the system based on different SNR levels. For this purpose, clean data are used for speaker modeling. Each speaker model is trained using 20 client training data and 720 (20x36) imposter training data. Three levels of corrupted testing data i.e. 30dB, 20dB and 10dB SNR data are used. During testing, speaker model from each speaker is tested on 40 client data and 1440 (40x36) imposter data from the other 36 persons for each level of the corrupted signals.
IV. VISUAL FRONT-END SUBSYSTEM
owing to its robustness under a wide range of lip colours and varying illumination condition. From the hue-saturation image, a binary image is then computed followed by morphological image processing so as to determine lip region.
The lip regions of 64 x 64 pixels are then extracted for evaluation. Our lipreading database has 22200 images in total size 64x64 pixels from 37 persons. For each person, 60 sequences of images (with 10 images per sequence) have been utilized.
Consequently, Principle component analysis (PCA) technique or also known as Karhunen-Loeve method is used for dimensionality reduction. This statistical method aims to obtain an optimum linear subspace from a covariance matrix of a set of samples [26]. This technique executes linear projection on the original samples that maximizes the scatter (variance) of all projected samples. This technique is beneficial for reducing storage capacity because the projected features are presented in a lower dimensionality space compared to the original sample space. The overall feature extraction process using PCA technique is summarized in Fig. 3.
Fig. 3 The process of PCA feature extraction
Theory of PCA technique for feature extraction can be simply stated as follows. Given a set of N sample images , where each image in the set is lethographically re-ordered in L
i
x
M i=1,2,L,
2
dimensional space and belongs to one of the
c classes . By considering a linear
transformation mapping, the original sample in dimensional space are then transformed into a P-dimensional feature space, where
{
C1,C2,L,Cc}
2
L
2
L M
P<< << . The new transformed features , is known as subspace and the process of transforming is called projection.
In PCA, the transformation process is executed by the following linear transformation:
i
y i=1,2,L,M
i T i U x
y = , i=1,2,L,M (14)
where U∈ℜL2 x P represents matrix of Eigen pictures in P
L2x and P corresponding to the P largest Eigen values. The transformed lip features are then used for the verification process using SVM as classifier. The purpose of visual biometric system experiment is to evaluate the systems using different numbers of training data. Clean training visual data and clean testing visual data are used for this purpose. In order to model the classifier discriminatively, each speaker model is trained using 3, 6, 10 and 20 client data as well as with 108, 216, 360 and 720 imposter data, respectively. Thus, four types of speaker models are developed for each speaker. During testing, each type of speaker model from each speaker is tested on 40 client data and 1440 (40x36) imposter data from the other 36 persons.
V. MULTIBIOMETRIC SYSTEM VERIFICATION A. Development of SVM audio reliability indicator
Speech quality measurement is done by developing an indicator system which is based on SVM classification technique. By modeling the clean data features as sample type +1 and the noisy data features as sample type -1, the system is able to discriminate the incoming speech signal either as high quality or low quality speech signal. Modeling data are taken from the training data set (enrollment).
The indicator system is constructed to differentiate clean speech signal (high quality) from 30dB, 20dB and 10dB SNR speech signal (low quality). We have used 2960 training data and 5920 testing data for this task. This system is capable to achieve 99.66% accuracy.
B. Verification of the multibiometric systems
In fixed weighting approach, the weight to be used for the fusion system is estimated by first running the audio system and visual system separately using the enrollment data. The fusion system is a soft fusion system that uses raw scores from audio and visual subsystems. The scores from each system are then normalized by using min-max normalization technique. In this case, the minimum and maximum scores are transformed to 0 and 1, respectively. The normalized values are then combined by using a weighted summation fusion as shown by the equation below.
(
w)
Vlip wAspeechF= 1− + (15)
where is the score from visual subsystem, is the score from audio subsystem,
lip
V Aspeech
Fis total weighted fusion score and W is a weighting factor which varied between 0 and 1.
In order to calculate the optimum weight, , is varied from 0 to 1 in steps of 0.1. The overall performance in
opt
each step is then evaluated and the optimum weight, is defined at which the weight, give the highest performance. We observed that the error curve performances hit the lowest point at weight equal to 0.4.
opt w
w
For the adaptive weighting approach, each audio testing data (current speech signal) is first checked for its quality by the audio reliability indicator system. After the speech quality measurement process is completed, the system will decide the weight for the fusion process. If the indicator system determines the current speaker’s speech signal as clean speech signal, the optimum weight is employed for the fusion system otherwise the visual only system is executed. This approach is summarized as illustrated in Fig. 4.
Fig. 4 The architecture of the fusion system using adaptive weighting approach
VI. RESULTS AND DISCUSSIONS
Fig. 5 shows the performances of the visual only system based on 20 training data, 10 training data, 6 training data and 3 training data. By increasing the numbers of training data to the system, a great improvement in the GAR is observed. At FAR of 0.1%, the GAR of the 3 training data system is 85%. By using 6 and 10 training data, the percentage of GAR increases to 96%. Subsequently, the system reaches to 98% GAR when 20 training data are used. Almost 100% GAR is found for 3, 6, 10 and 20 training data systems when the FAR is equal to 35%, 4%, 3% and 0.2%, respectively. The system performances based on EER are shown in Table 1.
10-2 10-1 100 101 102 40
50 60 70 80 90 100
False Acceptance Rate(%)
G
e
nu
in
e A
c
c
e
pt
a
nc
e R
at
e
(%
)
PCA-SVM system performance using different number of training data
20 data 10 data 6 data 3 data
Fig. 5 ROC curve for visual only system using different numbers of training data
Table I EER performances for visual only system using different numbers of training data
No of training data 20 10 6 3
EER 0.27 0.94 1.15 2.7
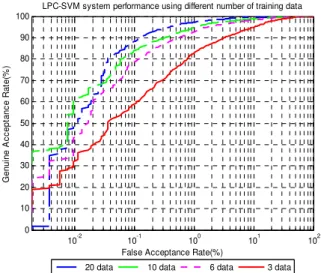
The audio only system based on 20 training data, 10 training data, 6 training data and 3 training data are showed in Fig. 6. The increment of the numbers of training data increases the performance of GAR. At FAR of 1%, the GAR of the 3, 6, 10 and 20 training data systems are 83%, 93%, 94% and 96%, respectively. This study observes that the performance of 20 training data system is capable to accomplish almost 100% GAR at FAR of 7% compared to FAR of 20%, 25% and 50% for the 10, 6 and 3 training data systems, respectively. The system performances based on EER are shown in Table 2.
10-2 10-1 100 101 102 0
10 20 30 40 50 60 70 80 90 100
False Acceptance Rate(%)
G
enui
n
e
A
c
c
ept
a
n
c
e
Ra
te
(%
)
LPC-SVM system performance using different number of training data
20 data 10 data 6 data 3 data
Fig. 6 ROC curve for audio only system using different numbers of training data
Table 2 EER performances for audio only system using different numbers of training data
No of training data 20 10 6 3
EER 1.79 2.7 3.5 6.6
10-2 10-1 100 101 102 0
10 20 30 40 50 60 70 80 90 100
False Acceptance Rate(%)
G
e
nu
in
e A
c
c
e
pt
a
nc
e R
at
e
(%
)
LPC-SVM system performance at different level of SNR
clean 30dB 20dB 10dB
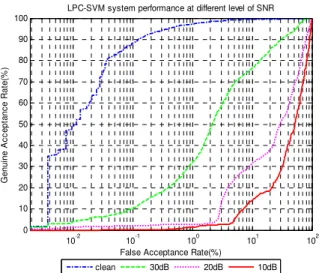
Fig. 7 ROC curve for audio only systems at different levels of SNR
Table 3 EER performances for audio only systems at different levels of SNR
SNR level clean 30dB 20dB 10dB
EER 1.79 17.01 40.74 51.13
Performances of the multibiometric system using fixed weighting approach has been experimented in clean, 30db SNR, 20dB SNR and 10dB SNR conditions. For the fixed weighting system, the optimum weight is calculated at
as shown in Fig. 8. 4
. 0 = w
Consequently, the performances of the multibiometric system using fixed weighting based on clean, 30dB SNR, 20dB SNR and 10dB SNR data are given in Fig. 9. For the clean data system, the 100% GAR at FAR of 0.004% is evaluated. The 30dB system performance decreases gradually to 82% GAR while the 20dB and 10dB SNR systems drop sharply to 38% and 32% at the same FAR percentage. The 30dB, 20dB and 10dB SNR systems reach 100% GAR at FAR is equal to 3%, 30% and 40%, respectively. The performances based on EER are shown in Table 4.
0 0.1 0.2 0.3 0.4 0.5 0.6 0.7 0.8 0.9 1 0
10 20 30 40 50 60
LPC-PCA-SVM system performance at different fusion weights
weight
N
um
ber
of
er
ror
Fig. 8 Fusion system performances at different fusion weights
10-2 10-1 100 101 102 30
40 50 60 70 80 90 100
False Acceptance Rate(%)
G
e
nu
in
e A
c
c
e
pt
a
nc
e R
at
e
(%
)
LPC-PCA-SVM system performance at different level of SNR
clean 30dB 20dB 10dB
Fig. 9 ROC curve for multibiometric system using fixed weighting at different levels of SNR
Table 4 EER performances for multibiometric systems using fixed weighting at different levels of SNR SNR level clean 30dB 20dB 10dB
EER 0.07 0.87 6.0 9.29
Subsequently, Fig 10 illustrates the performance of the multibiometric system using adaptive weighting in clean condition. Performances of the multibiometric system using fixed weighting and audio only system in clean condition are also illustrated for comparison. The 100% GAR performance is evaluated at FAR is equal to 0.004% for the adaptive weighting and fixed weighting system compared to 35% GAR performance for the audio only system at the same percentage of FAR. On the other hand, it is observed that the audio only system reaches nearly 100% GAR at FAR of 7%. System performances based on EER are observed as 0.067%, 0.067% and 1.79% for adaptive weighting system, fixed weighting system and audio only system, respectively.
10-2 10-1 100 101 102 0
10 20 30 40 50 60 70 80 90 100
False Acceptance Rate(%)
G
e
nu
in
e A
c
c
e
pt
a
nc
e R
at
e
(%
)
LPC-PCA-SVM system performance in clean condition
adaptive weighting fixed weighting audio only
Fig. 10 ROC curve comparison of system performances in clean condition
weighting and audio only system are also illustrated for comparison. 100% GAR performance is evaluated for the adaptive weighting system at FAR equal to 0.3% compared to FAR equal to 1% for fixed weighting system. The GAR performance at the FAR equal to 0.3% for fixed weighting system is 96% meanwhile GAR performance for the audio only system is 18% at the same FAR percentage. System performances based on EER are observed as 0.29%, 0.87% and 17.02% for adaptive weighting system, fixed weighting system and audio only system, respectively.
10-2 10-1 100 101 102 0
10 20 30 40 50 60 70 80 90 100
False Acceptance Rate(%)
G
e
nu
in
e A
c
c
e
pt
a
nc
e R
at
e
(%
)
LPC-PCA-SVM system performance at 30dB SNR level
adaptive weighting fixed weighting audio only
Fig. 11 ROC curve comparison of system performances at 30dB SNR level
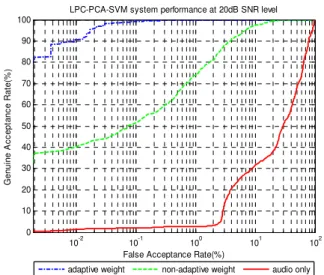
Fig. 12 illustrates the performance of the multibiometric system using adaptive weighting based on 20dB SNR data. Performances of the multibiometric system using fixed weighting and audio only system are also illustrated for comparison. The 100% GAR is evaluated at FAR is equal to 0.3% for the adaptive weighting system compared to 60% GAR for fixed weighting system at the same FAR percentage. In contrast, the fixed weighting system reaches to 100% GAR at FAR equal to 11%. At the FAR 0.3%, the audio only system simply attains 4% GAR. System performances based on EER are observed as 0.27%, 6% and 40.75% for adaptive weighting system, fixed weighting system and audio only system, respectively.
10-2 10-1 100 101 102 0
10 20 30 40 50 60 70 80 90 100
False Acceptance Rate(%)
G
en
ui
n
e A
c
c
ept
a
nc
e
R
at
e(
%
)
LPC-PCA-SVM system performance at 20dB SNR level
adaptive weight non-adaptive weight audio only
Fig. 12 ROC curve comparison of system performances at 20dB SNR level
The performance of the multibiometric system using adaptive weighting based on 10dB SNR data are given in Fig. 13. Performances of the multibiometric system using fixed weighting and audio only system are also illustrated for comparison. The 100% GAR performance for adaptive weighting system is evaluated at FAR equal to 0.3% while for fixed weighting system is found at FAR of 35%. In contrast, the performance at FAR of 0.3% for fixed weighting system is 48% GAR meanwhile GAR performance for audio only system is evaluated as 0% at the same FAR percentage. System performances based on EER are observed as 0.27%, 9.3% and 51.14% for adaptive weighting system, fixed weighting system and audio only system, respectively.
10-2 10-1 100 101 102 0
10 20 30 40 50 60 70 80 90 100
False Acceptance Rate(%)
G
e
nu
in
e A
c
c
e
pt
a
nc
e R
at
e
(%
)
LPC-PCA-SVM system performance at 10dB SNR level
adaptive weighting fixed weighting audio only
Fig. 13 ROC curve comparison of system performances at 10dB SNR level
VII. CONCLUSIONS
approach is imperative to be implemented for uncertain audio condition. The advantage of using the adaptive weighting approach instead of employing fixed weighting approach is to avoid unreliable scores to be fused together in fusion systems that can spoil the accuracy of the total scores. By using the adaptive weighting approach, the performances of the verification systems can be further enhanced when high quality speech signal is obtained. Besides, in corrupted speech signal environment, the system performances can still be maintained by adjusting the fusion weight by using the visual only systems. However, the effectiveness of this approach depends on the performance of the indicator system as audio reliability estimation and visual only verification system. Future work will be devoted on all SNR levels and different types of noises. Degradation of the visual features will also be emphasized by considering advanced fusion scheme and noise eradication.
REFERENCES
[1] J.P. Campbell, “Speaker Recognition: A Tutorial,” Proceeding of the IEEE 85, 1997, pp.1437-1462.
[2] D.A. Reynolds, “An overview of Automatic Speaker Recognition Technology,” Proceeding of IEEE on Acoustics Speech and Signal Processing 4, 2002, pp. 4072-4075.
[3] D.A. Ramli, S.A. Samad, S.A and A. Hussain, “Score Information Decision Fusion using Support Vector Machine for a Correlation Filter Based Speaker Authentication System,” Lecture Notes in Computer Science (Artificial Intelligent Series), Publisher Springer-Verlag Berlin Heidelberg, 2008, Vol 53, pp.235-242.
[4] R. Brunelli, D. Falavigna, L. Stringa and T. Poggio, “Automatic Person Recognition by Using Acoustic and Geometric,” Machine Vision & Applications 8, 1995, pp. 317-325.
[5] R. Brunelli and D. Falavigna, “Personal Identification using Multiple Cue,” IEEE Trans. on Pattern Analysis and Machine Intelligence, vol. 17, no. 3, 1995, pp. 955–966.
[6] U. Dieckmann, P. Plankensteiner and T. Wagner, “SESAM: A Biometric Person Identification System using Sensor,” Pattern Recognition Letters, 1997, pp. 827–833.
[7] P. Jourlin, J. Luettin, D. Genoud and H. Wassner, “Integrating Acoustic and Labial Information for Speaker Identification and Verification,” Proceeeding 5th European Conference Speech Communication and Technology, vol. 3, 1997, pp. 1603–1606.
[8] C. Sanderson and K.K. Paliwal, “Multi-Modal Person Verification System Based on Face Profile and Speech,”Fifth International Symposium on Signal Processing and its Applications, 1999, pp. 947-950.
[9] H. Pan, Z.P. Liang and T.S. Huang, “Fusing Audio and Visual Features of Speech,” Proceeding of IEEE International Conference on Image Processing, 2000, vol 3, pp. 214-217.
[10] S.M. Chu, V.L.E. Marcheret, C. Neti and G. Potamianos, “Multistage Information Fusion for Audio-Visual Speech Recognition,” Proceeding of IEEE International Conference on Multimedia and Expo, 2004, pp. 1651-1654.
[11] M. Gurban and J.P. Thiran, “Using entropy as a stream reliability estimate for audio-visual speech,” 16th European Signal Processing Conference, 2008, to be published.
[12] G. Potamianos and C. Neti, “Stream Confidence Estimation for Audio-Visual Speech,” Procceding of the International Conference on Spoken Language, vol III, 2000, pp. 746-749.
[13] M. Heckmann, F. Berthommier and K. Kroschel, “Noise Adaptive Stream Weighting in Audio-Visual Speech, EURASIP Journal on Applied Signal Processing, 2002, pp. 1260-1273.
[14] G. Chetty and M. Wagner, “Robust Face-Voice Based Speaker Verification using Multilevel,” Image and Vision Computing, vol. 26, issue 9, 2008, pp. 1249-1260.
[15] T. Wark and S. Sridharan, “A Syntactic Approach to Automatic Lip Feature Extraction for Speaker Identification,” IEEE International Conference on Acoustics Speech and Signal Processing 6, 1998, pp. 3693-3696.
[16] C.C. Broun, X. Zhang, R.M. Mersereau and M. Clements, “Automatic Speechreading with Application to Speaker Verification,” IEEE International Conference on Acoustics Speech and Signal Processing1, 2002, pp. 685-688.
[17] N.A. Fox and R.B. Reilly, “Robust Multi-Modal Person Identification with tolerance of Facial expression,” Proceeding of IEEE International Conference on System, Man and Cybernetics, 2004, pp.580-585. [18] C. Sanderson and K.K. Paliwal, “Noise Compensation in a
Multi-Modal Verification System,” Proceeding of International Conference on Acoustics, Speech and Signal Processing, 2001, pp. 157-160.
[19] S.R. Gunn, “Support Vector Machine for Classification and Regression,” Technical Report, University of Southampton, 2005. [20] V. Wan and W.M. Campbell, “Support Vector Machines for Speaker
Verification and Identification,” Proceeding of Neural Networks for Signal Processing, 2000, pp. 775-784.
[21] L. R. Rabiner and B.H. Juang, “Fundamental of Speech Recognition Liveness Verification in Audio-Video Speaker Authentication,” in
Prentice-Hall International, United State: Prentice-Hall International, 1993.
[22] S. Furui, “Cepstral Analysis Technique for Automatic Speaker Verification,” IEEE Transaction Acoustic Speech Signal Processing, vol. 29, no. 2, 1981, pp. 254-272.
[23] G. Chetty and M. Wagner, “Liveness Verification in Audio-Video Speaker Authentication,” Proceeding of International Conference on Spoken Language Processing ICSLP 04, 2004, pp. 2509-2512. [24] G. Chetty and M. Wagner, “Automated Lip Feature Extraction for
Liveness Verification in Audio-Video Authentication,” Proceeding of Image and Vision Computing, 2004, pp. 17-22.
[25] I. Matthews, J. Cootes, J. Bangham, S. Cox and R. Harvey, “Extraction of Visual Features for Lipreading,” IEEE Trans. on Pattern Analysis and Machine Intelligence, vol. 24, no. 2, 2002, pp. 198–213.