AR
TIGO ORIGINAL / ORIGINAL AR
TICLE
INVESTIGATION OF NUTRITIONAL
RISK FACTORS USING
ANTHROPOMETRIC INDICATORS IN
HOSPITALIZED SURGERY PATIENTS
Vânia Aparecida
LEANDRO-MERHI
1and José Luiz Braga de
AQUINO
2ABSTRACT – Context- The investigation of risk factors associated with nutritional status could contribute for better knowledge of the malnutrition. Objective - To investigate the incidence of malnutrition and its possible association with many parameters that assess nutritional status and to identify the associated risk factors. Methods - The nutritional status was assessed in 235 hospitalized patients. Malnutrition was deined as present when the patient presented at least two anthropometric criteria below the normal range and habitual energy intake below 75% of the energy requirement (HEI/ER<75%). Gender, age, type of disease, recent weight change and dental problems were investigated as possible associated risk factors. The chi-square and Mann-Whitney tests were used to compare the data and univariate and multiple logistic regressions were used to identify the factors associated with malnutrition. The odds ratio (OR) and conidence interval (CI) of 95% were calculated with the signiicance level set at 5% (P<0.05). Results – One-ifth (20%) of the patients were malnourished on admission to the hospital and 27.5% reported recent weight loss. Malnutrition (P<0.0001) was greater in patients with malignant diseases. The only variables signiicantly associated with malnutrition according to univariate logistic regression were recent weight loss (P = 0.0058; OR = 2.909; IC95% = 1.362; 6.212) and malignant disease (P = 0.0001; OR = 3.847; IC95% = 1.948; 7.597). When multiple regression was used in the model which included type of disease, malignant disease was shown to increase the chance of malnutrition fourfold (P = 0.0002; OR = 3.855; IC95% = 1.914; 7.766). When disease was excluded, recent weight loss also increased malnutrition fourfold (P = 0.0012; OR = 3.716; IC95% = 1.677; 8.236). Conclusion - Patients with a history of recent weight loss and those with malignant diseases are more susceptible to malnutrition.
HEADINGS – Nutritional status. Malnutrition. Postoperative period. Anthropometry. Risk factors. Inpatients.
The authors declare that they have no competing interests.
Vania Aparecida Leandro Merhi and José Luiz Braga de Aquino were involved in the protocol and study design, analysis, carried out the statistical analysis, writing of the article and critically reviewed the article.
Pontifícia Universidade Católica de Campinas (PUC-Campinas), Campinas, SP, Brasil.
1 Escola de Nutrição, PUC-Campinas; 2 Escola de Medicina, PUC-Campinas, Campinas, SP, Brasil;
Correspondence: Dr. Vânia A. Leandro-Merhi. E-mail: [email protected]
INTRODUCTION
Malnutrition in hospitalized patients is still considered highly prevalent in most hospitals, with hospital malnutrition rates ranging from 15% to 60%(1, 11, 18, 35, 39) depending on the
type of hospital, region, studied population and methods routinely used to investigate nutritional status(2, 3, 11, 28, 32).
These data have been used in an attempt to establish diagnostic and nutritional intervention strategies that reduce the impact of poor nutritional status and its implications on the disease, morbidity, mortality, length of hospital stay and, especially, to reverse the high hospital malnutrition rates(1, 11, 35, 39).
The investigation of risk factors associated with nutritional status right after admission could contribute for better knowledge and identiication of this situation, allowing better control of strategies for the primary
prevention of this condition. Generally, the diagnosis of malnutrition is based on objective measurements of nutritional status, which may include assessment of energy intake, weight loss, anthropometric data, biochemical data and body composition(2, 11, 28, 39).
Many methods have been developed and used for the assessment and diagnosis of hospital malnutrition, such as anthropometric measurements, biochemical tests, subjective global assessment (SGA), nutritional risk index (NRI), nutritional risk screening (NRS), and a combination of these. However, literature diverges on what is considered the gold standard among these various methods. Some studies indicate that the SGA has greater sensitivity for identifying patients at nutritional risk(9), others suggest the use of the NRS(17, 19) or the
NRI(27, 37) to relect the risk of malnutrition regardless of
biochemical and anthropometric markers are good predictors of nutritional status in hospitalized patients(3, 29, 39).
The objective of the present study was to investigate the incidence of malnutrition at admission and its possible association with many parameters that assess nutritional status and to identify the associated risk factors in hospitalized patient.
METHODS
This study was done from January to December 2010 and included 235 hospitalized patients of both genders (46.4% females and 53.6% males), staying at the surgery ward of Hospital e Maternidade Celso Pierro of the Pontiical Catholic University of Campinas, state of São Paulo, Brazil. This is a tertiary-care university hospital that, in its routine, includes cases of high risk such as politrauma and complex cancer surgeries.
The study began after approval from the hospital administration and local Research Ethics Committee, protocol number 743/09. This study is part of a bigger project called “Nutritional status of the hospitalized patient and its relationship with disease, clinical and surgical variables and length of hospital stay.”
The inclusion criteria were: age equal to or greater than 18 years, having undergone nutritional assessment within the irst 48 hours after hospital admission, length of hospital stay and disease recorded in the medical records of the institution.
Anthropometric indicators
The following anthropometric indicators were measured: current weight; height; arm circumference; triceps skinfold thickness (TST) and calf circumference (CC). From these measurements the body mass index (BMI), mid-arm muscle circumference (MAMC), arm muscle area (AMA), and arm fat area (AFA) were calculated. AC and AFA were classiied according to the parameters established by Frisancho(13) and
MAMC and AMA were classiied according to Frisancho(12).
The TST were assessed as determined by Heymsield et al.(15).
The anthropometric parameters established by Burr and Phillips(5) were used for the elderly.
BMI was obtained by dividing weight by the square of the height and classified according to the WHO’s criteria(40) for adults up to 60 years of age: underweight if
BMI ≤18.4 kg/m2; normal weight if 18.5 ≤BMI ≤24.9 kg/
m2; pre-obese if 25.0 ≤BMI ≤29.9 kg/m2 and obese if BMI
≥30.0 kg/m2. For the elderly (≥60 years of age), BMI was
classified as determined by Lipschitz(24), who gives the
following cut-off points: underweight if BMI ≤22 kg/m2;
normal weight if 22 <BMI <27 kg/m2; and overweight
if BMI ≥27 kg/m2.
Recent weight change was classiied as weight maintenance for patients who reported not losing or gaining weight before admission, weight loss for those who reported losing weight shortly before admission and weight gain for those who reported gaining weight shortly before admission. The average weight loss was declared by the patients.
Investigation of the habitual energy intake (HEI) The habitual energy intake (HEI) was assessed based on the habitual food intake when the patient was admitted and was calculated by the software NutWin®(38), as previously
described in previous papers(8, 20, 22, 30). The energy adequacy of
the habitual energy intake in relation to the energy requirement (ER) was then calculated (%HEI/ER). The ER represents the total energy expenditure of the individual and was calculated by the Harris-Benedict equation(14).
Assessment of malnutrition
Malnutrition was assessed after the nutritional status with the objective parameters described above. In this study, the criterion to malnutrition was proposed based on anthropometric nutritional status parameters. Malnutrition was deined as present when the patient presented at least two anthropometric criteria below the normal range and habitual energy intake below 75% of the energy requirement (HEI/ER<75%)(26). The
anthropometric criteria were: BMI <18.5 kg/m2 for adults
and <22 kg/m2 for the elderly and AC, TST, MAMC, AMA
or AFA below the 10th percentile (<P10).
Assessment of the risk factors associated with malnutrition
Gender, age, type of disease, recent weight change, presence or absence of dental problems, number of drugs prescribed during hospital stay and length of hospital stay were investigated as possible risk factors to malnutrition. The diseases were classiied into two categories: benign diseases and malignant diseases (neoplasms). We considered patients with malignant diseases those who had carcinoma in general, and patients with benign diseases those who had other clinical conditions such as the digestive tract diseases and annexed glands, vascular diseases, urological diseases and others.
Statistical analysis
At irst, a descriptive analysis of the data was done by determining the mean, standard deviation and proportion of the studied variables. The chi-square test or Fisher’s exact test, when necessary, were used to compare the proportions. The Mann-Whitney test was used to compare the continuous or ordinal measurements between two groups. Univariate and multiple logistic regressions were used to identify the factors associated with malnutrition. The odds ratio (OR) and conidence interval (CI) of 95% were calculated(6, 16) and the signiicance
level was set at 5% (P<0.05). The data were analyzed by the software Statistical Analysis System (SAS)(34).
RESULTS
admission, 24.9% reported gaining weight and 47.6% reported no weight change in the few months before admission (6 months). The average weight lost before admission was 9.45 ± 5.95 kg and the mean weight gained was 6.45 ± 5.0 kg.
The mean age of the entire sample was 53.0 ± 17.9 years; the mean BMI was 25.0 ± 5.4 kg/m2; mean CC was 32.2 ± 4.4 cm;
mean AC was 28.5 ± 4.5 cm; mean TST was 17.9 ± 9.2 mm; mean MAMC was 228.6 ± 36.0 mm; mean AMA was 42.6 ± 13.1 cm2;
mean AFA was 23.6 ± 13.9 cm2; and mean length of hospital
stay was 7.7 ± 9.4 days. Note that 20% of the patients were already at malnutrition at admission and 45% of the patients had a HEI below 75% of their requirement.
Figure 1 shows the percentage distribution of the criteria used for the deinition of malnutrition in each disease group and also of the assessed malnutrition by type of disease. A signiicant difference was found between the groups for the following criteria: BMI (P<0.0001); AC (P = 0.0020); MAMC (P = 0.0090); AMA (P = 0.0003) and mainly for malnutrition (P<0.0001), evidencing that malnutrition was greater in patients with malignant diseases.
When the characteristics of the population were compared by type of disease (Table 1), a statistically signiicant difference was found between the two types of disease regarding gender (P = 0.0014), age group (P = 0.0004), recent weight change (P = 0.0005) and death (P = 0.0319). When the numerical variables were compared between the two types of diseases (Table 2), a signiicant difference was found for nearly all studied indicators, except for calf circumference CC, HEI and %HEI/ER.
Univariate and multiple logistic regressions were then used to analyze the risk factors associated with malnutrition. Table 3 shows the factors associated with malnutrition analyzed using a univariate logistic regression model. The model evidenced that the only signiicant variables for malnutrition were recent weight loss (P = 0.0058; OR = 2.909; CI95% = 1.362; 6.212) and malignant disease (P = 0.0001; OR = 3.847; CI95% = 1.948; 7.597). Additional data are shown in Table 3.
Types of disease
Variables Benign disease
n (%)
Malignant disease
n (%) P-value
Gender
0.0014*
female 93 (52.3) 16 (28.1)
male 85 (47.7) 41 (71.9)
Age group (years)
18-59 119 (66.8) 22 (38.6)
0.0004*
60-69 33 (18.5) 16 (28.1)
≥70 26 (14.6) 19 (33.3)
Dental problems
yes 84 (47.2) 35 (61.4)
0.0618*
no 94 (52.8) 22 (38.6)
Recent weight change
weight gain 44 (24.9) 14 (25.0)
0.0005*
weight loss 38 (21.5) 26 (46.4)
no change in weight 95 (53.7) 16 (28.6)
Death
yes 2 (1.1%) 4 (7.0%)
0.0319 **
no 176 (98.9%) 53 (93%)
TABLE 1. Comparison of the characteristics of the population by type of disease
*Chi-square test; **Fisher’s exact test
FIGURE 1. Percentage distribution of the criteria used to deine malnutrition and of the risk assessed in each disease group. There was a signiicant difference between the groups for the criteria: (a) P-value<0.0001 (chi-square); (b) P-value = 0.0020 (chi-square); (c) P-value = 0.0090 (chi-square); (d) P-value = 0.0003 (chi-square) and for assessed malnutrition (e) P-value<0.0001 (chi-square)
0 5 10 15 20 25 30 35 40 45 50 55
(e) (d)
(c) (b)
(a)
Malnutrition HEI/ER
<75% AFA <P10 AMA <P10 MAMC
<P10 TST <P10 AC <P10
BMI <18.5 adults <22.0 elderly
Benign disease Malignant disease
%
Criteria
Indicators n X ± SD Median P-value
Age (years)
benign disease 178 50.2 ± 18.0 52.5
<0.0001
malignant disease 57 61.9 ± 14.7 64.0
Length of hospital stay (days)
benign disease 178 7.4 ± 9.9 4.0
0.0053
malignant disease 57 8.6 ± 7.1 7.0
Current weight (kg)
benign disease 171 69.1 ± 14.4 68.0
0.0043
malignant disease 56 62.0 ± 15.0 59.9
Body mass index (kg/m2)
benign disease 171 25.6 ± 5.2 24.9
0.0015
malignant disease 56 23.4 ± 5.7 22.8
Calf circumference (cm)
benign disease 153 32.4 ± 4.4 32.0
NS
malignant disease 53 31.5 ± 4.6 31.0
Arm circumference (cm)
benign disease 178 29.1 ± 4.3 29.0
<0.0001
malignant disease 57 26.7 ± 4.5 26.0
Triceps skinfold thickness (mm)
benign disease 178 18.8 ± 9.1 17.0
0.0039
malignant disease 57 15.3 ± 9.0 14.0
Mid-arm muscle circumference (mm)
benign disease 178 231.9 ± 35.0 232.1
0.0092
malignant disease 57 218.0 ± 37.3 215.4
Arm muscle area (cm2)
benign disease 178 43.8 ± 12.9 42.9
0.0092
malignant disease 57 38.9 ± 12.9 36.7
Arm fat area (cm2)
benign disease 178 25.0 ± 13.9 21.7
0.0005
malignant disease 57 19.9 ± 12.9 15.9
HEI/ER<75%
benign disease 178 87.4 ± 36.9 81.1
NS
malignant disease 57 77.3 ± 32.8 74.5
Number of drugs taken during stay
benign disease 142 6.0 ± 3.4 5.0
0.0132
malignant disease 48 7.5 ± 3.9 7.0
TABLE 2. Comparison of the studied nutritional indicators by type of disease
* Mann-Whitney test
Variables P-value Odds ratio Conidence interval (95%)
Gender M x F 0.1189 1.691 0.874; 3.272
Age group 60-69 x 18-59years 0.7621 1.134 0.501; 2.562
Age group ≥70 x 18-59 years 0.3811 1.431 0.642; 3.192
Recent weight change: gain x not 0.2298 1.670 0.723; 3.854
Recent weight change: loss x not 0.0058 2.909 1.362; 6.212
Dental problems: yes x no 0.1727 1.571 0.821; 3.006
Disease: malignant and benign 0.0001 3.847 1.948; 7.597
Age 0.3988 1.008 0.990; 1.026
Amount of weight lost or gained 0.1161 1.040 0.990; 1.091
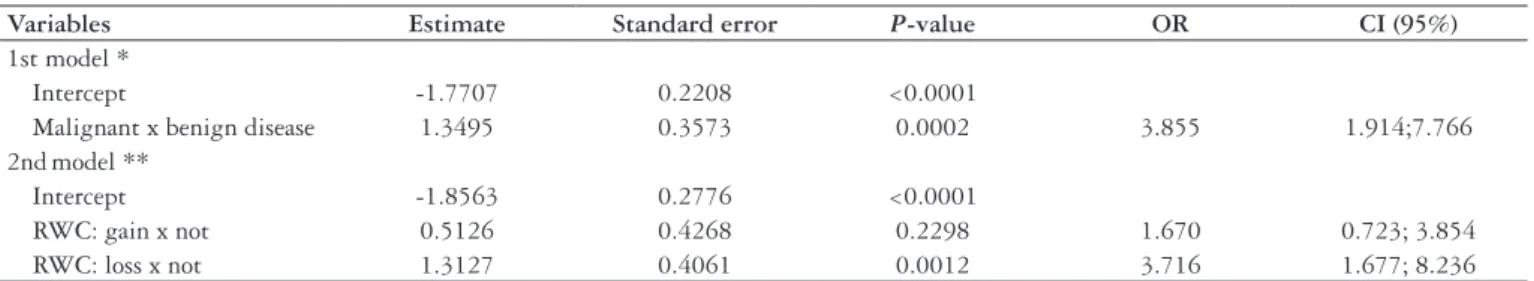
In an attempt to identify the best model for malnutrition analysis (Table 4), a multiple logistic regression analysis was done for studying malnutrition estimated by the stepwise selection process, with or without type of disease. In the model with type of disease, the presence of malignant disease increased the chance of malnutrition fourfold (P = 0.0002; OR = 3.855; CI95% = 1.914; 7.766). When type of disease was left out, recent weight loss also increased malnutrition almost fourfold (P = 0.0012; OR = 3.716; CI95% = 1.677; 8.236).
DISCUSSION
First of all, it is important to point out that the present study is part of an area of research that has been conducted about the nutritional status of hospitalized patients as shown in previous works(21, 22, 25).
Despite the existence of many published studies(1, 11, 18, 29, 39) discussing the nutritional status of hospitalized patients,
the strength of this study was to use univariate and multiple logistic regression analyses to investigate which factors were associated with risk.
In this study, 20% of the patients presented malnutrition and this diagnosis was done shortly after admission to the hospital, as well as the investigation of the other nutritional indicators, which may suggest that these patients were already at nutritional risk at admission and the indings of the study are consistent with many published studies(11, 29, 39). In a recent study,
Filipovic et al.(11), compared nutritional assessment methods
in 299 patients with gastrointestinal diseases and found some degree of malnutrition in 45.7% of their sample when they used the SGA and 63.9% when they used the NRI. In another multicentric study, Amaral et al.(1) found 36% of their sample
to be at risk of malnutrition when the NRS was used and 9.7% to be malnourished when anthropometry was used. Other studies in European hospitals have shown a prevalence of malnutrition ranging from 10% to 50%, depending on the group of studied patients(33). In a British study, Stratton et al.(36) reported that
the prevalence of malnutrition in hospitalized patients ranged from 19% to 60%, and a study in German hospitals revealed a malnutrition rate of 27.4% according to the SGA(29). Recently,
a study with hospitalized patients in Turkey(18) found 15% of the
patients to be at nutritional risk. Other studies(21, 22) carried out in
Brazil, with hospitalized surgery patients using anthropometrical
indicators to assess the nutritional status, showed malnutrition rates between 11.4% and 14.1%. These indings corroborate the data found in this present study. Another study(26), also conducted
in Brazil but with medical clinic inpatients, found that 45.3% of the patients were underweight according to their BMI.
Other contemporary studies have also reported prevalence of 30% to 50%(23, 35). This evidences the different malnutrition
rates found by different studies, using different instruments. This situation implies on the need to use many nutritional assessment parameters in an attempt to diagnose hospital malnutrition. This fact was considered in the present study which used more than one indicator to investigate malnutrition with objective parameters and associated factors. Other studies(10, 21, 22, 25, 39) also show malnutrition
with objective parameters of nutritional assessment in hospitalized patients. This fact reinforces the importance of submitting the patient to nutritional assessment right after admission in order to implement intervention strategies early to improve the nutritional status of the patient, improve his or her clinical course and reduce the length of hospital stay(7). However, a study which compared the accuracy of
commonly used nutritional assessment parameters found that the adopted methods were considered weak predictive factors of clinical outcomes, death, infection and length of hospital stay(3).
The data found in the present study show that when nutritional indicators are compared by type of disease (Table 2) depletion is greater in those with malignant diseases, except for CC and HEI/ER <75%. Habitual food intake is a weak tool to evaluate energy intake to compare with energy needs and this was a limitation of this study. For the same sample, other factors were higher age (P = 0.0004), recent weight loss (P = 0.0005) and death (P = 0.0319) (Table 1), in addition to greater malnutrition (P<0.0001) (Figure 1) found in those with malignant diseases.
With speciic regard to inpatients of a surgery ward, many studies have already documented malnutrition that these patients present in the postoperative period when they had a poor nutritional prognosis in the preoperative period, especially patients who had lost weight shortly before surgery. Literature has shown that malnutrition in this population is a signiicant risk factor for postoperative complications, especially after abdominal surgeries(4, 10, 18, 31).
Variables Estimate Standard error P-value OR CI (95%)
1st model *
Intercept -1.7707 0.2208 <0.0001
Malignant x benign disease 1.3495 0.3573 0.0002 3.855 1.914;7.766 2ndmodel **
Intercept -1.8563 0.2776 <0.0001
RWC: gain x not 0.5126 0.4268 0.2298 1.670 0.723; 3.854
RWC: loss x not 1.3127 0.4061 0.0012 3.716 1.677; 8.236
TABLE 4. Multiple logistic regression model for the study of malnutrition estimated by the stepwise selection process with and without the type of disease
The present study also found that 46.4% of the patients with malignant diseases and 21.5% of those with benign diseases lost weight during their hospital stay. This is a worrisome fact since literature states that isolated weight loss or weight loss in combination with other assessment parameters has been considered the main indicator of poor nutritional status(4).
Univariate analysis revealed that weight change and presence of malignant disease are signiicant factors for malnutrition. Multiple regression analysis then revealed that the risk was greater in patients who had lost weight recently (P = 0.0012; OR = 3.716; CI95% = 1.677; 8.236) or had malignant diseases (P = 0.0002; OR = 3.855; CI95% = 1.914; 7.766): they were almost 4 times more likely to present malnutrition.
This was a study on anthropometric nutritional status indicators of hospitalized patients. The results showed that malignant disease is a determinant in the depletion of body tissues, regardless of gender and age. This conirms the pertinence of using anthropometry for assessing the
nutritional status of hospitalized patients and this study reinforces the need of paying attention to patients who report weight loss at admission. This is often ignored by the medical and health professional teams during initial assessment. Using univariate and multiple logistic regressions, this study has shown that recent weight loss is the main factor, together with malignant disease, that facilitates the development of malnutrition.
CONCLUSION
In the conditions of this study, the analyzed data demonstrated that the main factors associated with malnutrition were recent weight loss and malignant disease.
ACKNOWLEDGMENTS
Research Support Fund of the Pontifícia Universidade Católica de Campinas, SP, Brazil.
Leandro-Merhi VA, Aquino JLB. Investigação de fatores de risco nutricional por meio de indicadores antropométricos em pacientes cirúrgicos hospitalizados. Arq Gastroenterol. 2012;49(1):28-34.
RESUMO – Contexto - A investigação de fatores de risco associados ao estado nutricional pode contribuir para o melhor conhecimento da desnutrição.
Objetivo - Investigar a incidência de risco nutricional com a associação de vários parâmetros de avaliação nutricional e identiicar os fatores de risco relacionados. Método - Foi avaliado o risco nutricional em 235 pacientes hospitalizados com doenças benignas e malignas, sendo o sexo, a faixa etária, o tipo de doença, a alteração de peso recente e os problemas dentários, investigados como possíveis fatores de risco associados. Para a comparação dos dados, foi utilizado o teste Qui ao quadrado e Mann-Whitney e para identiicar os fatores associados ao risco nutricional foi utilizada a análise de regressão logística univariada e múltipla, sendo calculado o odds ratio (OR) e o intervalo de coniança (IC) de 95%, com P<0,05. Resultados - Veriicou-se 20% dos pacientes com risco nutricional na admissão hospitalar e 27,5% referiram perda de peso recente, com diferença signiicativa entre os grupos nos parâmetros avaliados e para o risco nutricional de desnutrição (P<0,0001), maior naqueles com doenças malignas. Na regressão logística univariada, as únicas variáveis signiicativas para o risco nutricional foram a perda de peso recente (P = 0,0058; OR = 2,909; IC95% = 1,362; 6,212) e a doença maligna (P = 0,0001; OR = 3,847; IC95% =1 ,948; 7,597).Posteriormente, na regressão múltipla, no modelo com o tipo de doença, foi comprovado que a doença maligna elevou a chance de risco nutricional em 4 vezes (P = 0,0002; OR = 3,855; IC95% = 1,914; 7,766). Excluindo-se a doença, comprovou-se que a perda de peso recente elevou o risco nutricional também em quase 4 vezes (P = 0,0012; OR = 3,716; IC95% = 1,677; 8,236).
Conclusão - Pacientes que perderam peso recentemente e aqueles com doença maligna apresentaram mais chances de desenvolver risco nutricional.
DESCRITORES – Estado nutricional. Desnutrição. Período pós-operatório. Antropometria. Fatores de risco. Pacientes internados.
REFERENCES
1. Amaral TF, Matos LC, Teixeira MA, Tavares MM, Álvares L, Antunes A. Undernutrition and associated factors among hospitalized patients. Clin Nutr. 2010;29:580-5.
2. Beghetto MG, Manna B, Candal A, Mello ED, Polanczyk CA. Triagem nutricional em adultos hospitalizados. Rev Nutr. 2008;21:589-601.
3. Beghetto MG, Luft VC, Mello ED, Polanczyk CA. Accuracy of nutritional assessment tools for predicting adverse hospital outcomes. Nutr Hosp. 2009;24:56-62.
4. Bozzetti F, Gianotti L, Braga M, Di Carloc V, Mariani L. Postoperative complications in gastrointestinal cancer patients: the joint role of the nutritional status and the nutritional support. Clin Nutr. 2007;26:698–709.
5. Burr ML, Phillips KM. Anthropometric norms in the elderly. Br J Nutr. 1984;51:165-9.
6. Conover WJ. Practical nonparametric statistics. New York: John Wiley; 1971. 7. Correia MI, Waitzberg DL. The impact of malnutrition on morbidity, mortality,
length of hospital stay and costs evaluated through a multivariate model analysis. Clin Nutr. 2003;22:235-9.
8. De Oliveira MRM, Leandro-Merhi VA. Food intake and nutritional status of hospitalized older people. Int J Older People Nurs. 2010 Jun 8. doi: 10.1111/j.1748-3743.2010.00227.x
9. Detsky AS, McLaughlin JR, Baker JP, Johnston N, Whittaker S, Mendelson RA, Jeejeebhoy KN. What is subjective global assessment of nutritional status? JPEN J Parenter Enteral Nutr. 1987;11:8-13.
10. Fettes SB, Davidson HIM, Richardson RA, Pennington CR. Nutritional status of elective gastrointestinal surgery patients pre-and post-operatively. Clin Nutr. 2002;21:249-54.
11. Filipović BF, Gajić M, Milinić N, Milovanović B, Filipović BR, Cvetković M, Sibalić N. Comparison of two nutritional assessment methods in gastroenterology patients. World J Gastroenterol. 2010;16:1999-2004.
12. Frisancho AR. New norms of upper limb fat muscle areas for assessment of nutritional status. Am J Clin Nutr. 1981;34:2540-5.
13. Frisancho AR. Anthropometric standards for the assessment of growth and nutritional status. Ann Arbor: University of Michigan Press; 1990.
14. Harris J, Benedict F. A biometric study of basal metabolism in man. Washington, DC: Carnegie Institute of Washington; 1919.
15. Heymsield SB, Thighe A, Wang ZM. Nutritional assessment by anthropometric and biochemical methods. In: Shills ME, Olson JA, Shije M, editors. Modern nutrition in health and disease. 9th ed. Baltimore: Williams & Wilkins; 1999. p.812-41. 16. Hosmer DW, Lemeshow S. Applied logistic regression. New York: John
Wiley; 1989.
18. Korfali G, Gündoğdu H, Aydmtug S, Bahar M, Besler T, Moral AR, Oğuz M, Sakarya M, Uyar M, Kihçturğay S. Nutritional risk of hospitalized patients in Turkey. Clin Nutr. 2009;28:533-7.
19. Kyle UG, Kossovsky MP, Karsegard VL, Pichard C. Comparison of tools for nutritional assessment and screening at hospital admission: a population study. Clin Nutr. 2006;25:409-17.
20. Leandro-Merhi VA, Portero-Mclellan KC, Bernardi JLD, Frenhani PB, de Camargo JG, de Aquino JL. Dental and gastrointestinal changes as indicators of nutritional depletion in elderly inpatients. J Eval Clin Pract. 2010;16:873-7. 21. Leandro-Merhi VA, de Aquino JL, de Camargo JG, Frenhani PB, Bernardi
JLD, Portero-Mclellan KC. Clinical and nutritional status of surgical patients with and without malignant diseases: cross-sectional study. Arq Gastroenterol. 2011;48:58-61.
22. Leandro-Merhi VA, de Aquino JL, Sales Chagas JF. Nutrition status and risk factors associated with length of hospital stay for surgical patients. JPEN J Parenter Enteral Nutr. 2011;35:241-8.
23. Liang X, Jiang ZM, Nolan MT, Efron DT, Kondrup J. Comparative survey on nutritional risk and nutritional support between Beijing and Baltimore teaching hospitals. Nutrition. 2008;24:9696-76.
24. Lipschitz DA. Screening for nutritional status in the elderly. Prim Care. 1994;22:55-67.
25. McLellan KCP, Bernardi JLD, Jacob P, Soares CSR, Frenhani PB, Leandro-Merhi VA. Estado nutricional e composição corporal de pacientes hospitalizados: relexos da transição nutricional. Rev Bras Promoç Saúde. 2010;23:25-33.
26. Mimiran P, Hosseinpour-Niazi S, Mehrabani HH, Kavian F, Azizi F. Validity and reliability of a nutrition screening tool in hospitalized patients. Nutrition. 2010;27:647-52.
27. Naber TH, Schermer T, de Bree A, Nusteling K, Eggink L, Kruimel JW, Bakkeren J, van Heereveld H, Katan MB. Prevalence of malnutrition in nonsurgical hospitalized patients and its association with disease complications. Am J Clin Nutr. 1997;66:1232-9.
28. Pereira Borges N, D’Alegria Silva B, Cohen C, Portari Filho PE, Medeiros FJ. Comparison of the nutritional diagnosis, obtained through different methods and indicators, in patients with cancer. Nutr Hosp. 2009;24:51-5.
29. Pirlich M, Schütz T, Norman K, Gastell S, Lübke HJ, Bischoff SC, Bolder U, Frieling T, Güldenzoph H, Hahn K, Jauch KW, Schindler K, Stein J, Volkert D, Weimann A, Werner H, Wolf C, Zürcher G, Bauer P, Lochs H. The German hospital malnutrition study. Clin Nutr. 2006;25:563-72.
30. Portero-McLellan KC, Staudt C, Silva FR, Delbue Bernardi JL, Baston Frenhani P, Leandro-Merhi VA. The use of calf circumference measurement as an anthropometric tool to monitor nutritional status in elderly inpatients. J Nutr Health Aging. 2010;14:266-70.
31. Putwatana P, Reodecha P, Sirapo-ngam Y, Lertsithichai P, Sumboonnanonda. Nutrition screening tools and the prediction of postoperative infectious and wound complications: comparison of methods in presence of risk adjustment. Nutrition. 2005;21:691-7.
32. Raslan M, Gonzalez MC, Dias MCG, Paes-Barbosa FL, Cecconello I, Waitzberg DL. Aplicabilidade dos métodos de triagem nutricional no paciente hospitalizado. Rev Nutr. 2008;21:553-61.
33. Rasmussen HH, Kondrup J, Staun M, Ladefoged K, Kristensen H, Wengler A. Prevalence of patients at nutritional risk in Danish hospitals. Clin Nutr. 2004;23:1009–15.
34. SAS System for Windows (Statistical Analysis System), versão 9.2. Cary, NC, USA: SAS Institute Inc; 2002-2008.
35. Sorensen J, Kondrup J, Prokopowicz J, Schiesser M, Krähenbbühl L, Meier R, Liberda M, EuroOOPS study group. EuroOOPS: an international, multicentre study to implement nutritional risk screening and evaluate clinical outcome. Clin Nutr. 2008;27:340-9.
36. Stratton RJ, Hackston A, Longmore D, Dixon R, Price S, Stroud M, King C, Elia M. Malnutrition in hospital outpatients and inpatients: prevalence, concurrent validity and ease of use of the ‘malnutrition screening tool universal tool’ (‘MUST’) for adults. Br J Nutr. 2004;92:799-808.
37. Sungurtekin H, Sungurtekin U, Hanci V, Erdem E. Comparison of two nutrition assessment techniques in hospitalized patients. Nutrition. 2004;20:428-32. 38. Universidade Federal de São Paulo. Escola Paulista de Medicina. Programa de
Apoio a Nutrição (NUTWIN) – programa de computador, versão 1.5. São Paulo: UNIFESP/ EPM; 2002.
39. Westergren A, Wann-Hansson C, Borgdal EB, Sjolander J, Stromblad R, Klevsgard R, Axelsson C, Lindholm C, Ulander K. Malnutrition prevalence and precision in nutritional care differed in relation to hospital volume-a cross-sectional survey. Nutr J. 2009;8:20.
40. World Health Organization. Obesity: preventing and managing the global epidemic - Report of a WHO consultation on obesity. Geneva: WHO, 1998.