aids and auditory rehabilitation. Pediatric hearing healthcare programs have emphasized the impor-tance of a family centered approach, since family’s participation on the early diagnosis and intervention brings better results to children1.
In general, after a child is diagnosed with hearing
impairment, the family goes through a dificult
period, having to deal with strong feelings of inade-quacy, anger, guilt, vulnerability and confusion 2.
Besides, the need of restructuring their roles and learning new values and skills to deal with a hearing impairment may also be a potential source of stress for the family. Parents of hearing impaired children were more stressed than those of normal hearing children and such stress occurred due to different reasons in different stages of their children’s lives 3.
COMPARISON OF ELECTRONIC AND PAPER AND PENCIL
ADMINISTRATION OF THE PARENTING STRESS
INDEX - SHORT FORM (PSI-SF)
Comparação das formas de aplicação papel e caneta e eletrônica
do índice de estresse parental versão reduzida (PSI-SF)
Camila Piccini Aiello (1), Ana Pietra da Silva (2), Deborah Viviane Ferrari (3)
(1) Programa de Mestrado em Fonoaudiologia da Faculdade
de Odontologia de Bauru da Universidade de São Paulo - FOB-USP, Bauru, SP, Brazil.
(2) Faculdade de Odontologia de Bauru da Universidade de
São Paulo - FOB-USP, Bauru, SP, Brazil.
(3) Departamento de Fonoaudiologia da Faculdade de
Odon-tologia de Bauru da Universidade de São Paulo - FOB-USP, Bauru, SP, Brazil.
Study done at the Speech Language Pathology Department of Faculdade de Odontologia de Bauru da Universidade de São Paulo.
Source: RUSP - Processo nº 2011.1.3556.25.8 Conlict of interest: non-existent
ABSTRACT
Purpose: to assess whether the electronic version of the Parenting Stress Index – Short Form (PSI-SF) is comparable to the paper and pencil administration. To evaluate stress in parents of children with normal development. Methods: forty adults, parents of children between six months and ten years of age, were divided into four groups matched for age, gender, education and child’s age. In two different occasions, seven to ten days apart, participants completed the PSI-SF in the formats: paper-pencil/paper-pencil (PP), paper-pencil/electronic (PE), electronic/electronic (EE) and electronic/ paper-pencil (PE). The PSI-SF has 36 statements, divided into three subscales: Parental Distress,
Parent-Child Dysfunctional Interaction, and Dificult Child. Pearson’s correlations and comparison of
the PSI-SF scores within and between groups were obtained. Results: strong positive correlations
were found between PSI-SF subscales and total scores in the irst and second administration, for all groups. Signiicant differences were observed between the mean scores for the PP group (subscale “Dificult Child”) and EE group (subscale “Dificult Child” and the total score). Such differences in
scores, however, did not alter in any means the interpretation of the results. Participants’ stress fell into normal values, for all subscales. Conclusion: the electronic format of the PSI-SF questionnaire yields similar results to the standard paper-and-pencil administration of the test. Observed stress levels were considered normal.
KEYWORDS: Questionnaires; Hearing; Hearing Loss; Parents; Stress, Psychological
INTRODUCTION
Commitee (process #113/2010). A prospective longitudinal study design was used. A total of 40 adults (12 men and 28 women) aging between 22 and 47 years (average of 34) voluntarily took part on this research after signing an informed consent. All volunteers had children with ages ranging between 11 months and 10 years (average of 5 years), with normal neuro-psychomotor development and free from hearing complaints.
Participants were divided in four groups of ten according to their age, gender, level of education as well as their children’s age. Within each group, participants were required to answer the question-naire in two different occasions, seven to ten days apart, according to the following scheme:
• Group PP (paper-and-pencil/paper-and-pencil):
administration of the paper-and-pencil format of the questionnaire on both occasions.
• Group EE (electronic/electronic): administration
of the electronic format of the questionnaire on both occasions.
• Group PE (paper-and-pencil/electronic):
administration of the paper-and-pencil and electronic formats of the questionnaire, respec-tively, on each occasion.
• Group EP (electronic/paper-and-pencil):
administration of the electronic and paper-and--pencil formats of the questionnaire, respectively, on each occasion.
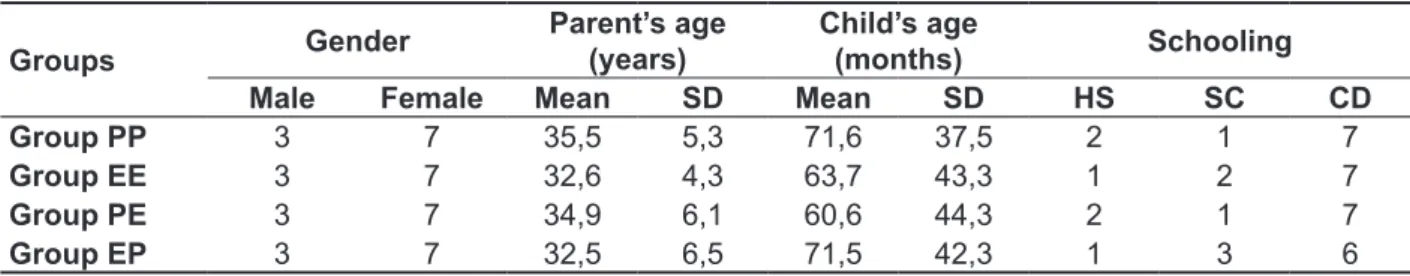
Table 1 shows participants demographics. One way analysis of variance (ANOVA) showed
no statistically signiicant correlation between the
ages of participants (p=0,52) and children (p=0,91) from each group (Table 1).
The emotional responses of parents and their approach on dealing with these stressors affect the family and, consequently, the child’s results. For this reason professionals must be able to identify possible stressors within the family environment in order to provide the necessary support and appro-priate orientations.
The Parenting Stress Index – Short Form
(PSI-SF) 4 is used to quantify the amount of stress
perceived by parents and it has been increasingly used by audiology professionals to analyze parents’ perceptions on their children’s temper and person-ality 5, to evaluate programs on stress management
for parents 6 or to evaluate the impact of the results
of newborn hearing screening 7.
The process of administering questionnaires, calculating scores and analyzing data in large scales is made easier by electronic means. The software PSI-SF 1st Edition is a version of PSI3 Plus
for Windows that allows users to administer both the full and short form of the PSI on a computer. It automatically calculates scores and generates reports.
Studies on the validity of administering the electronic PSI-SF have not been performed up to the moment, therefore this study aims to verify whether the electronic and paper-and-pencil formats of the test yield the same results.
METHODS
This study was performed at our home insti-tution and was approved by the Research Ethics
Table 1 – Demographic data of participants (N=40)
Groups Gender
Parent’s age (years)
Child’s age
(months) Schooling
Male Female Mean SD Mean SD HS SC CD
Group PP 3 7 35,5 5,3 71,6 37,5 2 1 7
Group EE 3 7 32,6 4,3 63,7 43,3 1 2 7
Group PE 3 7 34,9 6,1 60,6 44,3 2 1 7
Group EP 3 7 32,5 6,5 71,5 42,3 1 3 6
Key for Table 1: PP: paper-and-pencil/paper-and-pencil format, EE: electronic/electronic format, PE: paper-and-pencil/electronic for-mat, EP: electronic/paper-and-pencil forfor-mat, Avg: average, Std Dev: standard deviation, HS: completed high school, SC: some college or university, CD: college or university degree
The Parenting Stress Index (PSI) was developed
to evaluate the characteristics of the child, parents, family and stressing life events in the parent-child system. The full version of this tool contains 101 items in addition to an optional 19-item life stress
scale 4. The short form (PSI-SF) consists of 36
statements divided in three sub-scales:
and profession, and the child’s gender and date of birth). The third part consisted of the PSI-SF itself. Participants of the groups PE, EP and EE received an email with instructions (including username and password) and a link to an online copy of the PSI-SF questionnaire.
The time spent by participants was computed either by the researcher (paper-and-pencil administration) or by the kwiksurveys (electronic administration).
Statistical analysis was performed with the software Stata. The percentile of distribution of
responses was computed for the irst administration
of the PSI-SF. The difference in score between the
irst and second administrations of the question -naire was compared by means of paired t-test. The
Pearson correlation coeficient between the irst
and second administration was also calculated. In order to determine whether differences in variability
where related to a speciic way of administering
the questionnaire (P or E), an analysis of variance (ANOVA) was performed with the covariant of results
from the irst administration, comparing the scores
of the second administration of the questionnaire in
all groups. For all cases, the signiicance level was
chosen as 5%.
RESULTS
The amount of time spent on each administration of the PSI-SF is available on Table 2.
Data referring to participants 9 (group EE) and 8 (group EP) were not included in the analysis due to a mistake in computing the time spent to complete the questionnaire, as the survey was left on the background for a few minutes and the browser ended up taking all these minutes in account instead of only considering time spent answering the questions.
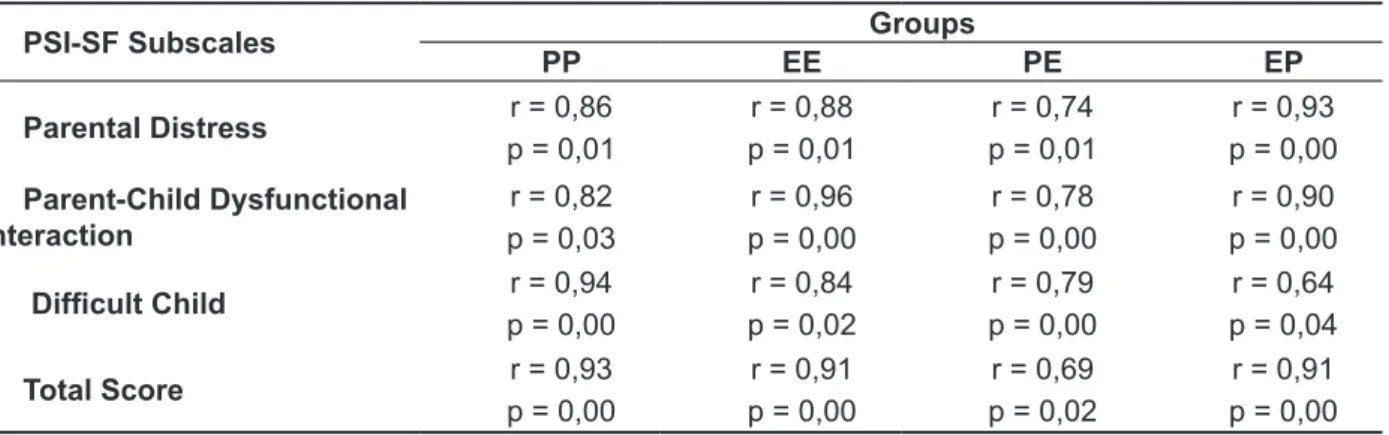
Table 3 shows the correlations (Pearson) between the two administrations of the test.
The average scores (total and for each sub-scale) obtained in each administration of the PSI-SF can be found on Table 4.
The ANOVA with the covariant of the results
of the irst administration of the PSI-SF was
performed with the intent of comparing the scores of each sub-scale among the groups (EE, PP, EP,
PE). No statistically signiicant differences were
found between scores in any sub-scales: Parental Distress (PD, p=0,91), Parent-Child Dysfunctional
Interaction (P-CDI, p=0.85), Dificult Child (DC, p=
0,78) or Total Score (Total, p=0,70).
Example: “I feel limited because of my responsi
-bilities as a parent.”
“P-CDI” Parent-Child Dysfunctional Interaction (items 13 to 24). This sub-scale assesses the extent
to which the parent believes his/her child does not
meet their expectations, based on unsatisfying
parent-child interactions that do not reinforce their
role as a parent. Example: “Sometimes the child does things to upset me, purely out of spite.”
“DC” Dificult Child (items 25 to 36). This sub-scale shows how easy or dificult the parent perceives
their child. It evaluates the parent’s perception on basic behavioral characteristics associated to their
child’s self-regulatory process. Example: “My child is more demanding than the average.”
The PSI-SF also features the tool “Defensive
Responding”, a validity scale (adicionado) that
indicates whether the parent is responding in a defensive manner in order to protect him or herself
from questions that may expose them to judge -ments. This feature, however, was not taken in consideration in this study.
This instrument has been translated and validated in many languages and for this study its European Portuguese version 8 was used and the authors adapted some words and expressions to
Brazilian Portuguese. Such adaptation, as well as the usage of the PSI-SF in Portuguese, were authorized by their rights-holder, Psychological
Assessment Resources (PAR), upon payment of
copyright fees and signature of terms and contracts As far as paper-and-pencil administrations of the test go, parents were asked to read each statement and choose the alternative that best suited them in
a ive-point Likert scale: strongly agree (5 points),
agree (4 points), undecided (3 points), disagree (2 points), strongly disagree (1 point). Scores were calculated for each sub-scales and then added up to yield the Total Stress score. Altogether, the higher the score, the greater is the level of stress in parents 8.
The PSI-SF presents normative data collected from a sample of the US population and the distri-bution of responses are available in the instrument’s test sheet. Scores above the 85th percentile of
normative values are considered high and in need of intervention. These values are: 33 (PD), 26 (P-CDI), 33 (DC) and 86 points (total score).
The electronic administration of the PSI-SF was made possible by designing a survey at
kwiksurveys.com. The irst part of the survey
Table 2 – Time elapsed (in minutes) in each administration of the PSI-SF and statistical signiicance among them (N=40)
Participant
Group PP Group EE Group PE Group EP
1st Paper
2nd Paper
1st Electronic
2nd Electronic
1st Paper
2nd Electronic
1st Electronic
2nd Paper
1 11 5 10 8 3 4 8 7
2 9 12 7 14 8 6 19 15
3 10 8 15 5 7 6 10 8
4 10 8 6 4 10 8 7 4
5 3 4 12 8 12 13 17 14
6 5 3 11 6 13 8 7 5
7 4 3 10 7 7 8 23 7
8 10 9 11 7 15 9 -
-9 14 12 - - 13 11 11 7
10 10 8 7 7 9 5 10 12
Average 8,6 7,2 9,8 7,3 9,7 7,8 12,4 8,7
SD 3,4 3,3 2,8 2,8 3,6 2,7 5,7 3,9
T-test 0,08 0,12 0,04 0,05
Key for Table 2: PP: paper-and-pencil/paper-and-pencil format, EE: electronic/electronic format, PE: paper-and-pencil/electronic for-mat, EP: electronic/paper-and-pencil forfor-mat, SD: standard deviation
*Outliers were not computed for statistical accuracy
Table 3 – Pearson correlation coeficients and the signiicance between scores in the irst and second
administration of the PSI-SF (N=40)
PSI-SF Subscales Groups
PP EE PE EP
Parental Distress r = 0,86
p = 0,01
r = 0,88 p = 0,01
r = 0,74 p = 0,01
r = 0,93 p = 0,00 Parent-Child Dysfunctional
Interaction
r = 0,82 p = 0,03
r = 0,96 p = 0,00
r = 0,78 p = 0,00
r = 0,90 p = 0,00
Dificult Child p = 0,00r = 0,94 p = 0,02r = 0,84 p = 0,00r = 0,79 p = 0,04r = 0,64
Total Score r = 0,93
p = 0,00
r = 0,91 p = 0,00
r = 0,69 p = 0,02
r = 0,91 p = 0,00
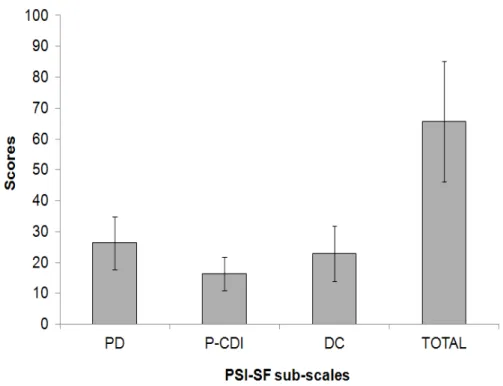
Figure 1 and Table 5 show, respectively, the average scores and distribution of answers for all
participants, according to the irst administration of
the PSI-SF.
Table 4 – Average of scores in each sub-scale of the PSI-SF in both administrations, difference and
statistical difference between scores.
PSI-SF sub-scales Groups
PP EE PE EP
“PD” Parental Distress
Average 1 Average 2 Difference
T-test
27,90 26,40 -1,50
0,42
28,40 25,70 -2,70 0,08
23,00 22,20 -0,80 0,71
26,20 24,90 -1,30 0,19
“P-CDI” Parent-Child Dysfunctional Interaction
Average 1 Average 2 Difference
T-test
16,50 16,70 0,20 0,80
19,70 19,30 -0,40 0,57
14,80 14,80 0,00 1,00
14,30 15,20 0,90 0,27
“DC” Dificult Child
Average 1 Average 2 Difference
T-test
24,00 21,20 -2,80 0,03*
29,20 25,70 -3,50 0,03*
19,00 17,90 -1,10 0,37
19,60 19,60 0,00 1,00
Total Score
Average 1 Average 2 Difference
T-test
68,40 64,30 -4,10
0,18
77,30 70,70 -6,60 0,04*
56,80 54,90 -1,90 0,63
60,10 59,70 -0,40 0,86
Key for Table 4: PP: paper-and-pencil/paper-and-pencil format, EE: electronic/electronic format, PE: paper-and-pencil/electronic for-mat, EP: electronic/paper-and-pencil format.
*p < 0,05 statistically signiicant
Figure 1 – Average and standard deviation of the scores in each PSI-SF sub-scale (N=40)
of paper-and-pencil) found that the time spent answering an electronic questionnaire may be greater or less than the time spent with the paper-and-pencil format according to the devices used on the administration of the test: hand held computer, touchscreen desktop and tablet 9.
Statistically signiicant positive correlations of
strong and moderate nature were found between the
irst and second administration of the PSI-SF for the
Total Score and also for all sub-scales (PD, P-CDI, DC), as indicated by Table 3, showing that scores were kept stable in spite of the format (electronic, paper-and-pencil) of the questionnaire. Hasket et al. 10 have also found correlations between two
administrations of the paper-and-pencil format of
DISCUSSION
The average time spent by participants on the PSI-SF (Table 2) reveals its feasibility for use in clinical practice, since it can be administered within the duration of a typical appointment.
Time spent on the second administration of the
PSI-SF was always lower than in the irst time. This, however, was only statistically signiicant to
the group PE. This may have happened due to the fact that participants were already familiar with the instructions on how to answer the questions in the second administration of the PSI-SF. A study that compared the time spent on the administration of different questionnaire formats (electronic
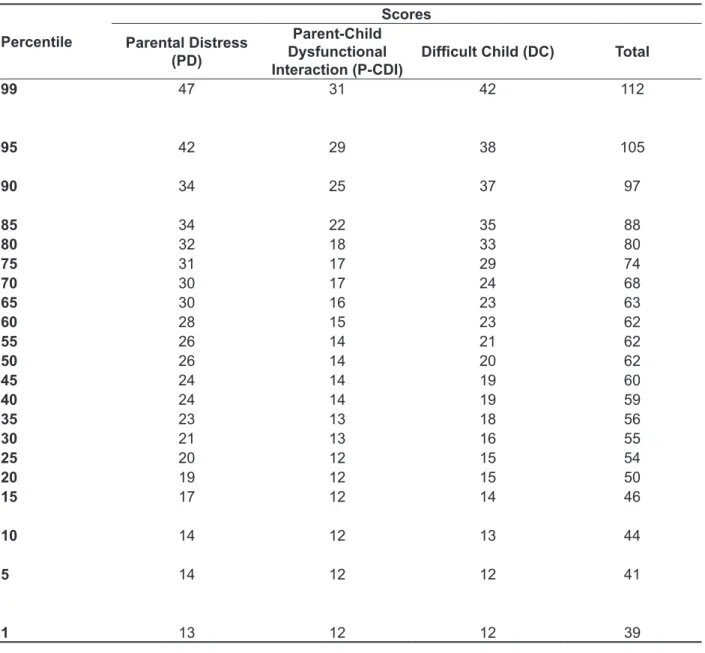
Table 5 – Distribution of participants’ answers in the irst administration of the PSI-SF (N=40)
Percentile
Scores
Parental Distress (PD)
Parent-Child Dysfunctional Interaction (P-CDI)
Dificult Child (DC) Total
99 47 31 42 112
95 42 29 38 105
90 34 25 37 97
85 34 22 35 88
80 32 18 33 80
75 31 17 29 74
70 30 17 24 68
65 30 16 23 63
60 28 15 23 62
55 26 14 21 62
50 26 14 20 62
45 24 14 19 60
40 24 14 19 59
35 23 13 18 56
30 21 13 16 55
25 20 12 15 54
20 19 12 15 50
15 17 12 14 46
10 14 12 13 44
5 14 12 12 41
Brazilian study with similar population found slightly higher scores on the sub-scale P-CDI of the PSI, as well as a higher total score 15. This may have been
due to the lower average age of the children in this study, or even by the fact that Bazon et al. 15 used
a variation of the Canadian version of the PSI-SF in their research.
For all participants of this study, the PSI values were, in all sub-scales, within the acceptable range (between the 15th and 80th percentile)4. As mentioned
before, normative values refer to the US population since such data cannot be found for the Brazilian population. With that in mind, cautious must be taken since during result’s interpretation since normative
data may be inluenced, among others, by linguistic,
cultural, educational, social and economic aspects of the population studied.
Nevertheless, the distribution of scores obtained for the PSI-SF in this study (Table 5) was very similar to the normative US values. Although this study counted with a reduced number of partici-pants and did not intend to create normative data for the Brazilian population, Table 5 may be taken as a reference when interpreting the results of the PSI-SF. Further studies should be performed with the intent of validating this tool to the Brazilian population.
CONCLUSION
This study’s results have shown that the computer-administered version of the Parenting
Stress Index – Short Form (PSI-SF) yields similar
results to the paper-and-pencil administration of the test. Participants presented parental stress levels that were considered normal.
the PSI-SF: 0,61 and 0,75 for subscales and Total Score, respectively, corroborating our results.
Table 4 shows signiicant differences between the average scores for the groups “PP” (“DC” sub-scale) and “EE” (“DC” sub-scale and Total Score). Such
differences, however, do not drastically alter the interpretation of the PSI-SF results, which should be carefully analyzed by the professional. Test-retest
reliability of the PSI-SF was evaluated in a six
months test-retest interval and the values found were 0,84 (Parental Distress), 0,85 (Parent-Child
Dysfunctional Interaction) 0,68 (Dificult Child)
and 0,78 (Total Score) 10. Other studies compared
the administration of different questionnaires in electronic and pencil-and-paper formats and, for
none of them, a statistically signiicant difference was found between the results of the irst and
second administration 11,12.
The analysis of variance did not identify
any signiicant difference among groups for the subscales or total score, conirming that variance is
equivalent among them.
A systematic review on the equivalency of administering tests on electronic and paper-and-pencil formats has analyzed a total of 46 original studies, evaluating 278 scales. Results showed that either formats yield equivalent scores. Correlations were high and differences between means were very small and neither statistically nor clinically
signiicant 13.
The computer-administered PSI-SF may facil-itate aspects such as calculating scores, storing
(results?) on databases, saving inancial and natural
resources and distance testing.
The average scores obtained in the irst adminis -tration of the PSI-SF (Figure 1) were similar to those found by Minetto et al. 14 when the same version
8. Abidin RR, Santos S. Índice de Stress Parental (PSI) - Manual (1ª ed.). CEGOC-TEA, Lisboa. 2003. 9. VanDenKerkhof EG, Goldstein DH, Blaine WC, Rimmer MJ. A comparison of paper with electronic patient-completed questionnaires in a preoperative clinic. Anesth Analg. 2005;101(4):1075-80.
10. Haskett ME, Ahern LS, Ward CS, Allaire JC. Factor structure and validity of the parenting stress
index-short form. J Clin Child Adolesc Psychol.
2006;35(2):302-12.
11. Bushnell DM, Martin ML, Parasuraman B. Electronic versus paper questionnaires: a further comparison in persons with asthma. J Asthma. 2003;40(7):751-62.
12. Bushnell DM, Reilly MC, Galani C, Martin ML, Ricci JF, Patrick DL et al. Validation of electronic data capture of the Irritable Bowel Syndrome-Quality of Life Measure, the Work Productivity and Activity Impairment Questionnaire for Irritable Bowel Syndrome and the EuroQol. Value Health. 2006;9(2):98-105.
13. Gwaltney CJ, Shields AL, Shiffman S. Equivalence of electronic and paper-and-pencil administration of patient-reported outcome measures: a meta-analytic review. Value Health. 2008;11(2):322-33.
14. Minetto MF, Crepaldi MA, Bigras M, Ceretta Moreira L. Práticas educativas e estresse parental de pais de crianças pequenas com desenvolvimento
REFERENCES
1. Fitzpatrick E, Angus D, Durieux-Smith A, Graham I D, Coyle D. Parents’ needs following identiication
of childhood hearing loss. American Journal of Audiology. 2008;17:38-49.
2. Luterman D. Children with hearing loss: A family guide. Hearing Review [periodic na internet] 2006. [acesso em 11 de abril de 2011]. Disponível em: <http://www.hearingreview.com/issues/ articles/2006-10_04.asp>.
3. Meinsen-Derr J, Lim LHY, Choo DI, Buyniski S, Wiley S. Pediatric hearing impairment caregiver
experience: Impact of duration of hearing loss on
parental stress. Int J Pediatr Otorhinolaryngol. 2008;72:1693-703.
4. Abidin RR. Caderno de aplicação: Índice de stress
parental (Parenting stress índex). Psychological
Assessment Resources, Inc., Odessa, Florida. 1995.
5. Koester LS, Meadow-Orlans KP. Responses to interactive stress: infants who are deaf or hearing. American Annals of the Deaf. 1999;144(5):395-403. 6. Adams JW, Tidwell R. An instructional guide for reducing the stress of hearing parents of hearing-impaired children. Am Ann Deaf. 1989;134(5):323-8. 7. Stuart A, Moretz M, Yang EY. An investigation of maternal stress after neonatal hearing screening. Am J Audiol. 2000;9(2):135-41.
RESUMO
Objetivo: avaliar se a aplicação eletrônica do Índice de Estresse Parental – versão reduzida (PSI-SF)
é comparável à aplicação em formato papel e caneta. Veriicar o estresse em pais de crianças com
desenvolvimento normal. Métodos: quarenta adultos, pais de crianças entre seis meses e 10 anos,
foram divididos em quatro grupos, sendo pareados por idade, sexo, escolaridade e idade da criança.
Cada participante completou o questionário em duas ocasiões, com intervalo de sete a dez dias, nas versões: papel-caneta/papel-caneta (PP), papel-caneta/eletrônico (PE), eletrônico/eletrônico
(EE), eletrônico/papel-caneta (EP). O PSI-SF apresenta 36 airmações, divididas em três subescalas:
Sofrimento Parental (SP); Interações Disfuncionais entre Pai e Criança (IDPC) e Criança Difícil (CD). Para análise dos dados foram realizadas as correlações (Pearson) e comparação da pontuação do PSI-SF intra e inter-grupos. Resultados: foram obtidas correlações positivas fortes e médias e
signi-icantes entre a pontuação total e das subescalas do PSI-SF na primeira e segunda aplicação, para todos os grupos. Diferenças signiicantes foram observadas entre as médias das pontuações para o grupo PP (subescala “Criança Difícil”) e grupo EE (subescala “Criança Difícil” e pontuação total). No
entanto, tais diferenças de pontuação não alteraram a interpretação do resultado do questionário.
Não houve diferença signiicante entre os grupos para as quatro subescalas analisadas, conirmando equivalência da variância entre os grupos. O estresse dos participantes, em todas as subescalas,
recaiu dentro da normalidade Conclusão: a aplicação no formato eletrônico do questionário PSI-SF apresenta resultados semelhantes à aplicação papel e caneta. Os níveis de estresse observados foram considerados normais.
15. Bazon MR, Mello ILMA, Bérgamo LPD, Faleiros
JM. Negligência infantil: estudo comparativo do
nível socioecônomico, estresse parental e apoio social. Temas em Psicologia. 2010;18(1):71-84. típico e atípico. Educ Ver. 2012;(43):117-32.
[acesso em 05 de dezembro de 2012]. Disponível em: <http://www.scielo.br/scielo.php?script=sci_
arttext&pid=S0104-40602012000100009&lng=en&
nrm=iso>.
Received on: August 08, 2012 Accepted on: December 17, 2012
Mailing address:
Deborah Viviane Ferrari
Faculdade de Odontologia de Bauru - USP Departamento de Fonoaudiologia
Al. Dr. Octávio Pinheiro Brisolla 9-75 Bauru - SP
CEP: 17102-101