SUBSTANCE USE, VOICE CHANGES AND QUALITY
OF LIFE IN LICIT AND ILLICIT DRUG USERS
Uso de substâncias psicoativas, alterações vocais e qualidade de vida
em usuários de drogas lícitas e ilícitas
Taís de Campos Moreira(1), Camila Gadenz(1), Luciana Rizzieri Figueiró(2), Dirce Maria Capobianco(2),
Karini Cunha (2), Maristela Ferigolo(2), Helena MT Barros(2), Mauriceia Cassol(2)
(1) Universidade Federal de Ciências da Saúde de Porto Ale-gre (UFCSPA), Porto AleAle-gre/RS, Brasil.
(2) Universidade Federal de São Paulo (UNIFESP), São Paulo/SP, Brasil.
Marijuana smoke causes irritation of the mucosa and hoarseness. Marijuana users have vocal
roughness, dificulty in changing pitch, imprecision issues to articulate phonemes, and changes in communication rhythm and luency8-10. Cocaine
is extremely irritating for the nasal mucosa and causes vasoconstriction, which changes sensitivity
and reduces the control over the voice and, thus, facilitates voice abuse11,12.
As for quality of life, studies have shown that drug users have lower indices in the physical, psychological, social, and environmental domains when compared to non-users13-15. Other studies
have identiied low quality of life related to voice problems, manly degenerative and inlammatory diseases and spasmodic dysphonias16,17. Such
pathologies may be related to the abuse of licit and
INTRODUCTION
The prolonged use of psychoactive substances such as alcohol and tobacco may lead to voice pathologies1,2, among which Reinke’s edema,
polyps, nodules, acute laryngitis, and laryngeal carcinoma for exposure to tobacco3, and edema4 and
benign laryngeal diseases for exposure to alcohol, which increases the risk of laryngeal neoplasias5-7.
ABSTRACT
Purposes: to investigate the quality of life and voice in addition to the main auditory perception
changes and acoustic measures jitter, shimmer and Glottal Noise Excitation in users of licit and illicit
psychoactive substances that sought a treatment center for chemical dependency. Methods:
cross-sectional study in which participants responded to questionnaires Voice-Related Quality of Life survey
and World Health Organization Quality of Life Instrument-Bref. We made a voice recording of the vowel
/ a / and a count from 1 to 20. The vocal recordings were evaluated by GRBAS-I (G – overall degree of dysphonia, R – roughness, B – breathiness, A – asteny, S – strain) scale and acoustic analysis software by VoxMetria. Results: 29 protocols and voice recordings, 19 (65.5%) of the sample were male, and the mean age of the sample evaluated was 37.8 years-old. The scores both questionnaires indicate no differences between users of licit or illicit drugs. In perceptual analysis through GRBAS-I they revealed the predominance of mild and moderate changes in grade items of dysphonia, roughness and overall instability for licit and illicit drugs. The jitter and shimmer were altered for men and women, and most of the sample showed the standard deviation of the fundamental frequency as amended. Conclusion: changes in quality of life and voice were identiied in both users of licit or illicit drugs. Most users
showed changes in jitter and shimmer. Illicit drug users were more changes Glottal Noise Excitation
standard deviation of the fundamental frequency.
Subjects: The sample (n = 29) included tobacco,
marijuana, crack, alcohol, cocaine, and solvent
users aged 18 to 60 years, who used one or more psychoactive substances or that had discontinued use within the previous 30 days and who accepted to take part in the study by providing informed
consent. There was no difference in the selection
of licit or illicit drug users since the study’s goal was to comprise users of either type of substance. All patients included in the sample were chosen by the
screening services of the Red Cross of Porto Alegre, RS, Brazil, following the inclusion criteria. Individuals
who were unable to perform speech therapy evalu -ations, who refused to record their voices, or who
where under the inluence of the substance at the moment of the interview were excluded.
Data Collection: The interviewees were invited
to take part in the study by reading the Term of
Informed Consent. After signing the document,
they illed out a standardized protocol with their
socioeconomic characteristics and references to
the psychoactive substance use. The assessments were carried out in person in a silent environment and followed Behlau’s recording script10. During
the assessment, the subjects were standing and
the recorder was placed 10 cm away from the
researcher’s mouth (so as to avoid noise in the
recording) and 5 cm away from the interviewees’ mouth to capture the sustained vowel /a/ and the
count10 from 1 to 20.
Speech Therapy Data Assessment: After all data were collected, the voices were converted into
a digital system and handed to two speech thera
-pists specializing in voice, blinded for the sample,
who assessed the voice recordings using the
GRBAS-I scale (G – overall degree of dysphonia, R – roughness, B – breathiness, A – asteny, S – strain, I – instability)21,22 in order to carry out the
perceptual-auditory voice assessment. GRBAS-I is an effective tool in the perceptual identiication of voice disorders
related to the irregular vibration of vocal folds.
The acoustic analysis was carried out using the software VoXmetria version 2.7, The acoustic measures chosen for analysis were: fundamental frequency (Ff – relex of the biodynamic charac -teristics of the vocal folds and their integration with
subglottal pressure), jitter (indicates short-term Ff variability, measured between glottal cycles), shimmer (indicates the short-term variability in wavelength and is a measure of phonation stability), and Glottal Noise Excitation (GNE) (the acoustic measure that calculates the noise produced by Drug use is very aggressive to the voice
mechanism and there are many reports of the
use of these substances among some voice
professional classes (rock and night club singers, teachers, telemarketing representatives, and salespeople)18-20. And, even if it is not the norm, it
is extremely important that voice therapists are aware of the possible voice changes caused by psychoactive substance use, particularly among voice professionals. Studies carried out with drug users regarding voice and quality of life are still scarce. Expanding the knowledge in the area of voice and increasing the effectiveness of the speech therapy contribute to planning actions that involve the prevention of vocal changes and promotion of health. The goal of this study was to investigate quality of life and voice through the questionnaires Voice-Related Quality of Life (VRQL) and World Health Organization Quality of Life Instrument-Bref (Whoqol-Bref), besides the main perceptual-auditory
changes and acoustic measures of jitter, shimmer,
and glottal noise excitation (GNE) among licit and/ or illicit psychoactive substance users who sought a chemical dependency treatment center.
METHODS
A cross-sectional study was carried out through
data collection with tobacco, marijuana, alcohol, cocaine, solvents, and crack users. The data
were collected between May 2010 and May 2011 at the Red Cross of Rio Grande do Sul, Brazil.
Socioeconomic characteristics, substance use data,
amount, period, and frequency of consumption were investigated using the tool created by the authors, which identiied users of licit or illicit drugs, or of both, besides the application of VRQL and Whoqol-Bref.
The collection also consisted in recording the voice during a count from 1 to 20 and during the sustained emission of the vowel /a/10. Moreover, an acoustic
analysis was performed for the measures of jitter, shimmer, and GNE, as well as of the voice recordings using the GRBAS-I scale (G – overall degree of dysphonia, R – roughness, B – breathiness , A – asteny, S – strain, I – instability)21,22. This study was
approved by the Committee of Ethics and Research of the Federal University of Healthcare Sciences of Porto Alegre (UFCSPA) under protocol 09/532.
Staff Training for the Collection: The collectors
took part in a theory-practice training regarding the speech therapy assessment10. Joint training
sessions for the application of the tools and voice
Data Analysis: Descriptive statistics was employed in the distribution of variables, presented in absolute and relative frequency tables. The quanti
-tative variables are presented as mean±standard
deviation (SD) or median and interquartile range,
when appropriate. Univariate and bivariate analyses were performed. To analyze the Whoqol-Bref and VRQL scores, T-test or Mann-Whitney test were applied to compare the scores of licit or illicit drug users. The analyses were carried out using the
software Statistical Product and Service Solutions (IBM SPSS Statistics) version 19.0 and the values
of p<0.05 were considered statistically signiicant.
RESULTS
Twenty-nine protocols and voice recordings from users of licit or illicit drug, or of both, who accepted to take part in this study were analyzed. The sociodemographic characteristics of these users were presented in Table 1. Most subjects consumed alcohol, followed by tobacco. The characteristics of this consumption were presented in Table 2. vocal fold oscillation). All measures were extracted
from the analysis of the vowel /a/23.
The raw score was used to calculate VRQL.
This score ranges from 0 (minimum) and 100
(maximum), where the higher values indicate better voice quality of life both for the particular domains and for the global score (Gasparini et al.,
2007)24. VRQL has two domains, the physical and
the socioemotional, comprising questions on the dificulties that voice issues entail in the individual’s
life. Whoqol-Bref (short version) is validated in
Portuguese and is widely used in studies involving the Brazilian population. This questionnaire has 26 items distributed among four domains (physical, psychological, social relations, and environment)24.
The physical domain assesses physical pain, fatigue, and routine activities, among other aspects. The psychological domain includes questions on the individual’s positive and negative feelings, besides
self-esteem. Social relations include questions on
social relations, social support, and sexual activity. The environment domain assesses leisure, inancial
resources, and healthcare. The higher the result’s
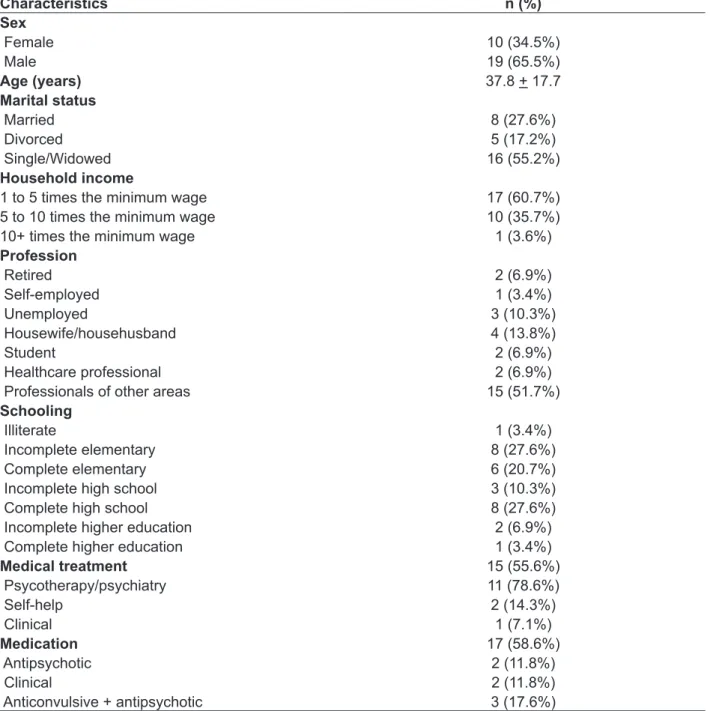
Table 1 – User sample characteristics (n = 29)
Characteristics n (%)
Sex
Female 10 (34.5%)
Male 19 (65.5%)
Age (years) 37.8 + 17.7
Marital status
Married 8 (27.6%)
Divorced 5 (17.2%)
Single/Widowed 16 (55.2%)
Household income
1 to 5 times the minimum wage 17 (60.7%) 5 to 10 times the minimum wage 10 (35.7%)
10+ times the minimum wage 1 (3.6%)
Profession
Retired 2 (6.9%)
Self-employed 1 (3.4%)
Unemployed 3 (10.3%)
Housewife/househusband 4 (13.8%)
Student 2 (6.9%)
Healthcare professional 2 (6.9%)
Professionals of other areas 15 (51.7%)
Schooling
Illiterate 1 (3.4%)
Incomplete elementary 8 (27.6%)
Complete elementary 6 (20.7%)
Incomplete high school 3 (10.3%)
Complete high school 8 (27.6%)
Incomplete higher education 2 (6.9%)
Complete higher education 1 (3.4%)
Medical treatment 15 (55.6%)
Psycotherapy/psychiatry 11 (78.6%)
Self-help 2 (14.3%)
Clinical 1 (7.1%)
Medication 17 (58.6%)
Antipsychotic 2 (11.8%)
Clinical 2 (11.8%)
Anticonvulsive + antipsychotic 3 (17.6%)
and these results were also grouped into licit drug
users and illicit drug users. The data found in the
perceptual-auditory analysis using the GRBAS-I scale showed a slight or moderate prevalence of changes in overall degree of dysphonia and in roughness, as well as in instability among licit drug
users. For the illicit drug users, slight changes
were found in overall degree of dysphonia, strain, and instability. A moderate change prevalence was found in roughness for this group.
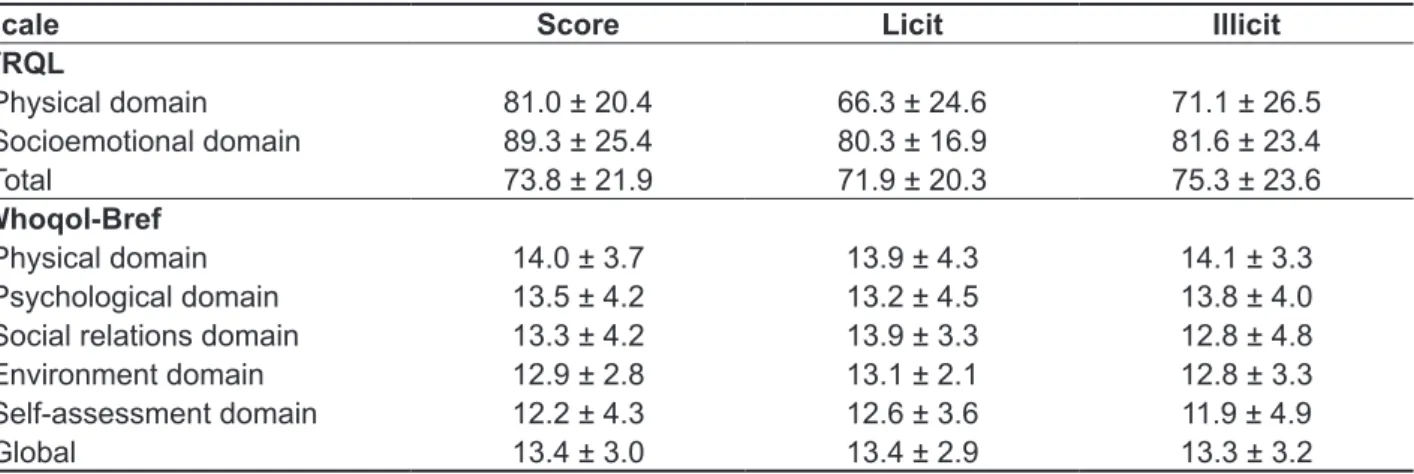
The Whoqol-Bref and VRQL scores were presented with the score of the total sample and of the sample split into licit drug users and illicit drug
users. No statistical difference was found in the
sample, although the illicit drug users had higher means regarding quality of life and of voice, i.e., better quality of life, as well as higher scores in the physical and psychological domains of Whoqol-Bref. The severity of voice disorders assessed in the GRBAS-I scale was presented in Tables 3 and 4
Table 2 – Substance intake characteristics of the users who answered the Voice-Related Quality of Life and Voice and World Health Organization Quality of Life Instrument-Bref questionnaires (n = 29)
Characteristic Substance*
Alcohol 25 (82.2%)
Cocaine 9 (31%)
Crack 7 (24.1%)
Marijuana 14 (48.3%)
Solvent 6 (2%)
Tobacco 20 (69.0%)
Associations
Alcohol + Tobacco 4 (13.8%)
Alcohol + Marijuana + Tobacco 4 (13.8%) Alcohol + Cocaine + Marijuana + Tobacco 4 (13.8%)
Age of 1st use (years) 17.1 + 6.2
Amount of use (units) 12.5 (3.3 – 20.0)
*The users could report the use of more than one substance
The data are presented as absolute n and as percentage (%), mean±SD, or median (interquartile range)
between licit and illicit drug users (P= 0.045): The
median of time was higher for licit drug users (240 months vs. 120 months).
The acoustic analysis data of Ff, jitter, shimmer, and GNE were presented in the total sample (Table 5) and individually for each participant of the research (Table 6). Only time of use was different
Table 3 – Mean score of the Voice-Related Quality of Life (VRQL) and World Health Organization Quality of Life Instrument-Bref questionnaires divided by domain (n = 29)
Scale Score Licit Illicit
VRQL
Physical domain 81.0 ± 20.4 66.3 ± 24.6 71.1 ± 26.5
Socioemotional domain 89.3 ± 25.4 80.3 ± 16.9 81.6 ± 23.4
Total 73.8 ± 21.9 71.9 ± 20.3 75.3 ± 23.6
Whoqol-Bref
Physical domain 14.0 ± 3.7 13.9 ± 4.3 14.1 ± 3.3
Psychological domain 13.5 ± 4.2 13.2 ± 4.5 13.8 ± 4.0
Social relations domain 13.3 ± 4.2 13.9 ± 3.3 12.8 ± 4.8 Environment domain 12.9 ± 2.8 13.1 ± 2.1 12.8 ± 3.3 Self-assessment domain 12.2 ± 4.3 12.6 ± 3.6 11.9 ± 4.9
Global 13.4 ± 3.0 13.4 ± 2.9 13.3 ± 3.2
The data were presented as mean± standard deviation
No statistical difference was found between the licit and illicit drug user groups Student’s T-test, p<0.05.
Table 4 – Voice parameters (n = 26)
Acuteness level Parameters n (%)
Total G R B A S I
0 6 (23.1) 6 (24.0) 23 (88.5) 25 (96.2) 17 (65.4) 10 (38.5) 1 14 (53.8) 11 (44.0) 3 (11.5) 1 (3.8) 6 (23.1) 13 (50.0)
2 6 (23.1) 8 (32.0) - - 3 (11.5) 3 (11.5)
3 - - -
-Licit G R B A S I
0 1 (9.1) 1 (9.1) 9 (81.8) 10 (90.9) 7 (63.6) 1 (9.1) 1 6(54.5) 6(54.5) 2 (18.2) 1 (9.1) 2(18.2) 8 (72.7)
2 4(36.4) 4(36.4) - - 2(18.2) 2(18.2)
3 - - -
-Illicit G R B A S I
0 5 (33.3) 5 (35.7) 14 (93.3) 15 (100) 10 (66.7) 9 (60)
1 8(53.3) 5(35.7) 1 (6.7) - 4(26.7) 5(33.3)
2 2(13.3) 4(28.6) - - 1 (6.7) 1 (6.7)
3 - - -
Table 5 – Acoustic analysis – VoXmetria (n = 28)
Voice parameters Total values Licit Illicit
Fundamental frequency (Hz)†
Male Female
136.37 + 65.14 190.99 + 23.94
111.6 ± 18.8
186.7 ± 32.9 150.8 ± 78.3196.4 ± 4.0 Jitter (%)‡ 0.33 (0.13 – 1.25) 0.65 (0.22 – 3.12) 0.19 (0.11 – 0.59)
Shimmer (%)‡ 6.16 (4.3 – 8.11) 7.31 (5.75 – 8.74) 5.04 (3.85 – 8.08)
GNE rate† 0.41 + 0.17 0.39 ± 0.15 0.42 ± 0.19
The data are presented as (†) mean±SD or (‡) median (p25-p75)
No statistical difference was found between the licit and illicit drug user groups. Student’s T-test or Mann-Whitney test applied when appropriate, p<0.05
Table 6 – Voice parameters and scores of the individuals assessed
Patient
sex Substance
Time of use (years)
Fundamental frequency (Hz)
Jitter (%)
Shimmer
(%) GNE rate VRQL
Whoqol-Bref
1_M at 34 100.98 1.23 8.07 0.49 62.5 12.3
2_M at 16 147.02 0.72 5.7 0.39 42.5 8.9
3_F acmt 10 200.82 0.41 4.33 0.31 87.5 9.8
4_F a 12 178.85 0.54 5.51 0.42 82.5 10.0
5_M ast 10 113.23 0.25 7.9A 0.44 60.0 15.1
6_M acm 37 113.31 0.21 8.11 0.49 97.5 17.5
7_M acmst 1.5 129.44 0.1 5.35 0.35 35.0 7.4
8_F amt 26 192.13 0.11 4.85 0.11 62.5 11.4
9_M a 23 113.58 10.9 20.24 0.31 87.5 15.4
10_M ac 24 132.99 0.2 5.23 0.31 60.0 16.6
11_M at 7 101.81 0.13 4.29 0.29 72.5 15.8
12_F a 11 243.51 3.62 8.09 0.32 95.0 18.0
13_M amt 8.25 136.26 0.59 3.51 0.48 37.5 11.8
14_M cmt 10 137.65 0.17 2.7 0.4 100.0 14.9
15_F acmt 12 198.38 2.95 7.5 0.35 95.0 7.1
16_F a 2 157.7 0.21 5.9 0.41 72.5 10.3
17_M a 4 86.64 3.56 11.6 0.27 95.0 15.8
18_M acmt 6 132.25 0.16 4.08 0.22 100.0 14.2
19_M acmt 2 149.88 0.14 2.46 0.38 87.5 15.5
20_F t 10 177.63 0.57 6.42 0.26 30.0 11.8
21_F amt 42 194.11 0.11 4.13 0.18 100.0 17.7
22_M acmt 9 99.26 1.26 7.99 0.4 65.0 12.0
23_F t 20 175.76 1.78 8.95 0.29 97.5 15.2
24_M acmt 20 392.79 6.94 33.41 0.66 95.0 15.2
25_M c 20 106.18 0.57 15.06 0.63 82.5 13.7
26_F a 50 NA NA NA NA 67.5 10.0
27_M at 8.25 117.64 0.12 6.72 0.79 70.0 15.2
28_M am 1 163.32 0.12 10.22 0.73 45.0 13.1
29_M amt 48 116.83 0.08 3.77 0.72 55.0 15.2
M: male F: female
a: alcohol, c: cocaine/crack, m: marijuana, s: solvent, t: tobacco NA: not assessed
Wan28, who assessed perceptual-auditory changes
in alcohol and tobacco users. These perceptual-auditory changes may be related to the presence of organic changes in the patient. However, this study was limited by the lack of a structural assessment of the vocal tract. Instability was also present at a slight
degree for both licit and illicit drug users. According
to the literature, this instability may be associated
to a vibration of the vocal tract structures, common
in neurological pathologies29, and the long-term
substance use could be the cause of this type of pathology30.
No differences were found in the means of
Ff, jitter, shimmer, or GNE between the groups,
although overall licit drug users had changes in jitter and shimmer, which means a voice with roughness and hoarseness, results that match the literature31,32.
Frequent alcohol or tobacco use increases the
risk of laryngeal pathologies since they are chronic factors that affect the vocal fold mucosa and may impact jitter, shimmer, and fundamental frequency4.
The increase in jitter may be associated to the loss
of motor control of the muscle that maintains vocal
fold function, which increases the periodicity of the
acoustic signal and its values33. Tobacco dries the
vocal fold mucosa and may cause several effects on voice quality since it causes an inlammatory reaction, mainly chronic laryngitis, keratosis, and leukoplasia34. Alcohol intake also leads to an
expansion of blood vessels and edema of the vocal
fold mucosa35. Changes in jitter may cause slight and
involuntary vibrations of the fundamentalfrequency, which determines the instability of the phonation system36 observed in this study, mainly among the
subjects who used alcohol and/or tobacco.
Shimmer, which changes with the reduction in
glottal resistance and the presence of mass lesions
in the vocal folds, also had changes among users who consumed alcohol and tobacco, regardless of their association with illicit drugs. This acoustic
measure may be related to breathiness and the presence of noise in emission36. The increase in
shimmer may be linked to an inconsistency in the
vocal fold contact37. The aggression caused by the
heat of the smoke and by the substances present
in tobacco, such as nicotine, make the mucosa
defend itself by producing keratosis, which ends up increasing its thickness and reducing its elasticity and lexibility31,32.
Glottal Noise Excitation (GNE) was changed
in most users regardless of the substance used.
Glottal noise was also changed and was associated to GNE values: The higher the noise, the lower the GNE3. The standard deviations of the
funda-mental frequency were also changed. According to
Behlau35, the SD of frequency should not go beyond
The acoustic measures of jitter and shimmer had changes at the same rate for either gender:
Shimmer had changes in 30% of women and 52% of men. Changes in fundamental frequency, i.e., higher frequency, was found in 1% of men. In the sample, 60% of women and 40% of men had an Ff
SD higher than 2 (Table 6).
DISCUSSION
Up until now, according to a literature review, this is the irst paper that assesses quality of life and of
voice among users of licit or illicit drugs, or of both.
One of the main indings in this research is that
illicit drug users had lower scores in the domains of social relations, environment, and self-assessment
compared to licit drug users, which suggests a better quality of life of alcohol and tobacco users. Although the results were not statistically signiicant, it is worth pointing out that the sample size was a limitation of the study. Nevertheless, lower scores in Whoqol-Bref match the results by Moreira13,
who assessed quality of life among psychoactive substance users and found that the sample had lower quality of life scores irrespective of the drug used. The low quality of life among licit drug users (alcohol and tobacco) found in this study has already been approached in the literature by Frischknecht25 and
Stafford26. Frischknecht25 reported that a decrease
in alcohol intake by heavy drinkers, even without full withdrawal, is associated with an increase in quality
of life scores. Stafford26 assessed quality of life and
physical dificulties among smokers and detected
low scores in both assessments.
In the VRQL assessment, licit drug users had
lower scores in all domains, which indicate worse
quality of life than illicit drug users, albeit with no
statistical differences. According to the literature,
the life of psychoactive substance users (licit or illicit drugs) is greatly compromised by issues such as psychological, physical, and social complica -tions27. Thus, voice changes may be masked by
other problems or these users may be less aware of the impact on their quality of life and of voice. Voice changes may negatively impact quality of life of individuals who use their voices professionally14, as
well as licit or illicit drug use harms quality of life as
a whole13. The voice issues caused by drug abuse
seem to affect only individuals who use their voices professionally, impairing their work performance and harming important domains of their lives.
Regarding the perceptual-auditory changes in voice (assessed through the GRBAS-I scale), both
licit and illicit drug users had slight or moderate
and quality of life analysis, the speech therapist can approach the issue in a respectful manner and refer the patient to appropriate treatment when drug abuse is identiied.
CONCLUSION
It could be observed that most voices of
psychoactive substance users had changes in jitter and shimmer. The changes in GNE and standard
deviation of Ff were more related to the voices of
illicit drug users. Regarding the perceptual-auditory changes in voice (assessed through the GRBAS-I
scale), both licit and illicit drug users had slight or
moderate changes in overall degree of dysphonia and in roughness. The changes in quality of life and voice were observed in both groups, although illicit drug users had higher means of quality of life and voice, as well as higher scores in the physical and psychological domains of Whoqol-Bref.
ACKNOWLEDGEMENTS
The authors are thankful to the students of the
Speech Therapy Course of UFCSPA who helped in
this research and to the Red Cross of Brazil/Porto
Alegre. To CAPES (doctorate scholarship - Taís de Campos Moreira), CNPQ (productivity scholarship
1C - Helena M.T Barros), and to SENAD/AMTEPA.
2 Hz since values above that may indicate neuro
-logical voice disorders or emotional stress or anxiety because of the task performed.
This study must be taken with care since the sample is highly heterogeneous with the use of multiple substances and very different times of use. The amount consumed and time of use directly impacted the voice assessment results since those in withdrawal for 30 days had lower effect of the
substances on their vocal tract. Other variables that
may have impacted voice quality, such as relux, were not assessed. Similarly, this study did not control for age, which could impact vocal changes, or perform otorhinolaryngologic exams to verify the presence of vocal fold pathologies. Furthermore, the participants were not asked whether they had signs or symptoms of voice problems or some voice pathology prior to the assessment. These subjects could have been excluded from the sample.
It must be considered that the sample size is small and that the Voice-Related Quality of Life (VRQL) questionnaire may not be the best option
to measure these variables among drug users.
Although the data presented and discussed do not allow for a broad generalization, it is important to consider that the speech therapist is able to help in behavior changes regarding drug use by having speciic data. Sometimes, the patient does not report drug use but, with the results of these voice
RESUMO
Objetivos: investigar a qualidade de vida e voz, além das principais alterações perceptivo-auditivas
e as medidas acústicas jitter, shimmer e Glottal Noise Excitation em usuários de substâncias psicoa
-tivas lícitas e/ou ilícitas que buscaram um centro de tratamento para dependência química. Métodos: estudo transversal. Os participantes responderam aos questionários de Mensuração de Qualidade de Vida em Voz e World Health Organization Quality of Life Instrument-Bref. Além disso foi realizado, um registro vocal da vogal /a/ e de uma contagem de números de 1 a 20. Os registros vocais foram
avaliados por meio da escala GRBAS-I (G – grau global da disfonia, R – rugosidade, B – soprosidade, A – astenia, S – tensão) e a análise acústica (jitter, shimmer, Glottal noise excitation) pelo software
VoxMetria. Resultados: avaliaram-se 29 protocolos e registros de voz;na amostra,19 (65,5%) eram homens; a idade média da amostra foi de 37,8 anos. Os escores de ambos os questionários não
apresentaram diferenças entre os usuários de drogas lícitas e os de drogas ilícitas. Na análise per
-ceptiva por meio da GRBAS-I, eles mostraram predominância de alterações discretas e moderadas nos itens grau geral da disfonia, rugosidade e instabilidade para usuárias de drogas ilícitas. A medida
acústica jitter e o shimmer estavam alterados para homens e mulheres, e o desvio padrão da frequên -cia fundamental também estava alterado. Conclusão: alterações de qualidade de vida e voz foram identiicadas em ambos os usuários.A maioria dos usuários apresentou alterações nas medidas de
jitter e shimmer. Usuários de drogas ilícitas apresentaram mais alterações de Glottal Noise Excitation
e desvio padrão da frequência fundamental.
16. Liu CY, Yu JM, Wang NM, Chen RS, Chang HC, Li HY et al. Emotional symptoms are secondary to the voice disorder in patients with spasmodic dysphonia. Gen Hosp Psychiatr. 1998;20(4):255-9. 17. Hancock AB, Krissinger J, Owen K. Voice perceptions and quality of life of transgender people. J Voice. 2011;25(5):553-8.
18. Araújo TM, dos Reis EJF, Carvalho FM, Porto
LA, Reis IC, Andrade JM. Fatores associados a alterações vocais em professoras. Cad. Saúde
Pública. 2008;24(6):1229-38.
19. Fortes FSG, Inamura R, Tsuji DH, Sennes LU. Peril dos proissionais da voz
com queixas vocais atendidos em um centro terciário
de saúde. Rev. Brasileira de Otorrinolaringol. 2007;73(1):27-31.
20. Zampeiri SA, Behlau M, do Brasil OOC. Análise
de cantores de baile em
estilo de canto popular e lírico: perceptivo-auditiva, acústica e da coniguração laríngea. Rev Bras
Otorrinolaringol. 2002;68(3):378-86.
21. Dejonckere P, Remacle M, Freznel-Elbaz E.
Reability and relevence of differentiated perceptual evaluation of pathological voice quality. In: Clemente MP. (ED). Voice update. Amsterdam: Elsevier. 1996; p. 321-24.
22. Hirano M. Clinical examination of voice. New York: Springer Verlag. 1981; p. 81-4.
23. Cassol M. Avaliação da percepção do envelhecimento vocal em idosos. Estud Interdiscip
Envelhec. 2006;9:41-52.
24. Louzada S, Xavier M, Chachamovich E, Vieira G, Santos L, Pinzon V. Aplicação da versão em português do instrumento Whoqol-Bref. Rev Saúde
Pública. 2000;34(2):178-83.
25. Frischknecht U, Sabo T, Mann K. Improved drinking behavior improves quality of life: a follow-up in alcohol-dependent subjects 7 years after
treatment. Alcohol.2013;48(5):579-84.
26. Stafford L, Berk M, Jackson HJ. Tobacco smoking predicts depression and poorer quality of life in heart
disease. BMC Cardiovasc Disord. 2013;24:13-35.
27. Korthuis PT, Zephyrin LC, Fleishman JA, Saha S, Josephs JS, McGrath MM, Hellinger J, Gebo KA; HIV Research Network. Health-related quality of life in HIV-infected patients: the role of substance use.
AIDS Patient Care STDS. 2008;22(11):859-67. 28. Wan P, Huang Z. The effect of smoke and alcohol
abuse to voice. Lin Chung Er Bi Yan Hou Tou Jing Wai Ke Za Zhi. 2008;22(15):686-7.
29. Gillivan-Murphy P, Miller N. Voice tremor: what we know and what we do not know. Curr Opin Otolaryngol Head Neck Surg. 2011;19(3):155-9. 30. Pearce JM. Wernicke-Korsakoff encephalopathy.
Eur Neurol. 2008;59(1-2):101-4.
REFERENCES
1. Danker H, Keszte J, Singer S, Thomä J, Täschner R, Brähler E et al. Alcohol consumption after laryngectomy. Clin Otolaryngol. 2011;36(4):336-44. 2. Ferreira LP, Santos JG, Lima MFB. Sintoma vocal e sua provável causa: levantamento de dados em uma população. Rev CEFAC. 2009;11(1):110-8. 3. Snyderman C, Weissmann J, Tabor E, Curtin H. Crack cocaine burns of the larynx. Arch Otolaryngol
Head Neck Surg. 1991;117(7):792-5.
4. Byeon H, Lee Y. Laryngeal pathologies in older Korean adults and their association with smoking and alcohol consumption. Laryngoscope.
2013;123(2):429-33.
5. Kjaerheim K, Gaard M, Andersen A. The role of alcohol, tobacco, and dietary factors in upper aerogastric tract cancers: a prospective study of
10,900 Norwegian men. Cancer Causes Control. 1998;9(1):99-108.
6. Franceschi S, Talamini R, Barra S, Barón AE,
Negri E, Bidoli E et al. Smoking and drinking in
relation to cancers of the oral cavity, pharynx, larynx, and esophagus in northern Italy. Cancer
Res. 1990;15;50(20):6502-7.
7. Hedberg K, Vaughan TL, White E, Davis S, Thomas DB. Alcoholism and cancer of the larynx: a case-control study in western Washington (United
States). Cancer Causes Control. 1994;5(1):3-8.
8. Almadori G, Paludetti G, Cerullo M, Ottaviani F, D’Alatri L.Marijuana smoking as a possible cause of tongue carcinoma in young patients. J Laryngol
Otol. 1990;104(11):896-9.
9. Colton R, Casper J. Compreendendo os problemas de voz. Porto Alegre: Artes Médicas;
1990.
10. Behlau M. Voz. O livro do especialista. Volume I.
São Paulo: Revinter; 2005.
11. Sataloff RT. Professional voice. The science and
art of clinical care. New York: Raven Press; 1991. 12. Filho ACN, Bettega SG, Lunedo S, Maestri JE, Gortz F. Repercussões otorrinolaringológicas do abuso de cocaína e/ou crack em dependentes de
drogas. Rev. Assoc. Med. Bras. 1999;45(3):237-41.
13. Moreira TC, Figueiró LR, Fernandes S, Justo FM, Dias IR, Barros HM et al. Quality of life of users of psychoactive substances, relatives, and
non-users assessed using the Whoqol-Bref. Cien Saúde Colet. 2013;18(7):1953-62.
14. Mitra M, Chung M, Wilber N, Walker D. Smoking
status and quality of life. A longitudinal study
among adults with disabilities. Am J Prev Med. 2004;27(3):258-60.
35. Behlau M. Voz – O livro do especialista. Volume
II. São Paulo: Revinter; 2008.
36. Teixeira JP; Ferreira D, Carneiro S. Análise acústica vocal – determinação do Jitter e Shimmer para diagnóstico de patalogias da fala. 2011. In 6º Congresso Luso-Moçambicano de Engenharia. Maputo, Moçambique. ISBN: 978-9
37. Finger LS, Cielo CA, Schwars K. Medidas vocais acústicas de mulheres sem queixas de voz e com laringe normal. Braz. J. Otorhinolaryngol.
2009;75(3):432-40. 31. Hocevar-Boltezar I, Zargi M, Strojan P. Risk
factors for voice quality after radiotherapy for early
glottic cancer. Radiother Oncol. 2009;93(3):524-9.
32. Syed I, Daniels E, Bleach NR. Hoarse voice in adults: an evidence-based approach to the 12 minute consultation. Clin Otolaryngol. 2009;34(1):54-8. 33. Rahn DA, Chou M, Jiang JJ, Zhang Y. Phonatory impairment in Parkinson’s disease: evidence from nonlinear dynamic analysis and perturbation analysis. J Voice 2007;21:64-71.
34. Guimarães I, Abberton E. Health and voice quality in smokers: an exploratory investigation. Logoped Phoniatr Vocol. 2005;30(3-4):185-91.
Received on: February 26, 2014 Accepted on: July 21, 2014
Mailing address:
Taís de Campos Moreira
Rua Sarmento Leite, 245 sala 316 – Centro Porto Alegre – RS – Brasil