A
R
T
IG
O
A
R
T
IC
L
E
1 Departamento de Farm acologia e Toxicologia, Fundação Universidade Federal de Ciências da Saúde de Porto Alegre. R. Sarmento Leite 245/316, Centro. 90.0150-070 Porto Alegre RS.
Quality of life of users of psychoactive substances, relatives,
and non-users assessed using the WHOQOL-BREF
Qualidade de vida em usuários de substâncias psicoativas,
familia-res e não usuários por meio do WHOQOL-BREF
Resumo Qualidade de vida está relacionada a um dos desejos humanos básicos, que é viver bem e se sentir bem. O objetivo deste estudo foi avaliar a qualidade de vida dos usuários de substâncias psicoativas e familiares, em comparação aos não-usuários, analisados por estratos socioeconômicos. Foi realizado um estudo transversal com usuá-rios de substâncias psicoativas, parentes e outras pessoas que chamaram o Serviço de Informação e Orientação sobre o abuso de drogas (VIVAVOZ). A coleta de dados ocorreu entre novem bro de 2009 e dezembro de 2010. Foram coletados dados de usuários, parentes e não-usuários, incluindo as caract eríst icas socioecon ôm icas e dados sobre consumo de substâncias, quando apropria-do, além disso, foi administrado o questionário W BREF. Responderam ao W HOQOL-Bref 347 pessoas, 138 ( 70%) usuários de ál-cool , 76 (39%) maconha, 111 (57%) tabaco, 78 (40%) de cocaína e 70 (36%) crack. Os controles tiveram escores maiores de qualidade de vida, que os familiares de usuários e usuários em todas as áreas do questionário (p < 0,05). Usuários de subs-tâncias psicoativas tiveram escores mais baixos em quase todos os domínios e escore geral do W HO-QOL-Bref em comparação com a amostra de não usuários de drogas. Estes resultados refletem baixa qualidade de vida dos pacientes e seus familiares.
Palavras-chave Qualidade de vida, Usuários de
drogas, Família, Dependência
Abstract Quality of life is related to one of the basic human desires, which is to live well and feel good. The scope of this study was to evaluate the quality of life of psychoactive substance users and relatives, compared to non-users, analyzed by so-cioeconomic strata. A cross-sectional study with users of psychoactive substances, relatives, and other individuals who called the Information and Orientation Service regarding drug abuse. Data collection took place between November 2009 and December 2010. Data was collected from users, relatives, and non-users, including socioeconomic characteristics and data regarding substance con-sumption when appropriate. In addition to this the abbreviated version of the World Health Or-ganization Quality of Life (W HOQOL-BREF) questionnaire was given to 347 individuals. Am ong the 138 users (70%) used alcohol, 76 (39%), marijuana, 111 (57%) tobacco, 78 (40%) cocaine and 70 (36%) crack. Control subjects had higher, scores than the relatives of users and users in all areas of the questionnaire (p < 0.05). Psy-choactive substance users scored lower in almost all domains and overall score in the W HOQOL-BREF questionnaire in comparison with the sam-ple of non-drug users. These findings reflect poor quality of life of patients and their relatives.
Key words Quality of life, Drug users, Relatives,
Addiction
Taís de Campos Moreira 1 Luciana Rizzieri Figueiró 1 Simone Fernandes 1 Fernanda Maia Justo 1 Ismael Rodrigo Dias 1
M
o
Introduction
Quality of life is related to one of the basic
hu-man desires, which is to live well and feel good1.
Several factors may interfere with this quality, including the problems that arise from the use of substances, which can consequently affect life satisfaction2.
Despite the growing importance of evaluat-ing quality of life in many areas of health, there is still a lack of studies on psychoactive substance
users3,4. Castro et al.5 argued that smokers, for
example, show greater impairment in quality of life in all areas, as well as more symptoms of
anxiety and depression. Silva Lima et al.6 showed
that males with more severe alcohol dependence perceive their own quality of life as worse.
Loza-no et al.7 in a study of cocaine users noted that
the deterioration of quality of life was mainly related to sociodemographic differences. The compromised state of the health of cocaine users has been related to the intensity of consumption of the substance, compromised quality of life, and lifestyle8.
Other factors can also interfere with the quality of life of drug users, including sociodemograph-ic variables, such as gender, age, marital status,
educational level, and economic level9,10. In
gen-eral, ethnicity can interfere with the life satisfac-tion of individuals: the black and hispanic pop-ulations are less satisfied, in general, than the white population. There is also a strong relationship of quality of life with social bonds. These contacts are substantially more important for life
satis-faction than increases in economic status11. There
is a weak association between marital status and emotional support, weakening the argument that marriage provides social support. There are pos-itive correlations among marital status, educa-tion, income, and home ownership, with greater
well-being for those who are married11.
Quality of life has increasingly been under-stood as a prerequisite for the overall health of people, including satisfaction, happiness and well-being; therefore, all the variables that interfere with this aspect are important because they can alter or modify the treatment of any illness, in-cluding chemical dependence. The understand-ing that the effects of substances that interfere with the quality of life of drug users, leading to overall worsening from a biopsychosocial point of view, is relevant and using this information to educate drug users about the additional losses caused by drug use, as well as to motivate them to cease drug use and remain abstinent, justifies
the interest in the topic because attaining quality
of life is also a human need1, not just the need of
an addict. Therefore, the objective of this study was to assess the quality of life of psychoactive substance users and relatives, compared to non-users, analyzed by socioeconomic strata. For this purpose, this study was developed with individ-uals who contacted a telephone service for infor-mation and advice about drugs.
Methods
Ethics
Ethical approval for this study was obtained from the Ethics Committee of Universidade Fed-eral de Ciências da Saúde de Porto Alegre (UFC-SPA) (Porto Alegre Federal University of Health Sciences).
Design
We performed a cross-sectional study.
Subjects
Data collection took place between Novem-ber 2009 and DecemNovem-ber 2010 through phone calls
to the VIVAVOZ call center12-14. This call-center
offers free and anonymous telephone counseling and is open to the general population in Brazil. It provides guidance and information on the char-acteristics of psychoactive drugs and their action in the body, in addition to information on pre-venting abuse. Moreover the service seeks pro-mote the cessation of drug use and help relatives to better deal with the family members who are
users13. Users of psychoactive substances,
S
aú
d
e C
o
le
tiv
a, 1
8
(7
):1
9
5
3
-1
9
6
2
, 2
0
1
3
were not drug users and did not have relatives that were users formed the control group. Rela-tives who were also using drugs of abuse were excluded. It is important to take into account that drug user and relatives who called VIVAVOZ are seeking for help in order to aid his relatives to stop consuming drugs. Or rather, there is already a problematic relation with the drug wich is dif-ferent from those who use recreatively, and they have never requested the aid service for this pur-pose. Verbal in form ed con sen t was obtain ed from all participants before they answered a ques-tionnaire covering socioeconomic characteristics an d data regardin g su bstan ce con su m ption , when appropriate. In addition, during the client return call, we administered the World Health Organization Quality of Life Instrument abbreviated version (WH OQOLBREF) qu estion
-naire1. The WHOQOL-BREF has been validated
in Portuguese1 and has been widely used in
stud-ies of the Brazilian population15.
The data on the participants was collected by 40 college students in different health areas and education, who were previously selected and
trained12-14. For the application of the
WHOQOL-BREF1, theoretical and practical training was
con-ducted, including lectures and the application of the questionnaire in pairs. The data were then evaluated and discussed in order to standardize the application of the instrument by phone. Spe-cific software was created to assist the counselors and record the date from participants.
During the determined period, VIVAVOZ re-ceived 10,212 return calls. The application of the WHOQOL-BREF was conducted randomly on certain days of each month; and 8170 individuals were invited to participate of this study (80% of all return calls). Of these, around 73% callers did not agree or declined to participate after being read the consent form.
Inclusion and exclusion
The sample included all Brazilian users of psychoactive substances and non-users between th e ages of 18 an d 60 year s wh o called th e VIVAVOZ service during the collection period and who agreed to participate in the study after in-formed consent. The individuals who demon-strated an inability to respond adequately to the telephone protocol or the WHOQOL-BREF or who reported being or were perceived to be un-der the influence of drugs were excluded. In addi-tion, we excluded the protocols of the WHOQOL-BREF that were incomplete.
Variables
The main effect of interest in this investiga-tion was recognize if drug users or relatives of drug users show difference in the quality of life measured by WHOQOL-bref identifying if and how the sociodemographic characteristics affect this relationship. So the sociodemographic char-acteristics are seen as confounders and WHO-QOL-bref results as predictor of the outcome of interest.
Sociodemograhic characteristics: The ques-tionnaire included questions on gender, age, mar-ital status, occupation, family income and edu-cation level. In order to stratify the data, subjects were categorized by age into young adults (18 to
24 years) and adults (25 to 60 years)16. For the
income strata, the Brazilian minimum wage in 2011 (US$ 250) was used as a base value. WHO-QOL-bref: It is a questionnaire of 26 items dis-tributed into four domains (physical, psycho-logical, social relationships, and environment) and self-assesment, in which the answers are
re-corded in individual five-point scales1. The
punc-tuation in each domain and overall score are cal-culated according to the syntax provided by the
World Health Organization17 with higher scores
indicating better quality of life. In order to classi-fy the individuals of the sample in lower or high-er qualities of life, the mean of ovhigh-erall score for the control group (14.3) was used as cutoff point.
Data Analysis
Statistical methods
Initially, a univariate descriptive analysis of socioeconomic characteristics was performed, in which qualitative variables were ranked by fre-quency and percentage and quantitative variables were ranked by mean and standard deviation.
For t h e assessm en t of WH O Q O L- BREF scores between groups, we used the one-way ANOVA (post hoc Tukey test), com paring the scores of users with the scores of relatives and of non-users (considered as controls). The same tests were used for the assessment of the strata.
For the multivariate analysis, the participants
were categorized in lower or higher qualities of life4.
M
o
Results
In total, 2247 agreed to participate of this study. However, 84% of these did not fill inclusion crite-ria debilitating conditions or filled out the ques-tionnaires incompletely which prevented the data analysis and therefore were excluded. Thus, a total of 347 subjects were included in the study.
The 347 subjects included in the study were classified as users (56%), relatives (23%), or non-users (21%). The general sample characteristics are summarized in Table 1. Among the users, 138 (70%) used alcohol, 76 (39%) used marijuana, 111 (57%) used tobacco, 78 (40%) used cocaine
and 70 (36%) used crack. Respondents had the opportunity to report the consumption of more than one substance and 74% of the users were poly drug users.
As for the domain scores on the WHOQOL-BREF, we observed that the control subjects had higher scores than the users and relatives of us-ers in all areas of the questionnaire (p < 0.05), except in the environmental domain (Table 2).
Table 3 describes the mean values and stan-dard deviation s of the WH OQOL-BREF do-mains, classified by groups and stratified by so-cioeconomic variables (gender, age, education, and income). Domain scores differed according
Variables
Gender (n = 347) Female Male
Marital Status (n = 335) Married
Separated Single Widowed
Family income (n = 322) 1-5 minimum wages Over 5 minimum wages Occupation (n = 334)
Em ployed Unem ployed
Educational level (n = 329) Basic or lower
Medium or higher Age (years) (n = 344)
Total n (%)
162 (47%) 185 (53%)
142 (42%) 36 (11%) 150 (45%)
7 (2%)
222 (70%) 100 (30%)
241 (72%) 93 (28%)
124 (38%) 205 (62%) 34 ±10
Table 1. Characteristics of the sample subjects who called VIVAVOZ and answered the WHOQOL-BREF –
November 2009 to December 2010 (n = 347)
Users (n = 195)
42 (21%) 154 (79%)
71 (38%) 17 (9%) 99 (53%)
-124 (69%) 56 (31%)
142 (75%) 47 (25%)
79 (43%) 104 (57%)
31 ± 8
Relatives (n = 78)
72 (92%) 6 (8%)
43 (56%) 13 (17%) 15 (20%) 6 (8%)
53 (71%) 22 (29%)
44 (60%) 30 (40%)
30 (39%) 46 (61%) 42 ± 10
Controls (n = 74)
48 (66%) 25 (34%)
28 (39%) 6 (9%) 36 (51%)
1 (1%)
45 (67%) 22 (33%)
55 (78%) 16 (22%)
15 (21%) 55 (79%) 34 ± 12
The data are presented as numbers (percentage) and the variable age as mean ± standard deviation. Not all participants answered all questions.
D o m ains
Physical* Psychological* Social* En viron m en t* Self-assessm ent* Overall*
Users (n = 195) (mean ± sd)
14.6 ± 2.7b 13.6 ± 3.0b,c 13.4 ± 3.9c 13.1 ± 2.7b 13.9 ± 3.5b 13.7 ± 2.4b
Table 2. WHOQOL-BREF mean scores for users, their relatives, and the controls, classified by domains.
Relatives (n = 78) (mean ± sd) 13.3 ± 3.9a,c 12.4 ± 3.1a,c 13.5 ± 3.6c 11.9 ± 2.6ª 12.7 ± 3.8ª,c 12.7 ± 2.3ª,c
Controls (n = 74) (mean ± sd)
15.1 ± 2.9b 15.2 ± 2.8a,b 15.0 ± 3.6ª,b 12.8 ± 2.9 14.9 ± 3.2b 14.4 ± 2.4b
* p < 0.05 ** One-way ANOVA. The letters are used to indicate the difference: ap < 0.05 with regard to the users group; bp < 0.05 with regard to the relatives group; cp < 0.05 with regard to the control group.
Significance**
S aú d e C o le tiv a, 1 8 (7 ):1 9 5 3 -1 9 6 2 , 2 0 1 3
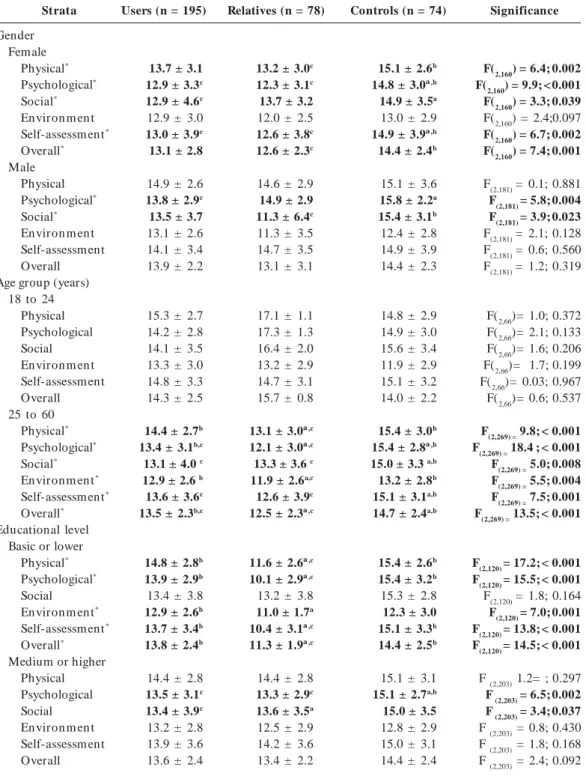
to the strata observed. While female relatives of users had lower scores for the physical, psycho-logical and self-assessment domains and for over-all quality of life when compared to the control group, the male relatives had worse scores only
for the social d om ain . Moreover, u sers on ly showed a worse score for some of the domains assessed when they were female. Younger and more educated individuals showed similar scores for all domains, regardless of the group to which
Strata Gender Female Physical* Psychological* Social* En viron m en t Self-assessm ent* Overall* Male
Physical Psychological* Social* En viron m en t Self-assessm ent Overall Age group (years)
18 to 24 Physical Psychological Social En viron m en t Self-assessm ent Overall 25 to 60
Physical* Psychological* Social* En viron m en t* Self-assessm ent* Overall* Educational level
Basic or lower Physical* Psychological* Social En viron m en t* Self-assessm ent* Overall* Medium or higher
Physical Psychological Social En viron m en t Self-assessm ent Overall
Users (n = 195)
13.7 ± 3.1
12.9 ± 3.3c
12.9 ± 4.6c
12.9 ± 3.0
13.0 ± 3.9c
13.1 ± 2.8
14.9 ± 2.6
13.8 ± 2.9c
13.5 ± 3.7 13.1 ± 2.6 14.1 ± 3.4 13.9 ± 2.2
15.3 ± 2.7 14.2 ± 2.8 14.1 ± 3.5 13.3 ± 3.0 14.8 ± 3.3 14.3 ± 2.5
14.4 ± 2.7b
13.4 ± 3.1b,c
13.1 ± 4.0 c
12.9 ± 2.6 b
13.6 ± 3.6c
13.5 ± 2.3b,c
14.8 ± 2.8b
13.9 ± 2.9b
13.4 ± 3.8
12.9 ± 2.6b
13.7 ± 3.4b
13.8 ± 2.4b
14.4 ± 2.8
13.5 ± 3.1c
13.4 ± 3.9c
13.2 ± 2.8 13.9 ± 3.6 13.6 ± 2.4
Table 3. Differences in quality of life among users of psychoactive drugs, their relatives, and control subjects,
stratified by socioeconomic characteristics.
Relatives (n = 78)
13.2 ± 3.0c
12.3 ± 3.1c
13.7 ± 3.2 12.0 ± 2.5
12.6 ± 3.8c
12.6 ± 2.3c
14.6 ± 2.9 14.9 ± 2.9
11.3 ± 6.4c
11.3 ± 3.5 14.7 ± 3.5 13.1 ± 3.1
17.1 ± 1.1 17.3 ± 1.3 16.4 ± 2.0 13.2 ± 2.9 14.7 ± 3.1 15.7 ± 0.8
13.1 ± 3.0ª,c
12.1 ± 3.0ª,c
13.3 ± 3.6 c
11.9 ± 2.6a,c
12.6 ± 3.9c
12.5 ± 2.3ª,c
11.6 ± 2.6ª,c
10.1 ± 2.9ª,c
13.2 ± 3.8
11.0 ± 1.7a
10.4 ± 3.1ª,c
11.3 ± 1.9ª,c
14.4 ± 2.8
13.3 ± 2.9c
13.6 ± 3.5a
12.5 ± 2.9 14.2 ± 3.6 13.4 ± 2.2
Controls (n = 74)
15.1 ± 2.6b
14.8 ± 3.0ª,b
14.9 ± 3.5a
13.0 ± 2.9
14.9 ± 3.9ª,b
14.4 ± 2.4b
15.1 ± 3.6
15.8 ± 2.2a
15.4 ± 3.1b
12.4 ± 2.8 14.9 ± 3.9 14.4 ± 2.3
14.8 ± 2.9 14.9 ± 3.0 15.6 ± 3.4 11.9 ± 2.9 15.1 ± 3.2 14.0 ± 2.2
15.4 ± 3.0b
15.4 ± 2.8ª,b
15.0 ± 3.3 a,b
13.2 ± 2.8b
15.1 ± 3.1a,b
14.7 ± 2.4a,b
15.4 ± 2.6b
15.4 ± 3.2b
15.3 ± 2.8 12.3 ± 3.0
15.1 ± 3.3b
14.4 ± 2.5b
15.1 ± 3.1
15.1 ± 2.7a,b
15.0 ± 3.5 12.8 ± 2.9 15.0 ± 3.1 14.4 ± 2.4
Significance
F(2,160) = 6.4; 0.002
F(2,160) = 9.9; < 0.001
F(2,160) = 3.3; 0.039
F(2,160) = 2.4;0.097
F(2,160) = 6.7; 0.002
F(2,160) = 7.4; 0.001
F(2,181) = 0.1; 0.881
F(2,181) = 5.8; 0.004
F(2,181) = 3.9; 0.023
F(2,181) = 2.1; 0.128 F(2,181) = 0.6; 0.560 F(2,181) = 1.2; 0.319
F(2,66)= 1.0; 0.372 F(2,66)= 2.1; 0.133 F(2,66)= 1.6; 0.206 F(2,66)= 1.7; 0.199 F(2,66)= 0.03; 0.967 F(2,66)= 0.6; 0.537
F(2,269) = 9.8; < 0.001
F(2,269) = 18.4 ; < 0.001
F(2,269) = 5.0; 0.008
F(2,269) = 5.5; 0.004
F(2,269) = 7.5; 0.001
F(2,269) = 13.5; < 0.001
F(2,120) = 17.2; < 0.001
F(2,120) = 15.5; < 0.001
F(2,120) = 1.8; 0.164
F(2,120) = 7.0; 0.001
F(2,120) = 13.8; < 0.001
F(2,120) = 14.5; < 0.001
F (2,203) 1.2= ; 0.297
F (2,203) = 6.5; 0.002
F (2,203) = 3.4; 0.037
F (2,203) = 0.8; 0.430 F (2,203) = 1.8; 0.168 F (2,203) = 2.4; 0.092
M
o
they belonged. However, the scores for all mains were different (except for the social do-main for individuals with low educational levels) for older subjects and subjects with lower educa-tional levels. Family income also interfered with quality of life. Low-income users showed higher scores for the physical, psychological, environ-mental domains and global scores when com-pared to relatives but not when comcom-pared to the controls. As for those respondents who had high-er fam ily incom es, the m ain diffhigh-erences whigh-ere found between relatives and controls with respect to the psychological and social self-evaluation domains. Single users showed higher scores when compared to relatives for the physical, psycho-logical, and global self-evaluation domains. Only for the psychological domain did single relatives have lower scores when compared to the
con-trols. Married users, conversely, had higher scores in comparison to relatives for the physical and environmental domains. These relatives showed worse scores for the psychological domain and worse global scores when compared to the con-trol subjects.
When the logistic regression analysis was per-formed, it was observed that the variables of drug use, lower income, and older age were associated with a lower quality of life (p < 0.05). For users, lower family income and older age were associ-ated to worse quality of life. Moreover, users were almost twice as likely to have a poor quality of life regardless of other features (Table 4). The logistic r egr ession an alysis am on g r elatives showed that female individuals of older age and with low incomes were at an increased risk of a lower quality of life (Table 4).
Strata
Family income 1-5 minimum wages
Physical* Psychological* Social En viron m en t* Self-assessm ent* Overall*
Over 5 minimum wages Physical
Psychological* Social* En viron m en t Self-assessm ent* Overall* Marital Status
Single Physical Psychological* Social En viron m en t Self-assessm ent* Overall Married
Physical* Psychological* Social* En viron m en t* Self-assessm ent* Overall*
Users (n = 195)
14.4 ± 2.7b
13.3 ± 2.8b,c
13.4 ± 3.9
12.5 ± 2.4b
13.8 ± 3.6
13.4 ± 2.2b
15.3 ± 2.9
14.7 ± 3.2b
13.5 ± 3.8c
14.4 ± 2.8 14.3 ± 3.3 14.6 ± 2.4
14.5 ± 2.7 13.5 ± 3.1 13.0 ± 3.8 13.0 ± 2.8 13.9 ± 3.6 13.6 ± 2.4
14.7 ± 2.9
13.7 ± 3.0c
13.7 ± 4.2c
13.2 ± 2.6b
13.6 ± 3.6
13.8 ± 2.4c
Table 3. continuation
Relatives (n = 78)
12.8 ± 3.0ª,c
12.0 ± 3.2ª,c
13.6 ± 3.6
11.3 ± 2.4a
12.5 ± 3.6c
12.2 ± 2.3ª,c
14.2 ± 2.9
12.9 ± 2.6a,c
13.0 ± 3.5c
13.5 ± 2.5
13.0 ± 4.4c
13.4 ± 2.2c
13.3 ± 3.0
12.2 ± 3.5c
13.3 ± 3.1 11.9 ± 2.8
12.4 ± 3.9C
12.5 ± 2.5
13.4 ± 3.1c
12.5 ± 2.8c
13.6 ± 3.9c
12.0 ± 2.4a,c
13.0 ± 3.8 c
12.7 ± 2.2c
Controls (n = 74)
14.9 ± 2.8b
14.6 ± 3.1a,b
14.5 ± 3.6 12.1 ± 2.8
14.4 ± 2.9b
13.9 ± 2.4b
15.5 ± 3.4
16.1 ± 2.0b
16.2 ± 2.7ª,b
13.9 ± 2.9
15.9 ± 3.5b
15.3 ± 2.2b
14.6 ± 2.8
14.4 ± 2.7b
14.3 ± 3.5 12.0 ± 2.8
14.6 ± 3.0b
13.7 ± 2.1
15.9 ± 3.0b
16.2 ± 2.6ª,b
16.0 ± 2.9a,b
13.8 ± 2.8b
15.4 ± 3.5b
15.3 ± 2.5ª,b
Significance
F(2,220) = 8.13; < 0.001
F(2,220) = 6.23; < 0.001
F(2,220) = 1.18; 0.249
F(2,220) = 4.65; 0.009
F(2,220) = 2.65; 0.016
F(2,220) = 6.41; 0.001
F(2,96) = 1.3; 0.270
F(2,96) = 6.9; 0.002
F(2,96) = 6.0; 0.004
F(2,96) = 1.0; 0.359
F(2,96) = 3.6; 0.032
F(2,96) = 3.5; 0.033
F (2,189) = 2.8; 0.062
F (2,189) = 4.8; 0.009
F (2,189) = 2.0; 0.135 F (2,189) = 3.1; 0.048
F (2,189) = 4.0; 0.020
F (2,189) = 3.2; 0.05
F (2,140) = 6.2; 0.003
F (2,140) = 14.4; <0.001
F (2,140) = 4.1; 0.019
F (2,140) = 5.1; 0.007
F (2,140) = 3.8; 0.025
F (2,140) = 9.8; < 0.001
S
aú
d
e C
o
le
tiv
a, 1
8
(7
):1
9
5
3
-1
9
6
2
, 2
0
1
3
Discussion
As expected, users of psychoactive substances had lower scores for almost all domains and for the overall score on the WHOQOL-BREF, in com-parison to the sample of non-drug users. In this study the QV of life scores were lower regardless the type of substance abused. This is consistent with a previous report showing that sm okers presented lower scores in respect to the social relationships and psychological domains of the
WHOQOL-BREF18. Surprisingly, the relatives of
users showed even lower levels of quality of life, with differences in all domains. These findings reflect the poor quality of life of users and their
relatives. Domingo-Salvany et al.19 reported that
the quality of life of users is worse when associat-ed with the consumption of multiple drugs, es-pecially am ong younger, lesser-educated, and unemployed individuals. Moreover, it was possi-ble to confirm that chemical dependence affects not only the users but also relatives who live with
them , in term s of psychological pathology20,
which is strongly reflected in quality of life. In this study, women showed lower levels of quality of life for the four domains of the ques-tionnaire regardless of the group to which they
belonged, when compared to men. Some authors have stated that women present a poorer quality of life regardless of the instrument used to
per-form the measurement21-23.In general, female
al-cohol users have an impaired quality of life19, and
these authors have stated that women are under more stress and have other disabilities. In this study, we can report the outcome of a worse qual-ity of life in female users of illicit drugs, as well.
Individuals with higher education levels have
a better overall quality of life19. The indices of the
various domains of individuals in this study who attended school for less than eight years were lower than those of groups who were educated for longer than eight years. When we consider the scores for overall quality of life, educational level seemed to be a confounding factor, demon-strating that drug use decreased when quality of life was better. However, by detailing the quality of life domains, we can observe damage to the physical, psychological, environmental, and self-assessment aspects, which should serve as a warn-ing about the long-term consequences of drug use in intellectually disadvantaged populations.
The variable older age appeared as a risk fac-tor for a worse qu ality of life. Accordin g to
Gonçalves e Kapczinski21, the relationship between
Quality of life
Gender Female Male Group
User Family Con trol Educational level
Basic or lower Medium or higher Family income
1-5 minimum wages Over 5 minimum wages Age group (years old)
18 to 24 25 to 60 Marital Status
Single Married
Table 4. Multivariate analysis (logistic regression) for poor quality of life, WHOQOL-BREF (basis overall
cutoff point for the control group 14.3). Odds Ratio adjusted to user
1.5
-1.9*
-1.1
-3.0*
-2.4* 1.6
-Odds Ratio adjusted to family
2.1*
-1.3
-1.1
-2.9*
-2.8* 1.5
-95% CI
1.1-4.1
0.8-2.1
0.6- 1.9
1.7-5.2
1.4-5.7
0.8-2.6
Minimum wage = US$250. 95%CI = confidence interval. *p<0.05
95% CI
0.8 - 2.5
1.2-3.0
0.6-1.9
1.7-5.4
-1.2-4.9
M
o
quality of life and gender and age needs to be ex-plored further because some studies have shown that, unlike the results of this study, the older the
individuals, the better their quality of life scores21.
Individuals with family incomes below five mini-mum wages were three times more likely to expe-rience a poorer quality of life than those with high-er incomes, whethhigh-er they whigh-ere ushigh-ers, relatives or
controls. According to Kluthcovsky et al.24,
socio-economic development is directly linked to hav-ing a life with acceptable quality. Thus, individu-als who do not have satisfactory jobs (objective and subjective aspects) that provide them incomes within a comfortable range are unlikely to present
a good quality of life24.
Drug users and their relatives had quality of life scores much lower than the control subjects, except in the environmental domain, in which users had better scores than the controls. It seems that users lost the perception of problems relat-ed to their environments and that family mem-bers were involved in other difficulties, which would also reduce this perception. However, when assessing overall quality of life, users were almost twice as likely to have a worse quality of life.
Drug users, whether they are consumers of licit or illicit substances, have lower scores for
quality of life. Studies with alcohol users25,
nico-tine users26, and cocaine users7 demonstrated the
benefits and costs of ceasing consumption for changes in quality of life.
Regarding relatives, for example, wives of al-coholics showed signs of anxiety, depression, ag-gression, cognitive impairment, and high
psycho-logical stress, affecting their satisfaction with life27.
The presence of a chemically dependent person in the home is associated with disturbances in the harmony of family life, thus affecting the rel-atives of users20.
The current study should be viewed with a certain degree of caution. Because this was a cross-sectional study, it was not possible to know the direction of the association of worse or better quality of life with the use of psychoactive
sub-stances. The study data can not be generalized to the entire population since it was mad specifical-ly for Brazilian individuals aged between 18 and 60 years by telephone. Answered the question-naire more women family and men users of low-income. All measures of the questionnaire were based on self reports and the veracity of the re-sponses of individuals can not be controlled. The influence of psychiatric comorbidity on quality of life was also not assessed because this infor-mation was not included among the variables studied. In addition, the WHOQOL-BREF is not a questionnaire specifically used to measure the quality of life of psychoactive substance users, despite being the most commonly used
question-naire with this population3. Finally, for the
WHO-QOL-BREF, the impact of the telephone-admin-istered mode has not been validated by other modes of administration, even though the tele-phone interviews for other HRQL measures were reported to be comparable to personal interviews
and self administration28,29.
Quality of life has been recognized as an im-portant outcome measurement in treatment stud-ies, assessments of health services, studies of the adverse effects of treatment, and studies of the
impact of disease processes over time15,30. Within
the context of drug use, considering that addic-tion is a chronic disease and that its treatment
requires long-term monitoring31, quality of life
can be an excellent measure because it adds the encouragement of improve the satisfaction with
the life to the clinical focus of treatment32.
Quality of life is a very complex concept that involves many aspects, such as attitudes, behav-ioral habits, relationships, understanding of life, and self-expression. It is developed throughout life beginning in childhood, and therefore, it is likely that a low quality of life encourages the use of drugs, which can lead to the idea of using
psy-chotropic drugs to self-medicate4. Quality of life
S
aú
d
e C
o
le
tiv
a, 1
8
(7
):1
9
5
3
-1
9
6
2
, 2
0
1
3
Contributors
TC Moreira designed the study and wrote the protocol. TC Moreira, LR Figueiró, S Fernandes and M Ferigolo conducted literature searches and provided summaries of previous research stud-ies. TC Moreira and HMT Barros conducted the statistical analysis. TC Moreira, LR Figueiró, S Fernandes, IR Dias, FM Justo, HMT Barros and M Ferigolo wrote the first draft of the manu-script and all authors contributed to and have approved the final manuscript.
Acknowledgments
The authors thank the Coordination for Higher Education Personnel - CAPES (research fellow-ship at the doctoral level, TCM), CNPq (pro-ductivity scholarship 1C - HMTB). Collabora-tion of the NaCollabora-tional Secretariat Drug Policy – SENAD and consultants.
References
Fleck MPA, Lou zada S, Xavier M, Chacham ovich E, Vieira G, San tos L, Pin zon V. Aplicação da ver-são em p or t u gu ês d o in st r u m en t o abr eviad o d e avaliação da qu alidade de vida “WH O QOL-bref ”.
Rev Saude Publica 2000; 34(2):178-183.
Zu llig KJ, Valois RF, H u ebn er ES, O elt m an n JE, Drane JW. Relationship between Perceived Life
Sat-isfaction and Adolescents’ Substance Abuse. J
Ado-lesc Health 2001; 29(4):279-288.
Zubaran C, Foresti K. Quality of life and substance
u se: con cep t s an d r ecen t t en d en cies. Curr Opin
Psychiatry 2009; 22(3):281-286.
Ven tegod t S, Mer r ick J. Psych o act ive Dr u gs an d
QOL. Sci World J 2003; 3:694-706.
Castro MG, Oliveir a MS, Moraes JFD, Miguel AC, Araújo RB. Quality of life and severity of tobacco
dependence. Revista de Psiquiatria Clínica 2007; 34(2):
61-67.
Silva Lim a AFB, Fleck M, Pecch an sky F, Bon i R, Sukop P. Psychometric properties of the world health organization quality of life instrument (WHOQOL-Bref) in alcoholic males: a pilot study... Qual Life Res 2005; 14(2):473-478.
Lozano OM, Dom ingo-Salvany A, Martinez-Alon-so M, Brugal MT, AlonMartinez-Alon-so J, La Fuente L, ITINERE Investigators. Health-related quality of life in young cocaine users and associated factors... Qual Life Res 2008; 17(7):977-985.
Chen K, Scheier LM, Kandel DB. Effects of chronic cocaine use on physical health: A prospective study
in a gen eral population sam ple. Drug Alcohol
De-pend 1996; 43(1-2):23-37.
Paskulin L, Vianna L, Molzahn AE. Factors
associ-ated with quality of life of Brazilian older adults. Int
Nurs Rev 2009; 56(1):109-115.
Kirchengast S, H aslinger B. Gender Differences in Health-Related Quality of Life Among Healthy Aged and Old-Aged Austrians: Cross-Sectional Analysis.
Gend Med 2008; 5(3):270-278.
Barger SD, Donoho CJ, Waym ent H A. The relative contributions of race/ethnicity, socioeconom ic sta-tus, health, and social relationships to life
satisfac-tion in the United States. Qual Life Res 2009; 18(2):
179-189.
Bar ros H MT, Santos V, Mazoni CG, Dantas DCM, Ferigolo M. Neuroscience education for health pro-fession al un dergraduates in a call-cen ter for drug ab u se p r even t io n . Dru g A lcohol Depen d 2008; 98(3):270-274.
Sou za MF, Koh lr au sch ER, Mazon i CG, Moreir a TC, Fernandes S, Dantas DCM, Ferigolo M, Barros HMT. Perfil dos usuár ios do serviço de
teleatendi-m en to sobre drogas d e abuso VIVAVOZ. Rev
Psi-quiatria do Rio Grande do Sul 2008; 30(3):182-191.
Fern an des S, Ferigolo M, Ben chaya MC, Moreira TC, Pierozan PS, Mazon i CG, Bar ros H MT. Br ief motivational intervention and telemedicine: A new
perspective of treatment to marijuana users. Addict
Behav 2010; 35(8):750-755.
Globe D, Hays R, Cun n in gham W. Association s of clinical parameter with health-related quality of life
in hospitalized persons with HIV disease. AIDS Care
1999; 11(1):71-86. 1.
2.
3.
4.
5.
6.
7.
8.
9.
10.
11.
12.
13.
14.
M
o
Substan ce Abuse an d Men tal H ealth Services Ad-m inistration (SAMH SA). [Internet]. Office of
Ap-plied Studies: 1998. N ational Household Survey on
Drug Abuse. U.S. Departm en t of H ealth an d H u
-m an Services~ 1999. [acessado 2011 -m ar 25]. Dis-p o n ível em : h t t Dis-p :/ / www.o as.sam h sa.go v/ n sd u h / 2k7nsduh/2k7results.cfm
Organ ização Mu n dial da Saú de ( WH O) . Divisão
de saúde m ental grupo WHOQOL. Versão em
por-tuguês dos instrumentos de avaliação de qualidade de vida (W HOQOL); 1998. [acessado 2011 fev 24].
Dis-p on ível em : h ttDis-p :/ / www.u fr gs.br / Dis-p siq/ wh oqol86. html
Moreira TC, Figu eiró LR, Ferigolo M, Fern an des S, Larré MC, Barros HMT. Quality of Life of Smok-ers Seeking Help to Quit Through Telephone
Coun-seling. Revista Brasileira de Cancerologia 2011; 57(3):
329-335.
D o m in go - Salvan y A, Br u gal M T, Bar r io G, Gon zález-Saiz F, Bravo MJ, La Fuente L, ITINERE In vestigators. Gen der differen ces in health related
quality of life of youn g heroin users. Health Qual
Life Outcomes 2010; 8:145.
Aragão ATM, Milagres E, Figlie NB. Qualidade de vida e desesperan ça em fam iliares de depen den tes químicos. Psico-USF 2009; 14(1):117-123. Gon çalves DM, Kapczin ski F. Tran storn o m en tal, in dicadores dem ográficos e satisfação com a vida.
Rev Saude Publica 2008; 42(6):1060-1066.
Astals M, Dom ingo-Salvany A, Castillo-Buenaven-tura C, Tato J, Vazquez JM, Mar tin-Santos R, Tor-rens M. Im pact of substance dependence and dual diagnosis on the quality of life of heroin users
seek-ing treatment. Subst Use Misuse 2008; 43(5):612-632.
Pu igdo ller s E, D o m in go - Salvan y A, Br u gal M T, Torrens M, Alvaros J, Castillo C, Magri N, Mar tín S, Vázqu ez JM. Ch aracteristics of h eroin addicts entering m ethadone m aintenance treatm ent:
qual-ity of life and gender. Subst Use Misuse 2004; 39(9):
1353-1368.
Kluthcovsky ACGC, Takayanagui AMM, Santos CB, Klu t h covsky FA. Avaliação d a qu alid ad e d e vid a geral de agen tes com un itários de saúde: a con tri-bu ição relativa das variáveis sociodem ográficas e
dos domínios da qualidade de vida. Rev Psiquiatria
do Rio Grande do Sul 2007; 29(2):176-183.
16.
17.
18.
19.
20.
21.
22.
23.
24.
Don ovan D, Mattson ME, Cisler RA, Lon gabaugh R, Zweben A. Quality of life as an outcom e m
ea-sure in alcoholism treatment research. J Stud
Alco-hol 2005; (15):119-139.
Bellido-Casado J, Martin -Escudero J, Duen as-Lai-ta A, Men a-Mar tin FJ, Arzua-Mouronte D, Sim al-Blan co F. The SF-36 Question n aire as a m easu re-ment of health-related quality of life: assessing short-an d m ediu m -term effects of exposu re to tobacco
versu s the kn own lon g-term effects. Eur J Intern
Med 2004; 15(8):511-517.
Tem pier R, Boyer R, Lam bert J, Mosier K, Duncan CR. Psychological distress am on g fem ales spouses
of male at risk drinkers. . . Alcohol 2006; 40(1):41-49.
Leidy NK, Elixhauser A, Rentz AM, Beach R, Pel-lock J, Schachter S, William MK. Telephone valida-tion of the Quality of Life in Epilepsy Inventory- 89
(QOLIE-89). Epilepsia 1999; 40(1):97-106.
Revicki DA., To h en M, Gyu lai L, Th om p so n C, Pike S, Davis-Vogel A, Zar ate C. Telephon e versus person clinical and health status assessm ent
in-terviews in patients with bipolar disorder. Harvard
Rev. Psychiat 1997; 5(2):75-81.
Wong JG, Cheung EP, Chen EY, Chan CW, Lo MS, Leung KF, Lam CL. An instrument to assess mental patients’ capacity to appraise and report subjective
quality of life. . . Qual Life Res 2005; 14(3):687-694.
Lasalvia A, Bonetto C, Malchiodi F, Salvi G, Par a-biaghi A, Tansella M, Ruggieri M. Listening to pa-tients’ needs to im prove their subjective quality of
life. Psychol Med 2005; 35(11):1655-1665.
Ruggeri M, Gater R, Bisoffi G, Barbui C, Tan sella M. Determinants of subjective quality of life in pa-tien ts atten din g com m u n ity-based m en tal h ealth
services. The South-Verona Outcome Project 5. Acta
Psychiatrica Scandinavica 2002; 105(2):131-140.
Artigo apresentado em 12/03/2012 Aprovado em 28/04/2012
Versão final apresentada em 17/05/2012 25.
26.
27.
28.
29.
30.
31.