Renata Furlan ViebigI Maria Pastor-ValeroII Marcia ScazufcaIII,IV Paulo Rossi MenezesI
I Departamento de Medicina Preventiva. Faculdade de Medicina (FM). Universidade de São Paulo (USP). São Paulo, SP, Brasil II Departamento de Saúde Pública da
Facultad de Medicina. Universidade Miguel Hernández. Alicante, España
III Departamento de Psiquiatria. FM-USP. São Paulo, SP, Brasil
IV Centro de Estudos do Hospital João Evangelista. São Paulo, SP, Brasil Correspondence:
Renata Furlan Viebig
R. Dr. Eudoro Lemos de Oliveira, 117 02022-030 São Paulo, SP, Brasil E-mail: [email protected] Received: 4/7/2008
Fruit and vegetable intake
among low income elderly
in the city of São Paulo,
Southeastern Brazil
ABSTRACT
OBJECTIVE: To estimate the socioeconomic and sociodemographic factors
associated with the daily intake of ive servings of fruit and vegetables by elderly individuals living in low income areas, identifying the main fruits and vegetables which compose the diet of this population.
METHODS: This is a cross-sectional population-based study with 2,066
low income elderly individuals (≥60 years) living in the city of São Paulo, Southeastern Brazil, in 2003-2005. To assess the fruit and vegetable intake a Food Frequency Questionnaire was administered. The answers were
transformed into daily intake and compared with the recommendations of the
World Health Organization (ive or more servings per day). The relationship between recommended fruit and vegetable intake and socioeconomic variables was analyzed using logistic regression models.
RESULTS: Of the participants, 60.5% were women and 39.5% were men.
Approximately one third of the elders (n=723; 35.0%) did not consume any kind of fruit or vegetable on a daily basis and 19.8% reported a daily intake of ive or more servings of fruits and vegetables. This intake was positively associated with income and years of schooling.
CONCLUSIONS: The fruit and vegetable intake of low income elderly
individuals in the city of São Paulo was insufficient according to the recommendations of the World Health Organization and is associated with unfavorable socioeconomic conditions.
DESCRIPTORS: Elderly Feeding Behavior. Socioeconomic Factors. Fruit
and vegetable intake.
INTRODUCTION
The fast ageing of the Brazilian population indicates the current igure of approxi
-mately 15 million elderly individuals.a It is estimated that in 20 years, this igure will more than double, placing Brazil among the ive oldest populations in the world.1,11,12 This population ageing will result in an increase in the prevalence of
non-communicable chronic diseases, which affect predominantly the elderly.1
In 2004 the World Health Organization (WHO)b proposed recommendations
based on lifestyle changes aiming to prevent and minimize the worldwide
a Instituto Brasileiro de Geografia e Estatística. Censo 2000: Brasil. Brasília; 2000 [cited 2007 Jan 01]. Available from: http://www.ibge.gov.br/censo2000
prevalence of non-communicable chronic diseases.
One of its main recommendations was the daily intake
of ive or more servings of fruits and vegetables. The increased intake of these foods would play an important role in reducing the risk for the main chronic diseases, especially due to the greater offer of vitamins, antioxi
-dant minerals, and dietary ibers.3,20
Fruit and vegetable intake is partly determined by the socioeconomic conditions of the population. In two recent studies, low family income7 proved to be
independently associated with inadequate dietary practices, especially with low daily intake of fruits and vegetables.9,12 Other factors have also been associated
with the Brazilian elderly individuals’ low fruit and vegetable intake, such as: low schooling, inappetence, dificulties in acquiring and preparing the food and presence of chronic diseases.2,6
Few Brazilian studies have investigated the dietary patterns of elderly individuals, and research focusing on fruit and vegetable intake is even scarcer. A population-based study which used a food frequency questionnaire with 283 elderly people from three regions of the municipality of São Paulo showed that the fruit and vegetable intake increased as the socioeconomic level of the regions increased.14 However, the study did not
examine the proportion of elderly individuals who met the recommendations of ive daily servings of fruits and vegetables. In a Brazilian inquiry that evaluated a national probabilistic sample of more than 5,000 men and women aged 18 years or older, it was found that among the individuals aged 65 or older, only 20.6% of the women and 14.8% of the men consumed ive or more servings of fruits and vegetables per day.9
Nevertheless, such information was obtained only in relation to the frequency of the intake, and it was not possible to identify which fruits and vegetables were more or less consumed.8
The present study aimed to estimate the socioeconomic
and sociodemographic factors associated with the intake
of ive servings of fruits and vegetables, recommended by WHO, by elderly people living in low income areas, identifying the main fruits and vegetables that compose the diet of this population.
METHODS
The present study is part of the population-based
epidemiological cohort “São Paulo Ageing and Health
study” (SPAH),15-17 whichstudied the factors associated
with the prevalence and incidence of dementia and other mental disorders in low income elderly of the muni
-cipality of São Paulo between 2003-2005. In the irst phase of SPAH, a cross-sectional study was conducted
a World Health Organization. Global Strategy on diet, physical activity and health. Fifty-seventh world health assembly. Geneva; 2004[cited 2007 Nov 01]. Available from: http://www.who.int/dietphysicalactivity/en/
with elderly individuals living in low income areas of the western region of the municipality of São Paulo.15
All individuals aged 65 years or older who lived in the districts of Butantã, Rio Pequeno and Raposo Tavares were eligible. These districts included the poorest census tracts, with slums and/or areas covered by the Programa Saúde da Família (Family Health
Program), representing the regions with the lowest Human Development Index (HDI) of the study’s area. The elderly were interviewed and evaluated at their homes, preferably in one single visit.9 Between the
years 2003-2005, 2,072 participants were included, and 2,066 answered the food frequency questionnaire about fruit and vegetable intake, constituting the sample of the present study.
Standardized questionnaires were administered by a team of eight interviewers who were trained to obtain information on sociodemographic, socioeconomic characteristics and on fruit and vegetable intake.15-17 For
89 elderly individuals who presented serious physical or mental disability, close informants answered the interview. Details on the evaluation of physical or mental disability were already published.15
To assess the fruit and vegetable intake, the corres
-ponding section of a Food Frequency Questionnaire (FFQ) was used. This semi-quantitative questionnaire was developed to obtain information on the diet of the general adult population residing in the Metropolitan Region of São Paulo.7
In the FFQ there are nine possible consumption responses for each food item in the list: never or less than once a month, one to three times a month, once a week, two to four times a week, ive to six times a week, once a day, one to three times a day, four to ive times a day, and six or more times a day. These cate
-gories of responses are based on standardized servings for each food item in the list. For example, the standard serving for bananas is one unit; if the participant reports that he consumed an average of three bananas per day, he will be classiied in the category “one to three times a day”. In the present study, we administered the part of the FFQ that represented the groups of “vegetables”, with ten items, and “fruits and natural juices”, with 17 food items.
To calculate how many elderly individuals met the
fruits, vegetables, and fruits and vegetables (combined) per individual were obtained. Therefore, the total daily fruit and vegetable intake resulted in a continuous variable, equivalent to the total number of daily servings of fruits and vegetables (combined) consumed by the elderly. This inal continuous variable was categorized as: “non-daily fruit and vegetable intake”, “daily fruit and vegetable intake”, and “recommended fruit and vegetable intake” (ive or more servings/day). The statistical analyses were carried out with the software Stata 9.0. First, the socioeconomic and demo
-graphic characteristics were analyzed in a descriptive way, using measures of central tendency and percentage distribution. The analyzed characteristics included sex, age group (65-69, 70-74, 75-79, 80 years of age or older), years of residence in the city of São Paulo, schooling (literacy and years at school) and per capita monthly income (in minimum salaries at the time of the study). The intensity of the associations between socioe -conomic and sociodemographic characteristics and
adequate daily fruit and vegetable intake was esti
-mated by odds ratios (OR), with their respective 95% conidence intervals using logistic regression models adjusted for age and sex. Statistical signiicance was evaluated through Wald tests and for ordered catego
-rical variables the test for linear trend was used. Then, multivariate logistic regression models were used to identify the independent associations. Thus, if one or more variables were associated with p> 0.15, the one that had the highest p value was removed from the model. A new model was estimated and the signiicance of the variables was examined again. This iterative process continued until only the variables with a value of p< 0.15 remained in the model. The effect of poten
-tial confounding variables was examined by including each variable sequentially into the multivariate logistic regression models and observing if the estimated ORs varied by more than 10%.13
The study was approved by the Ethics Committee for the Analysis of Research Projects of the Board of Clinical Directors of the Hospital das Clínicas da Faculdade de Medicina da USP (Clinical Hospital of
the School of Medicine of USP) (Process no. 0361/07). The participants signed a consent document and the consent of the participants with cognitive deicit was provided by the informants.
RESULTS
Table 1 presents the participants’ sociodemographic characteristics. Out of 2,066 participants, the majority (1,250; 60.5%) were women, and 370 (45.3%) men
and 518 (41.4%) women were in the age group 65 – 69. Only 97 (11.9%) men and 99 (7.9%) women had more than four years of schooling. Median per capita monthly income was R$ 346.67 and 8% reported not having any individual source of income. Four hundred and ifty two (55.4%) men and 585 (47.2%) women had been living in São Paulo for at least 40 years.
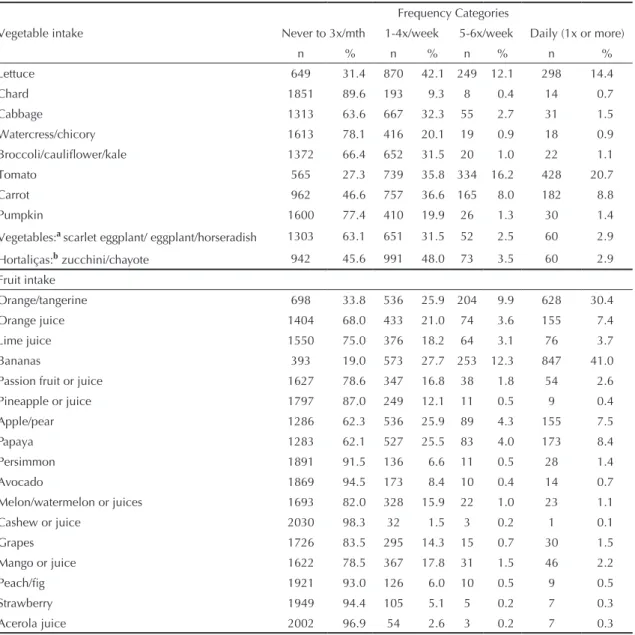
Table 2 shows the consumption of different fruits and vegetables according to the response categories of the FFQ.
The most consumed vegetables by the elderly on a daily basis were tomato (21.0%), lettuce (14.4%) and carrot (8.8%). The other vegetables were daily consumed only by 2% of the studied population. The most consumed fruits were banana (41.0%), orange and tangerine (30.4%). Apple, pear, papaya and orange juice were consumed by 8% of the participants. The other fruits were daily consumed by 3.7% of the participants (Table 2). High proportions of the elderly reported that they never consumed vegetables like: chard (89.6%); water
-cress (78.1%); pumpkin (77.5%); broccoli/caulilower (66.4%); and cabbage (63.5%). In the case of fruits, of the 17 items contained in the FFQ, 11 were never consumed by more than 75% of the elderly: cashew (98.0%); acerola (96.9%); avocado (94.5%); strawberry (94.4%); peach/ig (93.0%); pineapple (87.0%); grapes (83.5%); and melon/watermelon (82.0%). Signiicant differences were found between sexes, with greater consumption by women, in relation to the intake of the following items: lettuce (p<0.001), orange/tangerine (p<0.001), vegeta
-bles in general (p<0.001), carrot (p<0.001), apple/pear (p=0.03), garlic and onion (p=0.005).
The elderly who reported consuming ive or more daily servings of fruits and vegetables were 19.8% (CI 95%: 18.1; 21.5). Another 45.2% presented daily fruit and vegetable intake but they did not reach the recommendations, and 35% did not consume fruits and vegetables on a daily basis. The eight most consumed fruits and vegetables were: tomato, lettuce, carrot, banana, orange/tangerine, apple/pear (Table 2), and they represented 82% of the fruit and vegetable intake
of the participants who met the daily recommendations
of the WHO.a
Table 3 shows the crude and adjusted associations between the socioeconomic and sociodemographic variables and the recommended fruit and vegetable intake. In the multivariate analysis, the recommended fruit and vegetable intake was independently associated with level of schooling and per capita income. The recommended fruit and vegetable intake increased signiicantly according to years of schooling. The asso
a World Health Organization. Global Strategy on diet, physical activity and health. Fifty-seventh world health assembly. Geneva; 2004[cited 2007 Nov 01]. Available from: http://www.who.int/dietphysicalactivity/en/
intake and participants’ income was also statistically signiicant, although with no clear linear trend.
DISCUSSION
In the present study, one fifth of the participants achieved the WHOa recommendations regarding daily servings of fruits and vegetables, while 35% did not consume any type of fruit or vegetable daily. The fruit and vegetable intake increased signiicantly as the level of schooling and per capita income increased. However, although there is a great offer and diversity of fruits and vegetables in Brazil, we found a limited variability of consumption among the people who reached the WHO recommendations.
Studies conducted in Brazil have shown that sex, purchasing power and schooling/information are deter
-minant for a balanced diet in these populations.2,6,9,10,14
Jaime & Monteiro9 (2005) investigated the fruit and
vegetable intake in a national probabilistic sample composed of 5,000 individuals, including elderly people. These authors used short questions to obtain
information on the intake of these food items and their
results were similar to the ones of the present study,
with 20.6% of the women meeting the WHO recom
-mendations, but only 14.8% of the men.9 The elderly
were the ones who most consumed fruits and vegetables
according to the WHO recommendations and a clear
positive association was observed between the level of schooling and fruit and vegetable intake.9 A recent
study with a sample of adults from the municipality of São Paulo, which examined fruit and vegetable intake using short questions in telephone interviews, showed a signiicant association between level of schooling and intake of these food items for both sexes. 6
In the present study, inadequate fruit and vegetable intake was strongly associated with the elderly indivi
-duals’ low level of schooling and low income ranges.
According to Jaime et al8 (2007), the estimates are that
the fruit and vegetable intake in Brazil corresponds to less than half of the nutritional recommendations, mainly in low income families. A study carried out with data
from Pesquisa de Orçamento Familiar (POF – Family
Budget Research) of Fundação Instituto de Pesquisas Econômicas of Universidade de São Paulo in 1998/1999
about the acquisitions of food and beverages for family consumption during one month showed that the parti
-cipation of fruits and vegetables in the overall amount Table 1. Sociodemographic and socioeconomic characteristics of the sample according to sex. Municipality of São Paulo, Southeastern Brazil, 2003-2005. (N=2,066)
Variable Men (816) Women (1.250) Total (2.066)
n (%) n (%) n (%)
Age (years)
65-69 370 (45.3) 518 (41.4) 888 (42.9)
70-74 217 (26.6) 338 (27.0) 555 (26.8)
75-79 126 (15.4) 219 (17.5) 345 (16.7)
80 or more 104 (12.7) 174 (14.1) 280 (13.5)
Schooling (years at school)
0 266 (32.6) 523 (41.9) 789 (38.2)
1-3 453 (55.5) 628 (50.2) 1081 (52.3)
4 or more 97 (11.9) 99 (7.9) 196 (9.5)
Per capita monthly income (in reais)
Up to R$240.00 167 (20.5) 473 (37.9) 640 (31.0)
R$241.00 – R$480.00 113 (13.8) 288 (23.0) 401 (19.4)
R$481.00 – R$720.00 229 (28.1) 285 (22.8) 514 (24.9)
Above R$721.00 307 (37.6) 204 (16.3) 511 (24.7)
Years of residence in São Paulo (years)
Up to 20 85 (10.4) 172 (13.8) 257 (12.4)
20├ 40 239 (29.3) 433 (34.6) 672 (32.5)
40├ 60 376 (46.1) 447 (35.8) 823 (39.8)
60 or more 76 (9.3) 138 (11.4) 214 (10.4)
Does not remember 1 (0.1) 10 (0.8) 11 (0.5)
a Instituto Brasileiro de Geografia e Estatística. Pesquisa de orçamentos familiares 2002-2003: análise da disponibilidade domiciliar de alimentos e estado nutricional no Brasil. Rio de Janeiro; 2004.
purchase of vegetables.10 Low level of schooling can
also inluence consumption and the small variability of fruits and vegetables, due to the adoption of inadequate dietary habits and due to the higher frequency of age-related problems (locomotion dificulties, chewing and swallowing problems, diseases such as depression and dementia).2,4,14,16 The effect of low level of schooling
could explain, at least in part, the small variability in fruit intake observed here. We found that among the least consumed fruits were those whose cost is high in the state of São Paulo,b like strawberry, ig, peach and
of calories increases as the family income increases and
the price of the fruits and vegetables decreases.4
The analysis of data about the acquisition of food items obtained from POF 2002/2003a showed that the families with monthly income up to R$ 400.00 allocated only 3.6% of the expenditures on food for the acquisition of fruits and 3.3% for the acquisition of vegetables.10 On
the other hand, the families with monthly income higher than R$ 4,000.00 allocated 23.5% of the expenditures on food for the acquisition of fruits and 12.7% for the
Table 2. Frequency of fruit and vegetable intake of the sample. Municipality of São Paulo, Southeastern Brazil, 2003-2005. (N=2,066)
Vegetable intake
Frequency Categories
Never to 3x/mth 1-4x/week 5-6x/week Daily (1x or more)
n % n % n % n %
Lettuce 649 31.4 870 42.1 249 12.1 298 14.4
Chard 1851 89.6 193 9.3 8 0.4 14 0.7
Cabbage 1313 63.6 667 32.3 55 2.7 31 1.5
Watercress/chicory 1613 78.1 416 20.1 19 0.9 18 0.9
Broccoli/cauliflower/kale 1372 66.4 652 31.5 20 1.0 22 1.1
Tomato 565 27.3 739 35.8 334 16.2 428 20.7
Carrot 962 46.6 757 36.6 165 8.0 182 8.8
Pumpkin 1600 77.4 410 19.9 26 1.3 30 1.4
Vegetables:a scarlet eggplant/ eggplant/horseradish 1303 63.1 651 31.5 52 2.5 60 2.9
Hortaliças:b zucchini/chayote 942 45.6 991 48.0 73 3.5 60 2.9
Fruit intake
Orange/tangerine 698 33.8 536 25.9 204 9.9 628 30.4
Orange juice 1404 68.0 433 21.0 74 3.6 155 7.4
Lime juice 1550 75.0 376 18.2 64 3.1 76 3.7
Bananas 393 19.0 573 27.7 253 12.3 847 41.0
Passion fruit or juice 1627 78.6 347 16.8 38 1.8 54 2.6
Pineapple or juice 1797 87.0 249 12.1 11 0.5 9 0.4
Apple/pear 1286 62.3 536 25.9 89 4.3 155 7.5
Papaya 1283 62.1 527 25.5 83 4.0 173 8.4
Persimmon 1891 91.5 136 6.6 11 0.5 28 1.4
Avocado 1869 94.5 173 8.4 10 0.4 14 0.7
Melon/watermelon or juices 1693 82.0 328 15.9 22 1.0 23 1.1
Cashew or juice 2030 98.3 32 1.5 3 0.2 1 0.1
Grapes 1726 83.5 295 14.3 15 0.7 30 1.5
Mango or juice 1622 78.5 367 17.8 31 1.5 46 2.2
Peach/fig 1921 93.0 126 6.0 10 0.5 9 0.5
Strawberry 1949 94.4 105 5.1 5 0.2 7 0.3
Acerola juice 2002 96.9 54 2.6 3 0.2 7 0.3
grapes. However, some fruits with lower cost, such as lime, avocado, watermelon and melon, were little consumed by the elderly. In the case of vegetables, we observed a similar pattern, with some vegetables whose cost is low and which can be easily purchased, like cabbage, chayote, cucumber and chard, being little consumed by the study’s participants.
Measuring fruit and vegetable intake in populations is not a simple task and there is no consensus in the lite
-rature concerning the best method to do it. 5,7,13,18-20 Our
study used FFQ to assess the fruit and vegetable intake and the results were consistent with those obtained by Brazilian investigations that used short questions.6,9
Therefore, we believe that the use of the FFQ in the present work did not inluence the assessment of the level of fruit and vegetable intake and allowed a more accurate identiication of the consumed food items. A positive aspect of the present study is the fact that, for the 89 participants who could not answer the question
-naires due to serious mental disability, the information
on fruit and vegetable intake was provided by their
informants, increasing the sample’s representativeness
regarding the participants’ health condition.
The results of the present work should be generalized with some caution to other populations of elderly people in Brazil, as there are areas where the access to
this kind of food is more restricted and the per capita
income is lower. Nevertheless, we believe that elderly individuals in other low income areas of other urban centers in Brazil do not present a better situation than the one observed here in relation to daily fruit and vegetable intake.
To conclude, the fruit and vegetable intake by low income elderly individuals was well below the current WHO recommendations.a This inadequacy was asso -ciated with unfavorable socioeconomic conditions, low level of schooling and low purchasing power, even in a relatively homogeneous population group. The most consumed fruits and vegetables on a daily basis are in accordance with the most consumed food items by the
a World Health Organization. Global Strategy on diet, physical activity and health. Fifty-seventh world health assembly. Geneva; 2004[cited 2007 Nov 01]. Available from: http://www.who.int/dietphysicalactivity/en/
Table 3. Crude and adjusted analyses of the associations between recommended fruit and vegetable intake (≥ 5 daily servings) and socioeconomic and sociodemographic variables. Municipality of São Paulo, Southeastern Brazil, 2003-2005. (N=2.066)
Variable Fruit and vegetable intake
Crude OR (CI 95%) Adjusted OR (CI 95%) p Sex
Female 1 1 0.41a
Male 0.99 (0.80;1.24) 0.95 (0.72;1.15)
Age (years)
65-69 1 1 0.88b
70-74 0.93 (0.72;1.22) 0,97 (0.74;1.29)
75-79 0.94 (0.69;1.30) 1.09 (0.78;1.51)
80 or more 1.07 (0.77; 1.49) 1.19 (0.82;1.74)
Level of schooling (years at school)
0 1 1 <0,001b
1 - 3 1.48 (1.15;1.89) 1.40 (0.89; 1.59)
4 or more 3.26 (2.30; 4.64) 2.99 (2.02;4.40)
Per capita monthly income (in reais/minimum salaries)
Up to 240.00 1 1 <0.001b
241.00 – 480.00 1.53 (1.16;2.00) 1.38 (1.04;1.84)
481.00 – 720.00 1.61 (1.04;2.50) 1.46 (0.93;2.29)
≥721.00 1.58 (1.01;2.47) 1.23 (0.77;1.97)
Years of residence in São Paulo
up to 20 1 1 0.17b
20├ 40 1.25 (0.84;1.86) 1.20 (0.80;1.79)
40├ 60 1.63 (1.11; 2.39) 1.38 (0.93;2.05)
60 or more 1.71 (1.07;2.73) 1.28 (0.79;2.09)
aTest for linear trend
population of the state of São Paulo, but the variety in the consumption of these food items is limited. Public policies and health promotion programs must incorpo
-rate forms of increasing the consumption of these food items by the elderly population in Brazil.
ACKNOWLEDGMENTS
To the research assistants of the São Paulo Ageing and Health Study for the ieldwork and preparation of the databases.
1. Barreto SM, Pinheiro ARO, Sichieri R, Monteiro CA, Batista Filho M, Schimidt MI, et al. Estratégia global para alimentação atividade física e saúde da organização mundial da saúde. Epidemiol Serv Saude. 2005;14(1):44-68.
2. Campos MTFS, Monteiro JBR, Ornelas APRC. Fatores que afetam o consumo alimentar e a nutrição do idoso. Rev Nutr. 2000;13(3):157-65. DOI: 10.1590/ S1415-52732000000300002
3. Cerqueira FM, Medeiros MHG, Augusto O.
Antioxidantes dietéticos: controvérsias e perspectivas. Quim Nova. 2007;30(2)441-9. DOI: 10.1590/S0100-40422007000200036
4. Claro RM, Carmo HCE, Machado FMS, Monteiro CA. Renda, preço dos alimentos e participação de frutas e hortaliças na dieta. Rev Saude Publica. 2007;41(4):557-64. DOI: 10.1590/S0034-89102007000400009
5. Coyne T, Ibiebele TI, McNaughton S, Rutishauser IH, O’Dea K, Hodge AM, et al. Evaluation of brief dietary questions to estimate vegetable and fruit consumption – using serum carotenoids and red-cell folate. Public Health Nutr. 2004;8(3):298-308.
6. Figueiredo ICR, Jaime PC, Monteiro CA. Fatores associados ao consumo de frutas, legumes e verduras em adultos da cidade de São Paulo. Rev Saude Publica. 2008;42(5):777-85. DOI: 10.1590/S0034-89102008005000049
7. Furlan-Viebig R, Pastor-Valero M. Desenvolvimento de um questionário de freqüência alimentar para o estudo de dieta e doenças não transmissíveis. Rev Saude Publica. 2004;38(4):581-4. DOI: 10.1590/S0034-89102004000400016
8. Jaime PC, Machado FMS, Westphal MF, Monteiro CA. Nutritional education and fruit and vegetable intake: a randomized community trial. Rev Saude Publica. 2007; 41(1):154-7. DOI: 10.1590/S0034-89102007000100021
9. Jaime PC, Monteiro CA. Fruit and vegetable intake by Brazilian adults, 2003. Cad Saude Publica. 2005;21(1):19-24. DOI: 10.1590/S0102-311X2005000700003
10. Levy-Costa RB, Sichieri R, Pontes NS, Monteiro CA. Disponibilidade domiciliar de alimentos no Brasil: distribuição e evolução (1974-2003). Rev Saude Publica. 2005;39(4):530-40. DOI: 10.1590/S0034-89102005000400003
11. Lima-Costa MF, Veras R. Saúde pública e envelhecimento [editorial]. Cad Saude Publica. 2003;19(3):700-1. DOI: 10.1590/S0102-311X2003000300001
12. Lotufo PA. Brazil is getting older: some lessons from the Bambuí Health and Aging Study. Sao Paulo Med J. 2004;122(3):79-80. DOI: 10.1590/S1516-31802004000300001
13. Michels KB, Welsh AA, Luben R, Bingham SA, Day NE. Measurement of fruit and vegetable consumption with diet questionnaires and implications for analyses and interpretation. Am J Epidemiol. 2005;161(10):987-994. DOI: 10.1093/aje/kwi115
14. Najas MS, Andreazza R, Souza ALM, Sachs A, Guedes ACB, Sampaio LR, et al. Padrão alimentar de idosos de diferentes estratos socioeconômicos residentes em localidade urbana da Região Sudeste, Brasil. Rev Saude Publica. 1994;28(3):187-91. DOI: 10.1590/ S0034-89101994000300004
15. Scazufca M, Menezes PR, Vallada HP, Crepaldi AL, Pastor-Valero M, Coutinho LM, et al. High prevalence of dementia among older adults from poor socioeconomic backgrounds in São Paulo, Brazil. Int Psychogeriatr. 2007;20(2):394-405.
16. Scazufca M, Seabra CAF. São Paulo portraits: ageing in a large metropolis. Int J Epidemiol. 2007[citado 2008 fev 01]37(4);721-3. Disponível em: http://ije. oxfordjournals.org/cgi/reprint/dym154v1
17. Scazufca M, Menezes PR, Araya R, Di Rienzo VD, Almeida OP, Gunnell D, et al. Risk factors across the life course and dementia in a Brazilian population: results from the Sao Paulo Ageing & Health Study (SPAH). Int J Epidemiol. 2008;37(4):879-90.
18. Thompson FE, Kipnis V, Subar AF, Krebs-Smith SM, Kahle LL, Midthune D, et al. Evaluation of 2 brief instruments and a food-frequency 22 questionnaire to estimate daily number of servings of fruit and vegetables. Am J Clin Nutr. 2000;71(6):1503-10.
19. Van Duyn MA, Pivonka E. Overview of the health benefits of fruit and vegetable consumption for the dietetics professional: selected literature. J Am Diet Assoc. 2000;100(12):1511-21. DOI: 10.1016/S0002-8223(00)00420-X
20. Willett W. Nutritional epidemiology. 2.ed. New York: Oxford University Press; 1998.
REFERENCES