Correspondence:
Alicia Lorena Núñez Mondaca Diagonal Paraguay 257, office 2004, Santiago Chile E-mail: [email protected]
Received: 2 Sept 2015
Approved: 15 May 2016
How to cite: Mondaca ALN, Chi C. Equity in out-of-pocket payment in Chile. Rev Saude Publica. 2017;51:44.
Copyright: This is an open-access article distributed under the terms of the Creative Commons Attribution License, which permits unrestricted use, distribution, and reproduction in any medium, provided that the original author and source are credited.
http://www.rsp.fsp.usp.br/
Equity in out-of-pocket payment in Chile
Alicia Lorena Núñez MondacaI, Chunhuei ChiIII Department of Management Control and Information Systems. School of Economics and Business. University of Chile. Santiago, Chile
II Center for Global Health. International Health Program. College of Public Health and Human Sciences. Oregon State University. Corvallis, Oregon, United States
ABSTRACT
OBJECTIVE: To assess the distribution of inancial burden in Chile, with a focus on the burden and progressivity of out-of-pocket payment.
METHODS: Based on the principle of ability to pay, we explore factors that contribute to inequities in the health system inance and issues about the burden of out-of-pocket payment, as well as the progressivity and redistributive efect of out-of-pocket payment in Chile. Our analysis is based on data from the 2006 National Survey on Satisfaction and Out-of-Pocket Payments. RESULTS: Results from this study indicate evidence of inequity, in spite of the progressivity of the healthcare system. Our analysis also identiies relevant policy variables such as education, insurance system, and method of payment that should be taken into consideration in the ongoing debates and research in improving the Chilean system.
CONCLUSIONS: In order to reduce the detected disparities among income groups, healthcare priorities should target low-income groups. Furthermore, policies should explore changes in the access to education and its impact on equity.
INTRODUCTION
Inequity in the inancial burden of the healthcare is a major concern worldwide, either in high income or low income countries. To better understand this idea, according to Starield14, equity in health services “implies that there are no diferences in health services where health needs are equal (horizontal equity) or that enhanced health services are provided where greater health needs are present (vertical equity)” (p.546)14. he World Health Organizationa considers as inequity the diferences in health status that are unnecessary, avoidable, unfair, and unjust. herefore, equity can be referred as social justice about the things that a person has as a right21. he main equity objective is to create opportunities to provide equal health for all, afecting, among other things, health outcomes, and utilization of and access to healthcare services23. While issues of equity in health system inance have been well studied in member countries of the Organization for Economic Cooperation and Development (OECD), there are still few published empirical studies on Latin-American healthcare systems, where a wider gap in income and wealth distribution exists within Governments. Even though Chile is now part of the OECD, it has the widest gap between rich and poor among the 34 OECD countries, indicating the higher inancial burden of out-of-pocket (OOP) in healthcare for persons in lower income groups.
he healthcare system in Chile is mixed, both in the inancing and delivery of services. Citizens can choose between public or private health insurance. he National Health Fund (FONASA) is a public organization, which is divided into four levels of income groups (A, B, C, and D) and provides coverage to 72% of the population, without discrimination of age, gender, income level, number of dependents, or pre-existing legal conditionsb. Private health insurances, ISAPRE hereafter, are private institutions that provide services to approximately 16% of the Chilean populationc. hese two systems share a common inancing source: the obligatory contribution of employees, which is a 7% monthly income tax with a limit of 74,3UF (unit of account used in Chile), equivalent to US$2,703.55d,e. Even though most of the Chilean population is covered by a health insurance, reaching efective universal coverage13, there are diferences within and between each type of insurance and the health plans provided depending on income level, i.e., more money means better health care plans. To solve this issue, previous governmental initiatives have attempted to improve equity in the Chilean healthcare system. From 1990 to 2000, two social policies were developed, the irst guaranteeing an adequate level of healthcare services based on an equal opportunity perspective, and the second focused on speciic programs directed to disadvantaged groups to promote access to the opportunities available at that time18. hese social policies, which were aimed at improving equity in healthcare in terms of access and lower inancial burden for the low income family, were successfully implemented achieving the short-term objectives with the proliferation of new programs. However, these policies were unable to address major social issues, such as poverty, which is accompanied by drug consumption, violence, insecurity, and others12. Between 2000 and 2006, the proposed programs were focused on the improvement of social determinants of health. Between 2003 and 2004, a new legal framework of health was approved, known as the Regime of Explicit Health Guarantees, which is a program that brings a legal provision of social guarantees that deines the principles of access, quality, opportunity, and inancial protection.
Based on the healthcare reforms in Chile, previous studies have attempted to better understand the state of health equity in Chile. A study promoted by a governmental initiative and carried out by Jadue and Marín5 has focused on health equity issues with the objective of identifying social determinants of health in Chile. Also, the EQUILAC project, from the Pan American Health Organization, is looking for a systematic assessment of equity in health systems in the Latin American and the Caribbean region, in which we can ind some recent studies about equity in health and healthcare utilization in Chile17. Speciically in health system inance, Cid and Prieto3 have examined the evolution of OOP payment in Chile using the Survey of Family Budgets based on the years 1997 and 2007 for the capital of Chile, Santiago. he main indings are the growth of household spending – more than 39.5% per
a WHO World Health Organization [cited 2017 Mar 9]. Available from: http://www.who.int/bulletin/ volumes/85/2/06-037366/en/ b FONASA Fondo Nacional de Salud. Asegurados. Santiago de Chile; s.d [cited 2009 May 20]. Available from: https:// fonasaweb.fonasa.cl/portal_ fonasa/site/edic/base/port/ asegurados.html
capita – and the gap that persists between the proportion of OOP expenditures and the total
expenditures between the richest and the poorest households. One interesting fact about their study is that it compares the two years before and after the implementation of the Explicit Health Guarantees (former AUGE [Universal Access to Explicit Health Guarantees]) program; however, they show that even though the program has had an efect in the containment of OOP spending, new inancial protection policies are required. Following these lines, another study conducted by Bitrán and Muñoz2 uses the 2006 Satisfaction and Out-of-Pocket Payment Survey to identify health expenses inadequately covered by current insurance plans. he authors have found that almost half of the healthcare expenditures are paid directly by household OOP, being supplies and medications the most important sources of OOP spending, given the existing insurance coverage. his information is supported in the study conducted by Urriola15 about the way the healthcare system is inanced in Chile. he study has shown that the irst income quintile pays 68% of its OOP spending in medications, while the ifth quintile pays 43% of its OOP spending in medications. Bitrán and Muñoz2 have also found that OOP expenditures increase with income.
As shown above, there are very little empirical studies on equity in health inance in Chile. herefore, the purpose of this study is to expand this area of research and assess the distribution of inancial burden in Chile, with a focus on the burden and progressivity of OOP payment, based on the principle of ability-to-pay (ATP). Factors that contribute to inequities in health system inance were explored, along with possible policy variables that may contribute to the more equitable distribution of inancial burden in healthcare.
METHODS
he data for this study were drawn from the 2006 Satisfaction and Out-of-Pocket Payment Survey. his survey uses representative random sample from the national population. here are no new versions of this survey. he sample design is strictly probabilistic, multistage, including geographical stratiication and conglomerates. he sample of the survey involves 4,558 households or 16,519 people.
Using this data, we considered two diferent alternatives to examine inancial equity issues. he starting point involves the use of a two-part model (2PM) to estimate factors associated with inancial burden of healthcare in Chile, allowing us to detect the presence of inequity. his model was selected because of the large number of non-users of health care services, and to allow a better performance of the model avoiding the excess of zeros in the analysis of OOP payment. Moreover, to have a comprehensive understanding of the distribution of inancial burden, we used an additional method of measurement. he second method includes the computation of progressivity indexes, which allowed us to estimate how much higher OOP payments are as a share of the ATP for the poor than for the rich. Both methods complement each other in providing evidence of inequity.
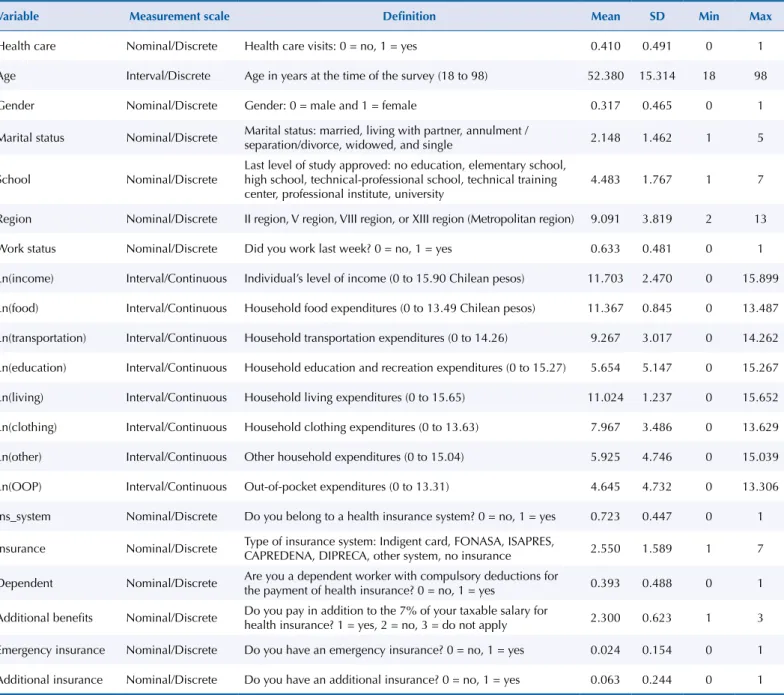
hus, to carry out this study we selected a group of variables from the 2006 Satisfaction and Out-of-Pocket Payment Survey including a dichotomous indicator of whether a person has health care visits during the year of analysis, as well as a set of sociodemographic variables of the participants such as age in years, gender , marital status, education level (ranging from no education, be studying or having a degree ofered by a technical school, up to be studying or having a college degree), the region where the participants live, work status, income, and also household expenditures on food, transportation, education and recreation, housing, clothing, and healthcare. In addition, we have included variables to assess whether the individual has a healthcare insurance or not, and the type of insurance: Indigent card, FONASA (public insurance), ISAPRE (private insurance), CAPREDENA (National Defense Pension Fund), DIPRECA (National Insurance for the Police), other system, or no insurance at all, and inally we also have a variable to assess if the individuals had an additional health insurance. A summary of key variables and exploratory data analysis from the 2006 Survey are presented in Table 1, which describes the measurement scales and descriptive statistics.
As we mentioned before, we have used two diferent methods for the data analysis. he irst is the 2PM, where an individual’s OOP payment for 2006 was the unit of analysis for our
Table 1. Variables selected from the 2006 Satisfaction and Out-of-Pocket Payment Survey. Chile, 2006.
Variable Measurement scale Definition Mean SD Min Max
Health care Nominal/Discrete Health care visits: 0 = no, 1 = yes 0.410 0.491 0 1
Age Interval/Discrete Age in years at the time of the survey (18 to 98) 52.380 15.314 18 98
Gender Nominal/Discrete Gender: 0 = male and 1 = female 0.317 0.465 0 1
Marital status Nominal/Discrete Marital status: married, living with partner, annulment /
separation/divorce, widowed, and single 2.148 1.462 1 5
School Nominal/Discrete
Last level of study approved: no education, elementary school, high school, technical-professional school, technical training center, professional institute, university
4.483 1.767 1 7
Region Nominal/Discrete II region, V region, VIII region, or XIII region (Metropolitan region) 9.091 3.819 2 13
Work status Nominal/Discrete Did you work last week? 0 = no, 1 = yes 0.633 0.481 0 1
Ln(income) Interval/Continuous Individual’s level of income (0 to 15.90 Chilean pesos) 11.703 2.470 0 15.899
Ln(food) Interval/Continuous Household food expenditures (0 to 13.49 Chilean pesos) 11.367 0.845 0 13.487
Ln(transportation) Interval/Continuous Household transportation expenditures (0 to 14.26) 9.267 3.017 0 14.262
Ln(education) Interval/Continuous Household education and recreation expenditures (0 to 15.27) 5.654 5.147 0 15.267
Ln(living) Interval/Continuous Household living expenditures (0 to 15.65) 11.024 1.237 0 15.652
Ln(clothing) Interval/Continuous Household clothing expenditures (0 to 13.63) 7.967 3.486 0 13.629
Ln(other) Interval/Continuous Other household expenditures (0 to 15.04) 5.925 4.746 0 15.039
Ln(OOP) Interval/Continuous Out-of-pocket expenditures (0 to 13.31) 4.645 4.732 0 13.306
Ins_system Nominal/Discrete Do you belong to a health insurance system? 0 = no, 1 = yes 0.723 0.447 0 1
Insurance Nominal/Discrete Type of insurance system: Indigent card, FONASA, ISAPRES,
CAPREDENA, DIPRECA, other system, no insurance 2.550 1.589 1 7
Dependent Nominal/Discrete Are you a dependent worker with compulsory deductions for
the payment of health insurance? 0 = no, 1 = yes 0.393 0.488 0 1
Additional benefits Nominal/Discrete Do you pay in addition to the 7% of your taxable salary for
health insurance? 1 = yes, 2 = no, 3 = do not apply 2.300 0.623 1 3
Emergency insurance Nominal/Discrete Do you have an emergency insurance? 0 = no, 1 = yes 0.024 0.154 0 1
Additional insurance Nominal/Discrete Do you have an additional insurance? 0 = no, 1 = yes 0.063 0.244 0 1
estimation. he OOP payment for healthcare services was expected to sufer a skewed distribution around zero, because of diferences between persons not using medical services (0 payment) and those with expensive medical care. To address this issue, we use a 2PM developed by Manning et al.7,9
he irst part of the model involves the estimation of a logit model that describes the distinction between non-users and users of healthcare services. he dependent variable for the logit model is a binary variable (0 = no use of healthcare, and 1 = use of healthcare [having zero or positive expenses]). he second part consists in estimating an ordinary least-square regression for OOP payment for those with non-zero expenses. For the ordinary least-square regression model, the dependent variable is the natural logarithm of OOP payment and the explanatory variables were age, gender, marital status, education, region, work status, insurance system, additional insurance, and the following expenditures (as a proxy measure for wealth or income): food, transportation, education and recreation, and housing and clothing.
Additionally, a progressivity analysis was carried out to quantify inequalities in healthcare expenditure. It measures the deviation between OOP payment and ATP. As ATP increases, we can state that a system is progressive or regressive if healthcare payments account for, respectively, an increasing or decreasing proportion of ATP24.
The ATP is measured by an approximation of the household consumption net of non-discretionary expenditures. We applied two methods to assess progressivity of OOP payment: (1) the percentage that OOP payment represents for household expenditures organized by quintile, and (2) the use of concentration curves, comparing shares of health payments contributed by proportions of the population ranked by ATP with their share of ATP.
herefore, we compared the concentration curve of healthcare payments with the Lorenz curve for ATP11. Under a progressive system, the share of health payments for the poor is lower than their share for ATP, and the concentration curve would lie above the Lorenz curve. Under a regressive system, the share of health payments for the poor is greater than their share for ATP, and the concentration curve would lie below the Lorenz curve11. he further the concentration curve is from the Lorenz curve, the greater the level of inequity in healthcare payment.
Based on the concentration curve calculation, a concentration index can be estimated, which corresponds to twice the area between the concentration curve and the diagonal. he concentration index can take values between -1 (disproportionate concentration of payment for the poor) and +1 (disproportionate concentration of payment for the rich). A value of 0 means there is no correlation between the share of healthcare payment and ATP22. Kakwani index was also estimated. he index measures twice the area between the Lorenz curve and the concentration curve for health payments. Kakwani progressivity index takes values between -2 to 1. A negative value means that the inancial burden is concentrated in the poorest persons; a positive value indicates the opposite; while perfect equality is found with a value of zero.
We used Stata 11.1 to analyze the data sets for this study. We also used ADePT, a free software developed by the World Bank, to automate and standardize the economic analysis on the equity of inancial burden for this research, which includes progressivity and redistribution of the health system inance. he main purpose of using this software was to allow comparability with future studies.
RESULTS
Two-part Model
To assess the factors that could explain inequity in health system inance, a 2PM using the 2006 Satisfaction and Out-of-Pocket Payment Survey was estimated (Table 2).
he variables statistically signiicant in the logic model were: gender, age, individuals with education from a professional institute or university, employment status, insurance system, emergency insurance, and additional insurance. he results from the logit model estimation suggested that females were positively associated with the probability of using health services. According to the marginal efect, the probability of using healthcare services for females was 0.134 times higher than for men. Age increased the probability that a person would use
Table 2. Two-part model estimation for health care services (selected results).
Variable
Estimation results
First part: Logit Second part: Ordinary least-square Equation of probability of use Equation of expenditures Dependent variable: usage (yes/no) Dependent variable: Ln(OOP payment) Coeff. SE z ME Coeff. SE z
Constant -4.437 0.673 -6.60a -4.743 1.655 -2.87a
Female 0.622 0.099 6.28a 0.134 0.381 0.249 1.53
Age 0.023 0.003 7.47a 0.050 0.016 0.008 2.10b
School
No education -
-Elementary school 0.206 0.248 0.83 0.042 0.283 0.643 0.44
High school 0.401 0.251 1.59 0.084 1.750 0.653 2.68a
Technical-professional 0.290 0.271 1.07 0.060 1.967 0.710 2.77a
Technical training 0.242 0.325 0.74 0.050 1.558 0.861 1.81c
Professional institute 0.729 0.299 2.44b 0.157 2.007 0.775 2.59a
University 0.880 0.270 0.26a 0.191 2.643 0.692 3.82a
Work -0.471 0.097 -4.87a -0.102 -0.552 0.241 -2.29b
Ln(Income) 0.008 0.016 0.51 0.002 0.089 0.041 2.16b
Insurance system 0.300 0.109 2.76a 0.065 0.646 0.280 2.31b
Insurance
Indigent/FONASA (A, B) -
-FONASA (C, D) -0.014 0.161 -0.09 -0.003 2.394 0.429 5.58a
ISAPRES 0.020 0.204 0.10 0.004 2.329 0.517 4.50a
CAPREDENA 0.182 0.377 0.48 -0.071 2.585 0.877 2.95a
DIPRECA -0.327 0.452 -0.72 -0.090 4.609 1.025 4.50a
Other system -0.419 0.680 -0.62 -0.083 -0.311 1.617 -0.19
None -0.384 0.222 -1.73 -0.042 2.646 0.636 4.16a
Emergency insurance 0.676 0.231 2.92a 0.146 0.224 0.446 0.50
Additional insurance 0.367 0.143 2.56b 0.081 0.466 0.328 1.42
Pseudo-R2/R2 8.24% 21.81%
Sample 4,269 1,758
Ln: Natural Logarithm
healthcare services. For the average person in the sample, an extra year of age increases the probability of usage by 5%. In addition, persons with technical training, or having attended a professional institute, or university showed higher probability of using healthcare services than those with no education.
he variables statistically signiicant in the ordinary least square model for OOP payment included age, all the categories of the variable school except for no education, employment, natural logarithm of per capita income, insurance system, and the following types of insurance:
FONASA, ISAPRES, CAPREDENA, DIPRECA, and no insurance. Of those statistically signiicant variables, the marginal efect of insurance system, school, and income were the strongest. In order to interpret results, the estimated coeicients were exponentiated, and we found that a 1% increase in per capita income resulted in increasing OOP payment by
0.09%. Moreover, our estimation also suggests that respondents with high school education had a 475% higher OOP payment than those with no education. his percentage increases as the level of education increases. In addition, there is evidence of inequity in the system. he FONASA users from groups C and D have an increase of OOP payment of 996% than those in groups A and B. Individuals with private insurance have an increase of OOP payment of 927% compared to FONASA groups A and B. herefore, those with private system are paying a similar or lower OOP payment than those in FONASA groups C and D.
Progressivity
Table 3 presents the sources of inance by household characteristics. he OOP payments for healthcare services were similar for the II, V, and XIII regions, while it was substantially lower for the VIII region. According to these results, ISAPRE, DIPRECA, and other systems are the insurance systems with the higher household OOP payment.
To assess progressivity of OOP payment for healthcare, we made a graph on the percentage of total household expenditure by quintile groups (Figure). here is a tendency to increase health payments per household expenditure by quintile groups, indicating some progressivity of the inance system, while this efect is not visible after the third quintile.
he estimated Concentration Index is 0.5044 with standard error of 0.0121, and the Kakwani index is equal to 0.0717 with standard error of 0.0099. hese two indexes add additional evidence of the progressivity of the system. hus, the inancial burden is concentrated in the wealthier population.
Table 3. Sources of finance by household characteristics (all units are in Chilean Peso).
Variable Per capita consumption, gross
OOP payment for healthcare
Per capitaconsumption, net of payments
Region
II region 115,671.9 11,951.1 103,720.8
V region 106,632.2 10,647.5 95,984.6
VIII region 81,283.5 8,345.8 72,937.7
XIII region 105,101.1 11,181.7 93,919.4
Insurance
Indigent card 50,669.1 3,348.6 47,320.5
FONASA 92,565.8 10,416.2 82,149.6
ISAPRE 216,349.9 19,742.8 196,607.1
CAPREDENA 130,159.8 18,958.4 111,201.5
DIPRECA 141,113.7 26,033.7 115,080.1
Other system 278,000.0 26,998.6 251,001.4
None 116,345.4 6,437.6 109,907.8
Missing 95,405.2 10,185.9 85,219.4
Total 100,410.6 10,421.6 89,989.0
Redistributive Effect
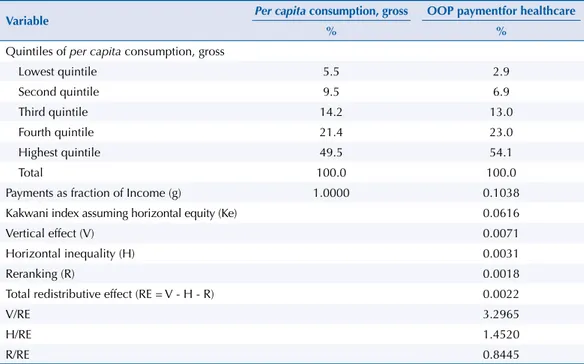
Table 4 presents the results from the decomposition of the redistributive impact of OOP payment on the healthcare inancing system. he irst part indicates that the poorest quintile is responsible for, on average 5.5% of total consumption, while the richest quintile consumes 49.5%. Similarly, the lowest quintile is consuming per capita, on average, 2.9%
of OOP payment compared to the highest quintile, which consumes 54.1%. he wealthier contributed a much higher proportion of total OOP payment, while the last two quintiles contributed 77.1% of it. Overall, OOP payment represents an average of 10.4% of income.
In the absence of horizontal inequity, the system is progressive; Kakwani index is 0.0616, indicating that the inancial burden is concentrated in the wealthier population. he total redistributive efect of OOP payment has a positive sign, indicating reduction in inequalities
Figure. Out-of-pocket payments as a percentage of total household expenditure, per expenditure quintile.
Health payment as % of household expenditure
15
10
5
0
Lowest quintile
Quintiles of per capita consuption, gross
2 3 4 Highest quintile
Table 4. Decomposition of the redistributive impact of the healthcare financing system.
Variable Per capita consumption, gross OOP paymentfor healthcare
% %
Quintiles of per capita consumption, gross
Lowest quintile 5.5 2.9
Second quintile 9.5 6.9
Third quintile 14.2 13.0
Fourth quintile 21.4 23.0
Highest quintile 49.5 54.1
Total 100.0 100.0
Payments as fraction of Income (g) 1.0000 0.1038
Kakwani index assuming horizontal equity (Ke) 0.0616
Vertical effect (V) 0.0071
Horizontal inequality (H) 0.0031
Reranking (R) 0.0018
Total redistributive effect (RE = V - H - R) 0.0022
V/RE 3.2965
H/RE 1.4520
R/RE 0.8445
and redistribution from the rich to the poor. he ratio of vertical efect over the redistributive efect is very large in comparison to the redistributive efect, indicating that redistribution is mostly a vertical efect, i.e., diferential treatment of inequality. If there was no horizontal redistribution, then the vertical redistribution or Robin Hood role, i.e., taking from the rich to give to the poor, would be much greater. he vertical redistribution from rich to poor would be 230% greater than the current redistribution (Table 4), which indicates a considerable variation at diferent levels of income. he estimated H (a measure of horizontal inequity) is 0.0031 and it increases post-payment inequalities and reduces the redistributive efect. he diferences in the composition of the population can help to explain this horizontal inequity. In conclusion, the rich contributes proportionally more than the poor to OOP payment, which can be attributed to their higher level of use of health services.
DISCUSSION
Results from this study provide comprehensive understanding of the distribution of inancial burden of the healthcare in Chile. Furthermore, our assessment of equity in the health system inance can identify policy variables for the ongoing debates and research in improving equity in the health system inance of Chile. Such indings, moreover, will also beneit other Latin-American Governments that are concerned about equity in their health system inance.
Policy Implications
An interesting inding is that the health system inance in Chile is progressive, as judged by our estimation of OOP payment in relationship to income quintile. herefore, persons with higher income are paying more OOP for healthcare than the poor. However, evidence of progressivity in the system does not mean that the system is equitable in all dimensions. In fact, a healthcare system may be progressive while still having serious issues of horizontal inequity16. We found evidence of horizontal inequity after examining the decomposition of the redistributive efect. It is at this point that we added the values of the 2PM for the analysis, since this model helps to identify some key variables that make the healthcare system more or less equitable.
he results from the 2PM showed an association between: age, education, insurance system, and the payment of the healthcare services. In addition, the heterogeneity in the sociodemographic status of the Chilean population may cause some diferences and make the system less equitable. An interesting inding is that persons who are in the public insurance groups C and D and individuals with private system pay more OOP than persons in groups A and B. his is consistent with the principle of ATP, since groups A and B include the most disadvantaged persons; they are either indigent or individuals with very low income. We also found that persons from the FONASA groups C and D are paying similarly or more than those from ISAPRE. he tendency in the country is that persons with higher income have a propensity to belong to ISAPRE, which may contribute to the evidence of inequity that we observed in this study. his brings an additional policy issue: the availability of new subsidies to the healthcare system may favor ISAPRE beneiciaries instead of persons with lower income in the country. Allocation of public resources will be seen as inequitable under the actual structure. herefore, the country should make additional eforts and reforms to promote better access by the poor to essential health care services.
inancial access to healthcare for the low income group, Chile can implement a system mostly funded by the government using a progressive inancing scheme, in order to achieve efective universal health coverage. Even though the Explicit Health Guarantees reform is an approach to provide universal and equitable health care coverage to the population, it still prevents the access of the population to health care services, imposing barriers and diferential access for health conditions4.
Finally, based on our study, we suggest that there is an opportunity to examine the feasibility of providing greater access of the private healthcare delivery system for persons who belong to the lower quintiles. his is because while the government provides some healthcare facilities, they are often inadequate and, because of easier geographical and time access, persons use private provider facilities. To promote better access, especially for the low income group, the government can either expand its public facilities or subsidize the use of private facilities by low income groups. Similarly, if the system wants to improve the equity of healthcare inancial burden, the government can increase public facilities and services, especially to make them available to disadvantaged groups. Besides improving public sector health services, evidence from our study and the literature suggest that improving an individual’s education can also contribute to a more equitable inancial burden of healthcare and further equitable health6. Investment in general education, therefore, may also be a good long-term strategy to improve the health system inance equity of the country.
We cannot compare this study with previous empirical evidence. However, some comparative research reaches important conclusions about the status of OOP payment in the region. In many countries, most healthcare expenditures are inanced by the government; however, OOP payment is still very important for the Latin American region. he World Bank, in 2006, undertook a comparative research in ive Latin American countries inding that low public and high private healthcare expenditures characterize the Latin American and the Caribbean region, being most of it OOP (85%)6. Another study in the Caribbean region conducted by the Economic Commission for Latin America and the Caribbean in 2006 found a trend towards increasing dependence on OOP payment as a main source of health inancing8. he OOP payment in countries such as Nicaragua or Guatemala inances more than half of their total national health expenditure, whereas in countries such as Chile and Argentina it represents no more than 25%f. herefore, inequity in the inancial burden of healthcare is one major concern for countries worldwide, including Chile.
Limitations
he limitations are related to the use of secondary data. here is a long self-reported recall period of six to twelve months for most of the questions related to healthcare. In addition, we are aware that estimates of OOP payment can sufer from the same recall bias.
he 2006 Satisfaction and Out-of-Pocket Payment Survey did not ask for information related to the amount of payment for additional or voluntary health insurance, which may have an efect on the understating of the level of OOP payment of individuals. Moreover, our assessment was based entirely on OOP payment and did not include any other inancial burden, especially taxation and insurance premiums.
he national survey data used had a 91.2% response rate and, as such, sample selection bias can be assumed to be minimal. Furthermore, the data is a national household survey that included both users and nonusers of healthcare services. Potential sample selection bias might occur in the second part of the ordinary least-square of the 2PM (i.e. ISAPRE beneiciaries might use more healthcare services and thus incur in more OOP payment). However, since we included the type of insurance as explanatory variable in both parts of the 2PM, sample selection bias, if it did exist, is minimized here given that sample selection bias is minimal in the entire national sample. he estimated coeicient for type of insurance provides the information on to what extent diferent types of insurance afect the probability of use versus nonuse of healthcare, and given the usage, the efect a particular type of insurance f WHO Statistical Information
has on OOP payment. Additionally, we tested for endogeneity of the insurance variable using the following instruments: chronic diseases, main health problem, illness or accident, and type of home, so we performed a version of the Durbin-Wu-Hausman test, concluding that the null hypothesis that the variables are exogenous cannot be rejected.
Furthermore, results from the Concentration Index and Kakwani index indicate that, although higher income households proportionally contributed more with OOP payments, they also consumed more healthcare services than households with lower income. hese results are evidence that, despite having health insurance, cost sharing may still be a barrier for the access to health services, especially by low-income households. herefore, OOP payments could be a proxy measure for equity in the inancial burden of healthcare. At the same time, we understand it is not a suicient analysis of the overall healthcare equity, as it leaves out the equity analysis on the utilization of and access to healthcare.
REFERENCES
1. Aronson JR, Johnson P, Lambert PJ. Redistributive effect and unequal income tax treatment.
Econ J. 1994;104(423):262-70. https://doi.org/10.2307/2234747.
2. Bitrán R, Muñoz R. Introduction. In: Knaul FM, Wong R, Arreola-Ornelas H, editors. Household spending and impoverishment. Cambridge, MA: Harvard University Press; 2012. p.129-51. (Financing Health in Latin America Series, 1).
3. Cid Pedraza C, Prieto Toledo L. El gasto de bolsillo en salud: el caso de Chile, 1997 y 2007.
Rev Panam Salud Publica. 2012;31(4):310-6. https://doi.org/10.1590/S1020-49892012000400007.
4. Frenz P, Delgado I, Kaufman JS, Harper S. Achieving effective universal health coverage with equity: evidence from Chile. Health Policy Plan. 2014;29(6):717-31. https://doi.org/10.1093/heapol/czt054.
5. Jadue L, Marín F. Determinantes sociales de la salud en Chile: en la perspectiva de la equidad. Santiago de Chile: Policy Institute of Epidemiology and Public Health; 2005.
6. Knaul FM, Wong R, Arreola-Ornelas H, editors. Household spending and impoverishment. Cambridge, MA: Harvard University Press; 2012. (Financing Health in Latin America Series, v. 1).
7. Manning WG, Duan N, Rogers WH. Monte Carlo evidence on the choice between sample selection and two-part models. J Econom. 1987;35(1):59-82. https://doi.org/10.1016/0304-4076(87)90081-9.
8. Marmot M, Friel S, Bell R, Houweling TA, Taylor S. Closing the gap in a generation: health equity through action on the social determinants of health. Lancet. 2008;372(9650):1661-9. https://doi.org/10.1016/S0140-6736(08)61690-6.
9. Newhouse JP, Manning WG, Morris CN, Orr LL, Duan N, Keeler EB, et al. Some interim results from a controlled trial of cost sharing in health insurance. N Engl J Med. 1981;305(25):1501-7. https://doi.org/10.1056/NEJM198112173052504.
10. Núñez A, Chi C. Equity in health care utilization in Chile. Int J Equity Health. 2013;12:58. https://doi.org/10.1186/1475-9276-12-58.
11. O’Donnel O, Van Doorslaer E, Wagstaff A, Lindelow M. Analyzing health equity using household survey data analyzing: a guide to techniques and their implementation. Washington (DC): The World Bank; 2008.
12. Raczynski D, Serrano C. Las políticas y estrategias de desarrollo social: aportes de los años 90 y desafíos futuros. In: Meller P, Landerretche O, editores. La paradoja aparente, equidad y eficiencia: resolviendo el dilema. Santiago de Chile: Taurus; 2005. p.225-76.
13. Savedoff WD. A moving target: universal access to healthcare services in Latin America and the Caribbean. Washington (DC): Inter-American Development Bank; 2009. (Working Paper, 667).
14. Starfield B. Improving equity in health: a research agenda. Int J Health Serv. 2001;31(3):545-66. https://doi.org/10.2190/DGJ8-4MQW-UP9J-LQC1.
15. Urriola Urbina R. Financiamiento de la atención de la salud en Chile: 2000-2007. Cuad Med Soc. 2010 [cited 2016 Feb 18];50(2):83-94.
Available from: http://cms.colegiomedico.cl/Magazine/2010/50/2/50_2_2.pdf
17. Vásquez F, Paraje G, Estay M. Income-related inequality in health and health care utilization in Chile, 2000-2009. Rev Panam Salud Publica. 2013;33(2):98-106. https://doi.org/10.1590/S1020-49892013000200004.
18. Vega-M J. Enfermo de pobre: las inequidades sociales y la salud en Chile. Rev Univ. 2001;(73):43-56.
19. Wagstaff A, Van Doorslaer E. Equity in the finance and delivery of health care: concepts and definitions. In: Van Doorslaer E, Wagstaff A, Rutten F, editors. Equity in the finance and delivery of health care. Oxford: Oxford University Press; 1993. p.7-19.
20. Wagstaff A, Van Doorslaer E, Burg H, Christiansen T, Citoni G, Gerdtham UG, et al. Equity in the finance of health care: some further international comparisons. J Health Econ.1999;18(3):263-90. https://doi.org/10.1016/S0167-6296(98)00044-7.
21. Wagstaff A, Van Doorslaer E. Equity in health care finance and delivery.
In: Culyer AJ, Newhouse JP. Handbook of health economics. Amsterdam: Elsevier; 2000. v. 1, Part B, p.1803-62.
22. Wagstaff A. Reflections on and alternatives to WHO’s fairness of financial contribution index.
Health Econ. 2002;11(2):103-15. https://doi.org/10.1002/hec.685.
23. Wagstaff A, Van Doorslaer E, Watanabe N. On decomposing the causes of health sector inequalities with an application to malnutrition inequalities in Vietnam. J Econom. 2003;112(1):207-23. https://doi.org/10.1016/S0304-4076(02)00161-6.
24. Yu CP, Whynes DK, Sach TH. Equity in health care financing: the case of Malaysia.
Int J Equity Health. 2008;7:15. https://doi.org/10.1186/1475-9276-7-15.
Authors’ Contributions: ANM developed the original research idea and questions, obtained the data for this study, conducted data analysis, interpreted the results, and wrote the study. CC contributed with the original research idea and questions, selected the statistical models for data analysis, interpreted the results, and contributed with the writing and revisions of the study. All authors read and approved the inal manuscript.
Acknowledgments: To Peter Anthony Lachenbruch, who provided statistical advises during research and the
Ministry of Health from Chile, for the data collected in the survey: Encuesta nacional sobre satisfacción y gasto en salud.