STUDY OF BLOOD PRESSURE PROFILE OF HEALTHY ADULT MALES IN AN URBAN SETTING OF PUNE,
MAHARASHTRA
R. K. Gaur1, Arvind Kushwaha2, B. K. Shukla3
1Assistant Professor, Department of Community Medicine, Rural Medical College, PIMS, Loni, Ahmednagar, Maharashtra. 2Officer Commanding, Station Health Organization, Kirkee, Pune.
3Medical Officer, ECHS, Kirkee, Pune.
ABSTRACT
BACKGROUND
Raised blood pressure, a condition that causes around half of all deaths from stroke and heart diseases. Urban male adults are more prone to raised blood pressure due to presence of various modifiable factors related to their lifestyle when compared to their counterparts in rural areas. This study was done to study the blood pressure profile of male adults in an urban population of Pune, Maharashtra.
AIMS AND OBJECTIVES
This study was carried out to determine the prevalence of hypertension in healthy adult males of a defined urban population and to study the association in between selected variables and blood pressure.
MATERIAL AND METHODS
This cross-sectional study was carried out using a predesigned questionnaire and making measurements of height, weight and blood pressure by using standardized and validated physical instruments. Data collection and its analysis were done by using appropriate statistical tests.
RESULTS
The prevalence of Hypertension in this study was found to be 9.5% among adult healthy males.
CONCLUSION
In the study, hypertension in healthy adult males was found to be significantly associated with higher BMI, WHR, high alcohol and extra salt intake and lack of exercise.
KEYWORDS
Blood Pressure, Urban Adult.
HOW TO CITE THIS ARTICLE: Gaur RK, Kushwaha A, Shukla BK. Study of blood pressure profile of healthy adult males in an urban setting of Pune, Maharashtra. J. Evolution Med. Dent. Sci. 2016;5(47):3000-3004, DOI: 10.14260/jemds/2016/699
INTRODUCTION
Hypertension has been recognized as a disease only since the nineteenth century, even though we may presume that it is as old as man. Elevated blood pressure is an ubiquitous disorder and the cause of countless cases of coronary heart disease, stroke, congestive heart failure and renal dysfunction. It is one of the major risk factors for cardiovascular mortality, accounting for about 20-50% of all deaths and for morbidity, which contributes to disability and health care costs.1
As hypertension is the major risk factor for many diseases, there are many risk factors for hypertension itself. Some of these being non-modifiable, but a large number of them being easily modifiable by appropriate lifestyle modifications.
In most of the developing countries including India, hypertension is emerging as a major health problem and has been reported to be the second (After rheumatic heart disease), most common cardiac problem encountered in clinical practice.2
Financial or Other, Competing Interest: None. Submission 26-03-2016, Peer Review 19-05-2016, Acceptance 26-05-2016, Published 13-06-2016. Corresponding Author:
Dr. R. K. Gaur, P-503, Cosmos,
Magarpatta City, Hadapsar, Pune-411013.
E-mail: [email protected] DOI: 10.14260/jemds/2016/699
Various epidemiological studies have reported the prevalence of hypertension to be in between 10% and 20% in several adult populations.1 The result of health survey in New Delhi revealed that every fourth person aged 35 to 69 yrs. has raised blood pressure.3
Hypertension assumes special importance in context of healthy adult urban population. Most of the studies on prevalence of Hypertension have been undertaken on adults in both urban and/or rural settings, in which hypertension in few individuals is likely to be associated with some underlying disease or disorders.
MATERIAL AND METHOD
The present study was a cross-sectional study, undertaken to study the prevalence of hypertension and its association with certain risk factors/determinants. The study was undertaken in a defined urban population of healthy adult males in Pune, Maharashtra.
The physical instruments used in this study included a mercury sphygmomanometer, stethoscope, height stand, measuring tape and weighing machine. All these physical instruments and techniques were initially standardized during pilot study. In addition, they were regularly standardized throughout the period of data collection.
A detailed questionnaire was prepared and was pretested and validated during the pilot study. Questionnaire was developed as per guidelines given in various text books.5 and on the basis of The design of questionnaires and the personal interview.6 It was in both English and Marathi languages and was consisted of four sections. The first section was about their past and present history of any significant medication or surgery. In case of any doubt were referred to a physician or lab investigations, if required.
The data collection consisted of two type of methods, i.e. personal interview and physical examination.
Subjects were classified into normotensives and hypertensives on the basis of their blood pressure levels as per the definition criteria of WHO.1
Hypertensives - Systolic BP - 140 mmHg or above; Diastolic BP - 90 mmHg or above.
The technique of measuring the blood pressure was based on the guidelines developed by the WHO Expert Committee on hypertension.1,5 If the systolic blood pressure was more than 140 mmHg and diastolic blood pressure greater than 90 mmHg, it was repeated twice at the same visit at an interval of 10 min to test the validity of the reading. For those having SBP and/or DBP more than 160 mmHg and/or 100 mmHg respectively were examined at least on three occasions on repeated visits.
A pilot study was conducted on 50 subjects selected randomly with a view to ascertain the prevalence of risk factors in the community under study. Data were collected and analysed using various statistical tests (Chi-square test, Z test, Student s t test.).7
RESULTS
724 (90.5%) subjects had systolic B.P. within normal range, i.e. less than 140 mmHg, while 76 subjects (9.5%) were found to have systolic B.P. (S.B.P.) of 140 mmHg and above. Out of 76 subjects detected to have high blood pressure, 38 (4.8%) were having SBP in the range of 140-149 mmHg; 19 (2.4%) subjects had SBP in between 150 to 159 mmHg; 14 (1.7%) had SBP in between 160 to 169 mmHg and 5 subjects (0.6%) had SBP in the range of 170-179 mmHg. None had SBP more than 180 mmHg. Mean and Median of systolic BP was found to be 127.7 and 128 respectively. S.D.-11.01, Mode -128, Range -104-175. 726 (90.8 %) subjects had diastolic BP less than 90 mmHg and 74 subjects (9.2%) were found to have diastolic BP (DBP) of 90 mmHg and above. Out of these 74 subjects, 56 (7%) were having DBP in the range of 90 to 99 mmHg, while 18 (2.2%) subjects had DBP in between 100 to 109 mmHg. Out of these 18 subjects, 3 (4%) had DBP >105 mmHg. All these 74 subjects were found to have systolic BP >140 mmHg. Mean and Median of diastolic BP was found to be 79.2 and 78 respectively. SD-7.59, Mode-82, Range 62-108.
Using the WHO criteria of detecting the hypertension out of 800 study subjects, 724 (90.5%) had blood pressure within normal range and remaining 76 (9.5%) were found to have hypertension.
The age ranged from 18 yrs. and above. The majority of subjects studied, i.e. 505 (63.1%) were from age group <35 years and 295 (36.9%) were above the age of 35 years; 2.7% and 6.7% subjects were found to have hypertension in the age group of 25-29 years and 30-34 years respectively. This prevalence of hypertension increased to 17.9% in the age group 35-39 years, 20.2% in 40-44 years, 23.8% in the subjects aged 45-49 years and 25% in the subjects aged 50 years and above. Thus, an upward trend of blood pressure level was observed with increase in age and the association was statistically significant.
As regards to education status, 67(8.4%) of study subjects had education level less then 10th std., 369 (46.1%) had passed 10th std., while 281 (35.1%) had passed 12th std. and 83 (10.4%) were graduates. Prevalence of hypertension was slightly higher among those subjects, who had education level less than 10th std.
As regards to food habit of subjects, out of 117 (14.6%) vegetarian subjects 10 (8.5%) were having hypertension and out of 683 (85.4%) subjects consuming mixed diet 66 (9.7%) had hypertension. Statistically, the difference was not significant (X2=0.141, df=1, p> 0.75).
It was seen that 403 (50.4%) of study subjects were non-smokers and 397 (49.6%) were current non-smokers. Prevalence of hypertension was 8.2% (33 out of 403) among non- smokers, while it was 10.8% (43 out of 397) among current smokers.
It was observed that 562 (70.2%) of study subjects were consuming alcohol, while 238 (29.8%) were non-drinkers and were found to be having hypertension as 4.6% and 11.6% respectively. Prevalence of hypertension was 10.9% among subjects consuming alcohol up to 7 large drinks in a week, which increased to 17.9% among subjects consuming 28 large drinks per week. The difference was statistically highly significant. (X2=9.363, df=1, p<0.005).
It was also observed that prevalence of hypertension was very low (4.4%) among the subjects who never drank, (9 out of 213). It was also low (5.7%) among ex-drinkers (2 out of 35).
It was found that the prevalence of hypertension was very high (23.8%) among subjects, who were not undertaking any type of leisure time physical activity and among those who were undertaking physical activity once a week (21:7%) or twice per week (17:6%); 722 (90.3%) of subjects were undertaking physical exercise 2-3 times in a week and the prevalence was lowest (8.3%) among them. The difference was statistically significant.
The prevalence of hypertension was observed to be higher (12.7%) among those 369 subjects, who were consuming extra salt regularly as compared to those 431 subjects who were not consuming extra salt regularly in their daily diet (6.7%). The difference was statistically highly significant.
The prevalence of hypertension was found to be slightly higher (10.1%) among those 487 subjects, who were consuming extra fat regularly in their daily diet as compared to those 313 subjects, who were not consuming extra fat regularly (8.6%).
The prevalence of hypertension was found to be 22% among 41 subjects who had WHR >0.9 as compared to a lesser prevalence of 8.8% among 759 subjects having WHR <0.9. Statistically, the difference was significant. (X2= with Yate s correction=6.341, df= 1, p<0.025).
The prevalence of hypertension was 10.3% among those 29 subjects having family history of hypertension as compared to 9.5% among those 771 subjects who did not have such family history. The difference was not significant.
Class Interval (Systolic B.P. in mmHg)
No. % Cumulative
Percentage
100-109 56
724 7.0
90.5
7.0
110-119 85 10.6 17.6
120-129 334 41.8 59.4
130-139 249 31.1 90.5
140-149 38
76 4.8
9.5
95.3
150-159 19 2.4 97.7
160-169 14 1.7 99.4
170-179 5 0.6 100.0
Total 800 100.0 100.0
Table 1: Distribution of Systolic Blood Pressure
Mean-127.7, Median-127.8=128, Mode-128, SD-11.01, Range-104-175.
Class Interval (Diastolic
B.P. in mmHg)
No. % Cumulative
Percentage
60-69 47 5.9 5.9
70-79 359 726 44.9 50.8
80-89 320 40.0 90.8 90.8
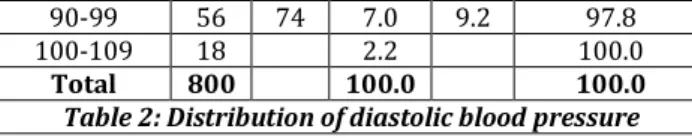
90-99 56 74 7.0 9.2 97.8
100-109 18 2.2 100.0
Total 800 100.0 100.0
Table 2: Distribution of diastolic blood pressure
Mean- 79.22, Median-78.0, Mode-82, SD-7.59, Range-62-108.
Status Number Percentage
Normotensives 724 90.5
Hypertensive 76 9.5
Total 800 100.0
Table 3: Prevalence of hypertension
Age Group
(In years)
Hypertensives Normotensives Total
No.
Age Specific
%
No.
Age Specific
%
No.
Age Specific
%
<20 0 - 27 (100) 27 (3.4)
20-24 0 - 73 (100) 73 (9.1)
25-39 6 (2.7) 18 221 (97.3) 227 (28.4) 505
30-34 12 (6.7)
(3.6%) 166 (93.3) 178
(22.2) (63.1%) 35-39 28 (17.9) 128 (82.1) 156 (19.5)
40-44 18 (20.2) 71 (79.8) 89 (11.1) (295
45-49 10 (23.8) 32 (76.2) 42 (36.9%) (5.3)
>50 2 (25.0) 6 (75.0) 8 (1.0)
Total 76 (9.5) 724 (90.5) 800 (100.0)
Table 4: Association between hypertension and age
X2= 61.58 df= 5 p <0.001 (Highly Significant).
Variables Class of Variables Hypertension
+nt -nt Total Test Value P. Value
1 Alcohol Consumption Not consuming 11 227 238 X2 9.363 <0.005
Consuming 65 497 562 X2
2 Smoking Not Smoking 33 370 403 X2 1.589 >0.3
Smoking 43 354 397 X2
3 Extra Salt Non-user 29 402 431 X2 8.284 <0.005
User 47 322 369 X 2
4 Extra Fat Non-user 49 286 313 X2 0.445 >0.5
User 27 438 487 X 2
Table 5: Association of Selected Variables with Hypertension
Body Mass Index (BMI)
No. of
Subjects Systolic BP Diastolic BP
Mean S.D Mean S.D. >25 33 141.97 13.43 88.70 8.41 <25 767 127.04 10.48 78.82 7.28
Table 6: Association Between BMI and Blood Pressure Level
Systolic BP-t= 7.905 df= 798 p<0.001 (Highly Significant) Diastolic BP- t= 7.578 df= 798 p<0.001 (Highly Significant)
Waist Hip Ratio (WHR)
Hypertensives Normotensives Total
No % No % No %
>0.9 9 (22.0) 32 (78.0) 41 (5.1) <0.9 67 (8.8) 692 (91.2) 759 (94.9)
Total 76 (9.5) 724 (90.5) 800 (100.0)
Table 7: Association Between Hypertension and Waist-HIP Ratio
X2= 6.341 df= 1 p<0.025 (Significant) (with Yate s correction)
DISCUSSION
In the present study, the distribution of SBP among the 800 subjects studied was quite close to a normal distribution since the mean (127.7), median (128) and mode (128) values of SBP were quite close to each other. As per report of a WHO expert group, the distribution of blood pressure takes Gaussian shape in the younger age group becomes progressively more skewed towards higher values for each successive older age group after the age of 20 years.8
major cities by Gupta et al.9 The prevalence is found to be slightly lesser than the estimated prevalence of hypertension as 12.5% in a study in South India by Gilbert et al.10 The possible reason for this lower prevalence as compared to other studies undertaken in various regions that the present study was undertaken among healthy male adults and majority of them are young and regularly undertake physical activity. In this study, the association between age and hypertension was found to be statistically highly significant (p<0.001).
The present study revealed that proportion of hypertensives was higher in the lower education group, i.e. less than 10th std. (10.4%). However, this difference was not statistically significant (p >0.1). As per a report of WHO expert group, there seems to be an inverse relationship between hypertension and levels of education.1
Prevalence of hypertension was slightly higher (9.7%) among subjects who were consuming mixed diet as compared to those who were vegetarians (8.5 %), though the difference was not statistically significant (p >0.75). However, it is well supported by various observational studies which have consistently demonstrated a positive relationship between low blood pressure and vegetarian diet.11,12
It was observed that 49.6% of study subjects were smokers. Hypertension was found to be slightly higher (10.8) among smokers than non-smokers (8.2%). The difference was not statistically significant. This finding is well supported by a report of WHO Expert Committee, which mention that tobacco smoking by itself does not seem to be causally related to hypertension.1This lack of association need further reason to elucidate whether the relation is causal or progressive.
The findings of the present study clearly indicate that alcohol consumption is a significant risk factor for hypertension (p<0.005) and the duration of alcohol consumption is significantly related to the hypertension (p<0.001). These findings are well in agreement with the findings observed in various available studies in this field.13,14 The study revealed that the prevalence of hypertension was higher among subjects following sedentary lifestyle (23.8%), as compared to those exercising >3 times in a week (8.3%). It clearly indicates the significant association of physical exercise with hypertension (p<0.05).
This finding is in close agreement with the finding observed in various studies, which have shown positive association between hypertension and physical activity.15 It was found that the prevalence of hypertension was higher (12.7%) among those subjects consuming extra salt regularly than those who were not consuming extra salt regularly in their daily diet (6.7%) and this difference was highly significant (p<0.005). In INTER SALT.11 study, it was demonstrated that salt intake is positively associated with blood pressure levels. In Dietary Intervention Study on Hypertension (DISH).16, it was observed that reduction of salt intake up to 40 gms daily reduced the blood pressure in most of the hypertensives.
The study did not reveal any positive association between hypertension and extra fat intake (p>0.05), though it was observed that prevalence of hypertension was higher (10.1%) among individuals consuming extra fat regularly than those who were not regularly consuming extra fat in their daily diet (8.6%).
This study has brought out the significant association between hypertension and Body Mass Index (BMI) (p<0.01).
Prevalence was quite higher (24.2%) among subjects having BMI >25 as compared to those having BMI <25. This finding is lesser than the findings of Chandrasekharan et al17, who found in a study in South India that 38.1% of all hypertensives were having BMI>25. The possible reason for this seems to be that a very larger majority of subjects studied were for younger age group with the result prevalence of overweight was low as compared to others.
A recent report of WHO Expert Committee has also mentioned that central obesity as indicated by an increased WHR correlates positively with high blood pressure. The significant association of high blood pressure and WHR observed in this study is thus in agreement with the conclusion of Egger.18 that measurement of WHR should be a routine part of clinical assessment.
A significant association between hypertension and the family history of hypertension could not be established in this study, though the prevalence of hypertension was found to be slightly higher (10.3%) among the subjects with positive family history as compared to those not having family history of hypertension (9.5%). Statistically, the difference was not significant (p>0.9), while various available studies have brought out a significant association between family history and hypertension.19
CONCLUSION
The prevalence of hypertension in the study was found to be 9.5% using the WHO criteria. The various risk factors found to be significantly associated with hypertension in the present study are alcohol intake, lack of physical exercise, increased Body Mass Index (BMI), increased Waist Hip Ratio (WHR) and extra salt intake.
RECOMMENDATIONS
Awareness building through active educational programme on the health hazards of smoking alcohol consumption should be undertaken at all levels to motivate the population to give up this or to at least reduce it to moderate amount.
Medical and administrative authorities must educate the population about the risks associated with the excessive salt and dietary fat consumption and motivate them not to add extra salt and fat to dishes on dining table.
The significant association between hypertension and Body Mass Index (BMI) and Waist Hip Ratio (WHR), as brought out in the present study needs frequent screening and motivation regarding lifestyle modifications.
It is also suggested to step up the health education programme to raise the awareness among adults as regards prevention and control of hypertension, focusing more on modifiable risk factors and consequences of high blood pressure.
REFERENCES
1. World health organization. Hypertension control report of a WHO expert committee. Tech Rep Ser 1996;862:1-83.
2. ICMR. Progress in cardio vascular disease research in India during the last two decades. ICMR Bulletin 1992;22(4):47-8.
4. Lwanga SK, Lemeshaw S. Sample size determination in health studies: a practical manual. Sample size determination in health studies: a practical manual.Cab direct 1991;p 80.
5. Rose GA, Blackburn H, Gillum RF, et al. Cardio vascular survey methods. WHO monographs series. Geneva: WHO 1982;561:78.
6. Armstrong BK, White E, Saracci R. Principles of exposure measurements in epidemiology; the design of questionnaires and the personal interview. (chapter 6 and 7 ) Oxford university press 1994;171-96.
7. Armitage P, Berry G. Statistical method in medical research. London: black well scientific publication 1987;2nd ed:504.
8. World health organization. Primary prevention of essential hypertension report of a WHO scientific group. Tech Rep Ser 1983;686:1-40.
9. Gupta R. Meta analysis of prevalence of hypertension in India. Ind Heart J 1997;49(1):43-8.
10. Gilberts EC, Arnold MJ, Gorbee DE. Hypertension & determinants of blood pressure with special reference to socioeconomic status in rural south Indian community. J Epidemiol Community Health 1994;48(3):258-61. 11. Dyer AR, Shipley M, Elliott P. Urinary electrolyte
excretion in 24 hours and blood pressure in the intersalt study I estimates of reliability the intersalt cooperative research group. Am J Epidemiol 1994;139(9):927-39.
12. World Health Organization. Diet, Nutrition and the prevention of chronic diseases. Tech Rep Ser No. 797. Geneva: WHO, 1990:p203.
13. Mac Mohan S. Alcohol consumption and hypertension. Hypertension 1992;9:111-21.
14. World hypertension league. Alcohol and hypertension, implication for management. Bulletin 1991;69(4):377-82.
15. Paffenbarger RS, Jung DL, Leung RW
.
Physical activity and hypertension: an epidemiological view. Ann Med 1991;23(3):319-27.16. Davis BR, Blaufox MD, Oberman A, et al. Reduction in long term anti hypertensive medication requirement effects of weight reduction by dietary intervention in overweight persons with mild hypertension. Arch Intern Med 1993;153(15):1773-82.
17. Chandrashekharan N, Datta M, Sankaran JR, et al. Association between obesity and hypertension in south Indian patients. Ind Heart J 1994;46(1):21-4.
18. Egger G. The case for using waist to hip ratio measurements in routine medical checks. Med J Australia 1992;156(4):280-5.