Physical Vapor Deposited Films of a Perylene Derivative: Supramolecular Arrangement and
Thermal Stability
José Diego Fernandesa, Priscila Alessioa, Matheus Rodrigues Medeiros Silvaa,
Ricardo Flavio Arocaa,b, Agda Eunice de Souzaa, Carlos José Leopoldo Constantinoa*
Received: September 18, 2016; Revised: December 16, 2016; Accepted: January 25, 2017
The analysis of supramolecular arrangement is essential to understand the role of this key factor on the optical and electrical properties of organic thin ilms. In this work, thin solid ilms of bis(phenethylimido) perylene (PhPTCD) fabricated using physical vapor deposition (PVD) technique (thermal evaporation), deposited simultaneously onto diferent substrates (Ag mirror, Ge, and quartz plates) contingent on the characterization technique. The main objective is to study the PhPTCD supramolecular arrangement and the thermal stability of this arrangement in PVD ilms. The ultraviolet-visible absorption reveals a controlled growth of the PVD ilms, and the micro-Raman scattering data show that the PhPTCD molecule is not thermally degraded in the conditions of these experiments. The microscopy also shows a homogeneous morphological surface of the PVD ilm at macro and micro scales, with molecular aggregates at nanoscale. Besides, the PVD ilm roughness does not follow substrate roughness. The X-ray difraction indicates a crystalline structure for PhPTCD powder and an amorphous form for PhPTCD PVD ilm. The infrared absorption spectroscopy points to a preferential lat-on organization of the molecules in the PVD ilms. In addition, the annealing process (200 ºC for 20 minutes) does not afect the supramolecular arrangement of the PhPTCD PVD ilms.
Keywords: supramolecular arrangement, PVD nanostructured ilms, perylene, thermal treatment.
* e-mail: [email protected]
1. Introduction
Perylene derivatives have been object of extensive research1 due to their unique optical properties well suited
for theoretical and experimental studies2,3 and their broad
range of applications in organic devices such as organic solar cells (OSCs),4 organic ield efect transistors (OFETs),5
organic light emitting diodes (OLEDs),6 and sensors.7 In
particular, it would be possible to fabricate thin solid ilms with tailored supramolecular arrangements,1 that may allow
control and tailor optical and electrical properties, which is essential to improve device performance.1 For instance,
the characteristic molecular organization of perylene derivatives directly regulates the assembled supramolecular arrangement. The arrangements deine the intermolecular distance between perylene macrocycles, strongly afecting properties such as charge transport,3,8 excimer formation,
and optical absorption and emission.1,9 In particular, the
physical vapor deposition (PVD) technique is known to promote supramolecular organization in thin solid ilms.10-15 Here, we report a detailed spectroscopic characterization, including ultraviolet-visible (UV-Vis) absorption, Fourier transform infrared (FTIR) absorption, micro-Raman scattering, luorescence, X-ray difraction (XRD), and also atomic
force microscopy (AFM), of bis(phenethylimido)perylene (PhPTCD) PVD thin ilms. The supramolecular arrangement of the fabricated ilms is discussed, and the thermal stability of this architecture is evaluated.
There are several reports on supramolecular arrangement of perylene derivatives in terms of molecular organization, a key constraint for the optical and electrical properties of perylene derivatives, which changes from perylene to perylene derivative according to their molecular structure (and substituents groups). The latter validates the need for determination of the thin ilm supramolecular arrangement for each perylene derivative. In particular, the examination of the temperature dependence of the supramolecular arrangement of the PhPTCD seems to be justiied by studies16,17 showing that
ilms exposed to heat treatment can change their molecular organization, which may afect the device performance. Determining the organization of a perylene derivative has helped to explain electrical conductivity measurements15.
It was shown that electrical contacts make a diference if the electric ield is parallel or perpendicular to the perylene chromophore. Conductivity measurements exhibited better performance (10 times higher) in the case of perpendicular electric ield. In addition, the optical absorption may also vary with changes in supramolecular arrangement. For instance, the UV-Vis absorption spectra of PhPTCD present distinct
a Departamento de Física, Faculdade de Ciências e Tecnologia, UNESP, Presidente Prudente, SP, Brazil
features in LB18 and in PVD ilms. Clearly, this information
may help to improve optoelectronic devices.
2. Materials and methods
The puriied sample of bis(phenethylimido)perylene (PhPTCD) (MM = 602.15 g/mol) was provided by Dr. J. Duf from the Xerox Resource Centre of Canada. PVD ilms were grown using the vacuum thermal evaporation technique in a Boc Edwards machine, model Auto 306, under 10-6 Torr. The method consists of placing the PhPTCD powder in a Ta-boat where an electric current is applied to evaporate the material. The electrical current was adjusted slowly up to 1.8 A, leading to an evaporation rate between 0.1 and 0.4 nm/s, monitored in-situ by a quartz crystal microbalance.
The PVD ilms were deposited in ive evaporation steps. For each step, 5.0 mg were placed into the Ta boat to be evaporated. PVD ilms of a given mass thickness were deposited simultaneously onto diferent substrates such as Ag mirror, Ge, and quartz plates kept at room temperature (23 ºC) for the corresponding spectroscopic characterization technique. The thermal stability of the PhPTCD is demonstrated by comparing the vibrational Raman spectra of the PVD ilms, and that of the powder, before and after thermal treatment.
The PVD ilms were deposited onto quartz plates up to 150 nm mass thickness and monitored via UV-Vis absorption spectroscopy using a Varian spectrophotometer; Model Cary 50, from 190 to 1100 nm. The PVD ilms onto quartz substrates were also characterized by micro-Raman spectroscopy carried out in a Renishaw micro-Raman system model in-Via equipped with a Leica microscope, laser line at 514.5 nm, 1800 lines/mm grating, time exposition of 10 s with a 50X objective lens, and CCD detector. The molecular organization of PVD ilms was determined by FTIR absorption spectroscopy in relection and transmission modes recorded in a model Tensor 27 Bruker spectrometer with a spectral resolution of 4 cm-1 and 128 scans. The 150 nm PhPTCD PVD ilms were deposited simultaneously onto Ge plate for transmission mode and Ag mirror for relection mode. The spectra in relection mode were obtained with an incident angle of radiation of 80º using the Bruker accessory A118. PhPTCD powder dispersed in KBr pellet was also characterized through FTIR and used as reference of random organization system. X-ray difraction was carried out in a Shimadzu difractometer, model XRD6000, with Cu-κα1 (λ = 1.5406Å) and Cu-κα2 (λ = 1.5444Å) radiation, 40 kV, 30 mA. The scan was performed at intervals of 2θ angles from 2.5º to 80º, using divergence and reception slits of 1º, with a step of 0.02º and a scan rate of 2º/min for both powder and 150 nm PVD ilms deposited on quartz plates and Ag mirror (before and after heating). The 150 nm PVD ilms deposited onto quartz and Ge plates were also characterized morphologically at nanometer scale through AFM images recorded using a Nanosurf microscope, model easy Scan
2, tip of silicon nitride and tapping mode. The topographic images were analyzed using the software Gwyddion2.19 to obtain parameters such as average height and roughness. The PVD ilms were also annealed up to 200oC at environmental
atmosphere for 20 min with a heating rate of 10oC/min
to evaluate the inluence of the heating on the PVD ilm supramolecular arrangement.
3. Results and discussion
3.1. PhPTCD chemical integrity
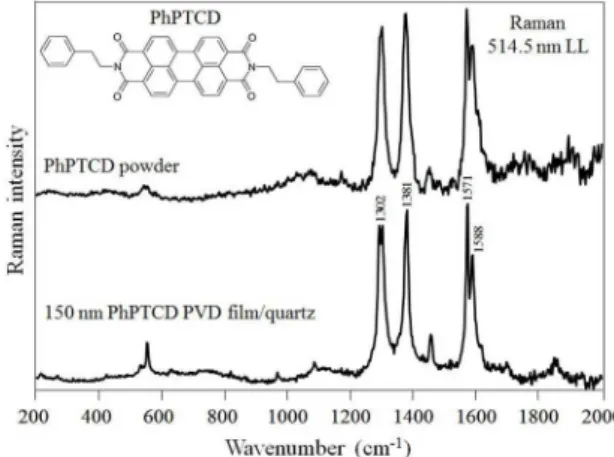
The integrity of the PhPTCD molecular structure was followed by micro-Raman scattering before and after growing the ilm using the PVD technique (thermal evaporation). Figure 1 shows the Raman scattering spectra recorded with the 514.5 nm laser line of PhPTCD powder and 150 nm PhPTCD PVD ilm on a quartz substrate. It is observed that the Raman spectrum proile is the same for both samples, with no signiicant changes in their band center and relative intensity. Therefore, it is concluded the PhPTCD molecule is not thermally degraded, which was expected since perylene derivatives are widely applied in ilm deposition through PVD technique.19-22 The assignments of the characteristic vibrational Raman bands (Figure 1) are18 chromophore ring
stretching at 1302 and 1381 cm-1, and C=C stretching at 1571 and 1588 cm-1. Because the PhPTCD absorbs electromagnetic radiation at 514.5 nm (Figure 2), the Raman signal obtained with this laser line is resonance Raman scattering (RRS).
Figure 1: Resonance Raman scattering spectra for PhPTCD powder
and 150 nm PhPTCD PVD ilm deposited onto a quartz substrate. Laser line at 514.5 nm. Inset: PhPTCD molecular structure.
3.2. Absorption and emission electronic spectra
longer wavelength than the one found for the monomer. The monomer emission of PhPTCD excited with 514.5 nm laser line in dichloromethane solution from 10-6 to 10-10 mol/L, gives band maxima at 627, 575 and 534 nm37. A broad and
structureless excimer emission is observed in a PhPTCD LB monolayer deposited onto quartz substrate18, and also in a
LB monolayer37 deposited on 6 nm Ag island ilms
(surface-enhanced luorescence recorded from -100 to +200oC).
Figure 2: UV-Vis absorption spectra for each evaporation step
(5 steps) of PhPTCD PVD ilms deposited onto a quartz substrate. Inset: absorbance at 503 nm for each evaporation step.
thickness. Since the data follows the Beer-Lambert law, it is concluded a similar amount of PhPTCD is deposited every evaporation step, indicating the controlled growth of the PhPTCD PVD ilm.
The perylene UV-Vis absorption is attributed to π → π*
electronic transitions.14 In Figure 2, the diferent absorption
maxima are assigned to transitions from the ground electronic state (E0) to vibronic progressions of the irst electronic
excited state (E1).23-26 In relation to the UV-Vis absorption
spectrum of the PhPTCD solution reported by Constantino et al.,18 the PhPTCD PVD ilm presents a displacement of
the absorption bands for both higher and shorter wavelengths (splitting). This fact can be explained by the model reported by Kasha et al.27,28 The model proposes the splitting of the
excited electronic state of a monomer (a molecule) in two other electronic excited states for dimers (two molecules), according to the interaction of the dipole moment of the molecule with the neighboring molecule. When the molecules interact with their dipole moments (→) aligned as “head-to-tail” (J-aggregation: →→), the theory predicts an excited state of lower energy (absorption band shifts to red). When the dipole moments are aligned “side-by-side” (H-aggregation: ↑↑), the theory predicts an excited state of higher energy (absorption band shifts to blue). Therefore, one can infer the PhPTCD PVD ilm presents both J and H-aggregates. This trend is also observed for PhPTCD in the form of Langmuir-Blodgett ilm (LB),18 in addition to other
perylene derivatives forming either PVD11,29-31 or LB ilms.32-35 The emission of the PhPTCD PVD ilms was investigated using the 514.5 nm excitation laser line, which spectrum for a 150 nm thickness ilm on quartz with a maximum at 689 nm shown in Figure 3. The broad and structureless emission band (from 620 nm to 900 nm in this case) found for perylene derivatives is assigned to excimer luorescence,36 which is
related to molecular stacking that requires the chromophores to be organized parallel and overlapping ring systems. When the excimer relaxes to its ground state, it emits at a
Figure 3: Excimer luorescence spectrum from 150 nm PhPTCD ilm
deposited onto a quartz substrate. Excitation laser line at 514.5 nm.
3.3. Morphology at macro, micro, and nanometric
scales
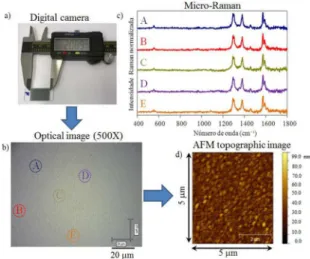
Microscopy studies at macro (digital camera), micro (optical microscopy), and nanoscale (AFM microscopy) were performed to obtain information on the surface morphology of the PhPTCD PVD ilm, as well as its thickness. Figure 4 shows images for a PhPTCD PVD ilm deposited on quartz (5 evaporation steps). In addition, Figure 4c shows RRS spectra obtained with the 514.5 nm laser line from regions A, B, C, D, and E, which are highlighted in Figure 4b (the spatial resolution of RRS spectra is determined by the laser focus, approximately 1 µm2). In general, a homogeneous
ilm surface is observed at macro (4a) and micro (4b - 500X magniication) scales. At the nanoscale, the AFM image (4d) reveals the presence of molecular aggregates in the form of disks. Such morphology is diferent from that found for the quartz substrate (supporting information - Figure SI 1a), which indicates the morphology of the quartz substrate does not restrict the PhPTCD PVD ilm morphology. It can be seen in Figure 4c, that there are no changes either in relative intensity or wavenumber of the RRS spectrum proile.
Figure 4: 150 nm PhPTCD PVD ilm deposited onto quartz
substrate: (a) photo obtained via digital camera (macroscale); (b) image obtained via optical microscopy (magniication 500X, scale bar: 20 µm), in which the regions from A to E refer to spots from where the RRS spectra show in (c) were recorded (514.5 nm laser); and (d) topographic AFM image of an area of 5 µm x 5 µm.
Figure SI 1: Topographic AFM images: a) quartz substrate itself
(bare); b) step created by removing part of the PhPTCD PTCD ilm deposited onto Ge substrate to allow measuring its thickness, which was found to be ca. 150 nm; c) distinct scanned areas for the 150 nm PhPTCD PVD ilm deposited onto quartz substrate.
the interface PVD ilm/substrate (step), and the thickness was found to be (150 ± 4) nm. Therefore, it can be established that ca. 30 nm of PhPTCD are placed in each deposition step. It is important mentioning that the roughness of the Ge substrate was found to be ca. 3 nm. Therefore, the inluence of the Ge substrate on the PVD ilm thickness is negligible, being within the thickness measurement uncertainty.
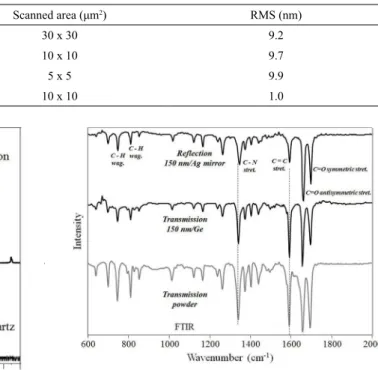
The roughness of the Ge and quartz substrates and PhPTCD PVD ilms was determined from AFM images obtained from diferent areas (supporting information - Figure SI 1c). Table 1 presents the root mean square roughness (RMS) values calculated using the following mathematical equation:38
( )
R N
Z Z
1
rms n n
N
2 1
=
-=
/
. The values of N, Zn, and Z correspond, respectively, to the number of considered pixels, the height of the nth pixel, and the average values of Z within the area
scanned by the tip of the AFM microscope. Information extracted from Table 1. i) It is observed a variation of less than 8% for the roughness of the PVD ilm within the scanned area, which suggests the morphology (disk-like molecular aggregates), is consistent along the ilm surface. ii) The quartz substrate roughness is about an order of magnitude lower than that found for the PVD ilm, which indicates the roughness of the substrate does not inluence the ilm roughness. iii) the roughness is about 6% of the thickness of the ilm comparing the RMS values with the ilm thickness (ca. 150 nm). Ferguson et al. found a roughness of 3% for PTCDA and 9.5% for Me-PTCDA in relation to the thickness of their evaporated ilms. This leads to the conclusion that the surface of the ilm is relatively smooth, despite the observed molecular aggregates. The same trend was found for other PVD ilms of perylene derivatives, such as bis butylimido perylene (BuPTCD)29 and bis benzimidazo
perylene (AzoPTCD),14 which were deposited under similar
experimental conditions, and for which the RMS roughness was found to be ca. 3% and 5% (for ilms thicker than 30 nm), respectively, of the PVD ilm thickness.
3.4. Crystallinity
X-ray difraction measurements were performed for PhPTCD powder and 150 nm PhPTCD PVD ilm deposited onto a quartz substrate, as shown in Figure 5. It is observed the PhPTCD powder is polycrystalline, with the difraction peaks well deined. On the other hand, the PVD ilm did not present any difraction peak, being the difractogram in this case similar to the bare quartz substrate difractogram. Therefore, it can be concluded the PhPTCD PVD ilm presents an amorphous arrangement. It is interesting to mention the PVD ilms of BuPTCD29 and AzoPTCD14 present crystalline
and amorphous arrangements, respectively, even though being deposited under similar experimental conditions.
3.5. Molecular organization
The PhPTCD molecular organization in the PVD ilms can be determined applying the surface selection rules. The infrared absorption intensity (I) is proportional to the squared magnitude of the transition dipole moment (or “dynamic dipole”) I ∞|μ’ • E|2 • cos2 θ, wher e θ is the angle between
the electric ield ( ) of the incident radiation and dipole moment derivatives .39 Considering the FTIR relection
mode carried for the PhPTCD PVD ilm deposited onto a Ag mirror, and incident angle of 80o, the ( ) is polarized
preferentially perpendicular to the surface of the substrate, leading to higher absorption for the also perpendicular to
E"
( ’)n
"
E"
( ’)n
E"
( ’)n
"
Table 1: RMS roughness values for the PhPTCD PVD ilm deposited onto quartz substrate (5 evaporation steps) and for the bare quartz
substrate.
Sample Scanned area (μm2) RMS (nm)
PhPTCD PVD ilm onto quartz substrate
30 x 30 9.2
10 x 10 9.7
5 x 5 9.9
Bare quartz substrate 10 x 10 1.0
Figure 5: X-ray difractogram for PhPTCD powder, 150 nm
PhPTCD PVD ilm deposited onto quartz substrate, and for the quartz substrate itself (bare).
the surface of the substrate. Considering the FTIR transmission mode, the ( ) is parallel to the surface of the substrate, leading to higher absorption for the also parallel to the surface of the substrate. Figure 6 shows the FTIR spectra in transmission mode for PhPTCD powder dispersed in KBr pellet, which is an isotropic system in term of molecular organization, and for 150 nm PhPTCD PVD ilm deposited onto Ge, and the FTIR spectrum in relection mode for 150 nm PVD ilm deposited onto Ag mirror.
The perylene derivatives, depending on their lateral groups, can reach distinct molecular organization when forming thin ilms. The organization is usually: i) lat-on (or face-on), i.e. chromophore plane preferentially parallel to the substrate surface;15,40-45 ii) edge-on, i.e. chromophore plane preferentially perpendicular to the substrate surface, standing either on the longer chromophore axis14 or the
shorter chromophore axis;11,29 iii) chromophore plane tilted in
relation to the substrate surface;17,42 and iv) random molecular
organization.16,41 Usually, three vibrational modes are key to
determine the perylene derivative molecular organization: symmetric and antisymmetric C=O stretching modes at 1657 and 1696 cm-1, respectively,40 which are parallel to the
chromophore plane, and C-H wagging modes at 745 and 810 cm-1,40 which are perpendicular to the chromophore plane.
This approach is used in the case of the articles previously quoted, which also referred to PVD ilms. Therefore, lat-on or
Figure 6: FTIR spectra for PhPTCD powder dispersed in KBr
pellet (transmission mode), 150 nm PhPTCD PVD ilms deposited onto Ge substrate (transmission mode) and Ag mirror substrate (relection mode).
edge-on molecular organization may be inferred by comparing the relative intensity in the relection and transmission modes of the symmetric and antisymmetric C=O stretching, as well as changes in the C-H wagging vibrations.
In our case, important changes are seen in the relative intensity (decrease) of the bands related to C=C stretching at 1574 cm-1and C-N stretching at 1340 cm-1 in the relection mode,40 compared to transmission mode of PVD ilm.
Because these bands refer to vibrational modes parallel to the chromophore and considering the surface selection rules, a preferential lat-on molecular organization could be established. However, the lat-on molecular organization must be followed by a signiicant increase of the C-H wagging vibrations in the relection mode, compared to the transmission mode, in the case of thin ilms of perylene derivatives in general. This trend is not observed here for PhPTCD PVD ilm. The presence of aromatic rings in the (CH2)2-ring lateral groups,
which have the freedom to rotate, may disturb the C-H wagging expected result. Supporting the lat-on molecular organization for PhPTCD PVD ilm is the relative intensity of the symmetric and antisymmetric C=O stretchings found for both powder and PVD ilm of perylene derivatives in general.16,17,40 Usually the antisymmetric C=O stretching
is found to be independent of the substrate at this thickness level, revealing stronger molecule-molecule (π-π) interaction than molecule-substrate.30,46 Usually, only the irst molecular
layer, which is in direct contact with the substrate surface, is inluenced.47 Notably, in the surface-enhanced luorescence
studies18, the large SEF enhancement observed for a monolayer
of PhPTCD LB ilm deposited onto Ag islands allowed one to conclude that the organization of the PTCD chromophore on the metal surface is edge-on or head-on, but not lat-on, with respect to the metal surface.
3.6. Thermal treatment
The molecular organization of some perylene derivative films may change in different ways through thermal treatments; from lat-on to random,41 from random to
lat-on,16 or from edge-on to lat-on.17 PhPTCD PVD ilm (150
nm thickness on Ag mirror), was exposed to heat treatment at a temperature of 200ºC for 20 minutes, to probe any change in the molecular organization. Several measurements were carried out: micro-Raman spectroscopy (supporting information - SI 2) revealed no thermal degradation, X-ray difraction (supporting information - SI 3) showed no changes in the amorphous arrangement previously determined, and FTIR spectra (supporting information - SI 4) indicated no changes in the molecular organization. Only a minor change in the excimer emission spectrum was identiied, with the maximum intensity being red shifted from 687 to 693 nm and the width being slightly decreased after the thermal treatment (supporting information - SI 5). Therefore, it is concluded the PhPTCD supramolecular arrangement established during the ilm growth by PVD technique is thermally stable under the heating condition applied here.
Figure SI 2: resonance Raman scattering (RRS) spectra for 150 nm
PhPTCD PVD ilm deposited onto quartz substrate (before thermal treatment) and onto Ag mirror substrate (after thermal treatment: 200ºC for 20 minutes). Laser line at 514.5 nm.
4. Conclusions
Bis(phenethylimido)perylene (PhPTCD) thin ilms were fabricated by physical vapor deposition onto solid
Figure SI 3: X-ray difractograms for 150 nm PhPTCD PVD ilm
deposited onto Ag mirror substrate and for Ag mirror substrate itself (bare), both after thermally treated (200ºC for 20 minutes). Inset: both X-ray difractograms were plot separated for better view.
Figure SI 4: FTIR spectra (relection mode) for 150 nm PhPTCD
PVD ilm deposited onto Ag mirror substrate before and after thermal treatment (200ºC for 20 minutes).
Figure SI 5: excimer emission spectra (luorescence) for 150 nm
substrates with controlled thickness at nanometer scale. The PVD ilm surface is morphologically homogeneous at macro and micro scales, with the roughness around 6% of the PVD ilm thickness. Molecular aggregates are observed at nanoscale, where PhPTCD are packing forming of J and H-aggregates. The FTIR data (transmission and relection modes) analyzed following the surface selections rules suggest the PhPTCD are organized lat-on in the PVD ilms; however the ilm is amorphous form according to X-ray data. Under thermal treatment (200oC for 20 minutes), this
supramolecular arrangement is not afected. The results can lend a hand to the potential application of PhPTCD in electro-optical devices.
5. Acknowledgments
FAPESP, CNPq, and CAPES (Brazilian funding agencies) for inancial support.
6. References
1. Würthner F, Saha-Möller CR, Fimmel B, Ogi S, Leowanawat P, Schmidt D. Perylene Bisimide Dye Assemblies as Archetype Functional Supramolecular Materials. Chemical Reviews. 2016;116(3):962-1052. DOI: 10.1021/acs.chemrev.5b00188.
2. Stehr V, Fink RF, Deibel C, Engels B. Charge carrier mobilities in organic semiconductor crystals based on the spectral overlap. Journal of Computational Chemistry. 2016;37(23):2146-2156. DOI: 10.1002/jcc.24441.
3. Polkehn M, Tamura H, Eisenbrandt P, Haacke S, Méry S, Burghardt I. Molecular Packing Determines Charge Separation in a Liquid Crystalline Bisthiophene-Perylene Diimide Donor-Acceptor Material. The Journal of Physical Chemistry Letters. 2016;7(7):1327-1334. DOI: 10.1021/acs.jpclett.6b00277.
4. Meng D, Sun D, Zhong C, Liu T, Fan B, Huo L, et al. High-Performance Solution-Processed Non-Fullerene Organic Solar Cells Based on Selenophene-Containing Perylene Bisimide Acceptor. Journal of the American Chemical Society. 2016;138(1):375-380. DOI: 10.1021/jacs.5b11149.
5. Cheng H, Huai JY, Cao L, Li ZF. Novel self-assembled phosphonic acids monolayers applied in N-channel perylene diimide (PDI) organic ield efect transistors. Applied Surface
Science. 2016;378:545-551. DOI: 10.1016/j.apsusc.2016.03.228.
6. Li G, Zhao Y, Li J, Cao J, Zhu J, Sun XW, et al. Synthesis, Characterization, Physical Properties, and OLED Application of Single BN-Fused Perylene Diimide. The Journal of Organic Chemistry. 2015;80(1):196-203. DOI: 10.1021/jo502296z.
7. Zhang S, Zhou F, Peng H, Liu T, Ding L, Fang Y. Fabrication and humidity sensing performance studies of a luorescent ilm based on a cholesteryl derivative of perylene bisimide. Spectrochimica Acta Part A: Molecular and Biomolecular Spectroscopy. 2016;165:145-149. DOI: 10.1016/j.saa.2016.04.033.
8. Ruiz C, García-Frutos EM, Hennrich G, Gómez-Lor B. Organic Semiconductors toward Electronic Devices: High Mobility and
Easy Processability. The Journal of Physical Chemistry Letters. 2012;3(11):1428-1436. DOI: 10.1021/jz300251u.
9. Würthner F, Stolte M. Naphthalene and perylene diimides for organic transistors. Chemical Communications. 2011;47(18):5109-5115. DOI: 10.1039/C1CC10321K.
10. Wang Z, Chang H, Wang T, Wang H, Yan D. Alternate Heteroepitaxial Growth of Highly Oriented Organic Multilayer Films. The Journal of Physical Chemistry B. 2014;118(15):4212-4219. DOI: 10.1021/jp412310y.
11. Antunes PA, Constantino CJL, Aroca R, Duf J. Relection absorption Infrared Spectra of thin Solid Films. Molecular Orientation and Film Structure. Applied Spectroscopy. 2001;55(10):1341-1346. DOI: 10.1366/0003702011953450.
12. Eccher J, Zajaczkowski W, Faria GC, Bock H, von Seggern H, Pisula W, et al. Thermal Evaporation versus Spin-Coating: Electrical Performance in Columnar Liquid Crystal OLEDs. ACS Applied Materials & Interfaces. 2015;7(30):16374-16381. DOI: 10.1021/acsami.5b03496.
13. Rybak A, Pisula W, Jung J, Ulanski J. Inluence of molecular order on charge carrier photogeneration in perylene derivative layer. Thin Solid Films. 2008;516(12):4201-4207. DOI: 10.1016/j. tsf.2007.11.107.
14. Volpati D, Job AE, Aroca RF, Constantino CJL. Molecular and Morphological Characterization of Bis Benzimidazo Perylene Films and Surface-Enhanced Phenomena. The Journal of Physical Chemistry B. 2008;112(13):3894-3902. DOI: 10.1021/ jp077588h.
15. Alessio P, Braunger ML, Aroca RF, Olivati CA, Constantino CJL. Supramolecular Organization-Electrical Properties Relation in Nanometric Organic Films. The Journal of Physical Chemistry
C. 2015;119(21):12055-12064. DOI: 10.1021/acs.jpcc.5b03093.
16. Kam A, Aroca R, Duf J,Tripp CP. Evolution of the Molecular Organization in Bis(n-propylimido)perylene Films under Thermal
Annealing. Chemistry of Materials. 1998;10(1):172-176. DOI: 10.1021/cm970299t.
17. Del Caño T, Duf J, Aroca R. Molecular Spectra and Molecular Organization in Thin Solid Films of Bis(neopentylimido) Perylene. Applied Spectroscopy. 2002;56(6):744-750. 18. Aroca RF, Constantino CJL, Duff J. Surface-Enhanced
Raman Scattering and Imaging of Langmuir-Blodgett Monolayers of Bis(phenethylimido)perylene on Silver Island Films. Applied Spectroscopy. 2000;54(8):1120-1125. DOI: 10.1366/0003702001950913.
19. Volpati D, Aoki PHB, Dantas CAR, Paulovich FV, de Oliveira MCF, Oliveira Jr ON, et al. Toward the Optimization of an E-Tongue System Using Information Visualization: A Case Study with Perylene Tetracarboxylic Derivative Films in the Sensing Units. Langmuir. 2012;28(1):1029-1040. DOI: 10.1021/ la203641a.
20. Vasseur K, Rolin C, Vandezande S, Temst K, Froyen L, Heremans P. A Growth and Morphology Study of Organic Vapor Phase Deposited Perylene Diimide Thin Films for Transistor Applications. The Journal of Physical Chemistry
21. Del Caño T, de Saja JA, Aroca RF. Exciplex emission in mixed ilms of vanadylphthalocyanine and N,N′-bis(neopentyl)-3,4,9,10-perylenebis(dicarboximide). Chemical Physics Letters. 2003;377(3-4):347-353. DOI: 10.1016/S0009-2614(03)01137-0.
22. Hasche T, Canzler TW, Scholz R, Hofmann M, Schmidt K, Frauenheim T, et al. Coherent External and Internal Phonons in Quasi-One-Dimensional Organic Molecular Crystals. Physical Review Letters. 2001;86(18):4060-4063.
23. Antunes PA, Constantino CJL, Aroca RF, Duf J. Langmuir and Langmuir-Blodgett Films of Perylene Tetracarboxylic Derivatives with Varying Alkyl Chain Length: Film Packing and Surface-Enhanced Fluorescence Studies. Langmuir. 2001;17(10):2958-2964. DOI: 10.1021/la001514e.
24. Oltean M, Calborean A, Mile G, Vidrighin M, Iosin M, Leopold L, et al. Absorption spectra of PTCDI: A combined UV-Vis and TD-DFT study. Spectrochimica Acta Part A: Molecular and Biomolecular Spectroscopy. 2012;97:703-710. DOI: 10.1016/j. saa.2012.07.056.
25. Houari Y, Laurent AD, Jacquemin D. Spectral Signatures of Perylene Diimide Derivatives: Insights From Theory. The Journal of Physical Chemistry C. 2013;117(42):21682-21691. DOI: 10.1021/jp407104m.
26. López Arbeloa F, Martínez Martínez V, Arbeloa T, López Arbeloa I. Photoresponse and anisotropy of rhodamine dye intercalated in ordered clay layered ilms. Journal of Photochemistry and Photobiology C: Photochemistry Reviews. 2007;8(2):85-108. DOI: 10.1016/j.jphotochemrev.2007.03.003.
27. Davydov AS. Theory of Molecular Excitons. New York: Springer; 1971.
28. Ramamurthy V, ed. Photochemistry in Organized and Constrained Media. Weinheim: VCH; 1991.
29. Fernandes JD, Aoki PHB, Aroca RF, Macedo Junior WD, Souza AE, Teixeira SR, et al. Supramolecular Architecture and Electrical Properties of a Perylene Derivative in Physical Vapor Deposited Films. Materials Research. 2015;18(Suppl 2):127-137. DOI: 10.1590/1516-1439.349614.
30. Keil C, Graaf H, Baumgärtel T, Trenkmann I, Schlettwein D. Intralayer vs. interlayer electronic coupling in perylene imide thin ilms. Organic Electronics. 2013;14(11):2833-2839. DOI: 10.1016/j.orgel.2013.07.030.
31. Adams DM, Kerimo J, Olson EJC, Zaban A, Gregg BA, Barbara PF. Spatially-Resolving Nanoscopic Structure and Excitonic-Charge-Transfer Quenching in Molecular Semiconductor Heterojunctions. Journal of the American Chemical Society. 1997;119(44):10608-10619. DOI: 10.1021/ja9717774.
32. Zou L, You A, Song J, Li X, Bouvet M, Sui W, et al. Cation-induced self-assembly of an amphiphilic perylene diimide derivative in solution and Langmuir-Blodgett ilms. Colloids
and Surfaces A: Physicochemical and Engineering Aspects. 2015;465:39-46. DOI: 10.1016/j.colsurfa.2014.10.021.
33. Acikbas Y, Capan R, Erdogan M, Yukruk F. Thin film characterization and vapor sensing properties of a novel perylenediimide material. Sensors and Actuators B: Chemical. 2011;160(1):65-71. DOI: 10.1016/j.snb.2011.07.013.
34. Chen Y, Kong Y, Wang Y, Ma P, Bao M, Li X. Supramolecular self-assembly study of a lexible perylenetetracarboxylic diimide dimer in Langmuir and Langmuir-Blodgett ilms. Journal of
Colloid and Interface Science. 2009;330(2):421-427. DOI:
10.1016/j.jcis.2008.10.074.
35. Wolarz E, Mykowska E, Martyński T, Stolarski R. Electronic absorption and luorescence of new tetraluoro-pentenyl-perylene in isotropic solvents, liquid crystal layers, and LB ilms. Journal
of Molecular Structure. 2009;929(1-3):79-84. DOI: 10.1016/j. molstruc.2009.04.010.
36. Tanaka J. The Electronic Spectra of Aromatic Molecular Crystals. II. The Crystal Structure and Spectra of Perylene. Bulletin of
the Chemical Society of Japan. 1963;36(10):1237-1249. DOI: 10.1246/bcsj.36.1237.
37. Constantino CJL, Lemma T, Antunes PA, Aroca R. Single molecular detection of a perylene dye dispersed in a Langmuir-Blodgett fatty acid monolayer using surface-enhanced resonance Raman scattering. Spectrochimica Acta Part A: Molecular and Biomolecular Spectroscopy. 2002;58(3):403-409. DOI: 10.1016/S1386-1425(01)00459-0.
38. Aoki PHB, Alessio P, De Saja JA, Constantino CJL. Incorporation of Ag nanoparticles into membrane mimetic systems composed by phospholipid layer-by-layer (LbL) ilms to achieve surface-enhanced Raman scattering as a tool in drug interaction studies. Journal of Raman Spectroscopy. 2010;41(1):40-48. DOI: 10.1002/jrs.2415.
39. Debe MK. Optical probes of organic thin ilms: Photons-in and photons-out. Progress in Surface Science. 1987;24(1-4):1-282.
DOI: 10.1016/0079-6816(87)90065-7.
40. Akers K, Aroca R, Hort AM, Loutfy RO. Molecular organization in perylene tetracarboxylic di-imide solid ilms. Spectrochimica Acta Part A: Molecular Spectroscopy. 1988;44(11):1129-1135. DOI: 10.1016/0584-8539(88)80083-7.
41. Rodriguez-Llorente S, Aroca R, Duff J. Spectroscopic characterization of thin solid ilms of a bis(chlorobenzylim idoperyleneimido)octane derivative. Journal of Materials Chemistry. 1998;8(3):629-632. DOI: 10.1039/A707268F.
42. Friedrich M, Gavrila G, Himcinschi C, Kampen TU, Kobitski AY, Méndez H, et al. Optical properties and molecular orientation in organic thin ilms. Journal of Physics: Condensed Matter. 2003;15(38):S2699.
43. Rodrı́guez-Llorente S, Aroca R, Duf J. Infrared and Raman spectra of thin solid ilms of 1,2-bis(propylimido perylene) ethane. Spectrochimica Acta Part A: Molecular and Biomolecular Spectroscopy. 1999;55(5):969-978. DOI: 10.1016/S1386-1425(98)00238-8.
44. Rodriguez-Llorente S, Aroca R, Duf J, de Saja JA. Spectroscopic characterization of thin solid ilms of 1,3 bis(3- chlorobenzylimido perylene) propane. Thin Solid Films. 1998;317(1-2):129-132. DOI: 10.1016/S0040-6090(97)00608-1.
46. Aroca R, Johnson E, Maiti AK. Molecular Orientation and Stacking of Perylenetetracarboxylic Diimide Derivatives in Langmuir-Blodgett Monolayers: Part I. Applied Spectroscopy. 1995;49(4):466-471.