ISSN 0104-6632 Printed in Brazil
www.abeq.org.br/bjche
Vol. 25, No. 04, pp. 723 - 728, October - December, 2008
Brazilian Journal
of Chemical
Engineering
THE ROLE OF PHENOLS FROM BAGASSE
VACUUM PYROLYSIS BIO-OIL IN CUPPER
SULFURED ORE FLOTATION
L. E. Brossard
2, A. L. Beraldo
1*, L. A. B. Cortez
1,
L. E. Brossard Jr
2,
E. D. Maury
2and C. O. Brossard
21
Faculdade de Engenharia Agrícola, FEAGRI, UNICAMP, Phone: +(55) (19) 3521-1030, Cidade Universitária Zeferino Vaz, Barão Geraldo, Cx. P. 6011, CEP 13083-875, Campinas - São Paulo, Brazil.
E-mail: [email protected]
2
Facultad de Ingeniería Química, Universidad de Oriente Sede Mella, Ave. Las Américas s/n, Ampliación de Terraza, Cx. P. 90 600, Santiago de Cuba.
(Received: January 15, 2006 ; Accepted: February 05, 2008)
Abstract - Vacuum pyrolysis bagasse bio-oil collected in a series of sequential fractions was analyzed for
total percentage of phenols and levoglucosan components. It was established that the ratio total phenols- to-levoglucosan could be used as an indicator of the performance of alkaline solutions of bio-oil fractions (SABO) when they are used as foaming agents to benefit flotation of sulfured cupper minerals. A high total phenol-to-levoglucosan ratio results in high percentages of Cu in cupper flotation concentrates, LCu. A closer
look at the role of individual phenols reveals that p-cresol is the main phenol, although not the only one, responsible for the observed behavior. Additionally it was noted that rather high doses of these foaming agents must be used to obtain desirable results in flotation processes. A production cost estimate allows consideration of SABO as an alternative to others commercial foaming agents, especially if an optimization study reduces doses of SABO.
Keywords: Pyrolysis; Bio-oil; Phenols; Cu flotation.
INTRODUCTION
Since the beginning of last century, dry distillation of wood has been industrially exploited to obtain charcoal as the main solid product. This thermal decomposition of wood, and in general of any lignocellulosic material (slow pyrolysis), is accompanied by a liquid phase composed of water and a mixture of soluble and insoluble organic compounds. The water-insoluble compounds are mainly a mixture of partially polymerized phenols and other high-molecular-weight organic compounds (pyrolysis tar or bio-oil) while low-molecular-weight carboxylic acids and neutral compounds including carbohydrates constitute the main water-soluble components (Yorgun et al., 2001). By the second
half of twentieth century, new pyrolysis processes were developed with the aim of obtaining higher yields of low-molecular-weight compounds in bio-oil. Two approaches were followed: fast pyrolysis (Diebold and Scahill, 1988; Diebold and Bridgwater, 1999) and vacuum slow pyrolysis (Pakdell et al., 1994; Roy et al., 1997; Boucher et al., 2000). The bio-oil fraction obtained from these processes is currently used as raw material for different applications such as fuels (Radlein et al, 1996; Shadix and Tenison, 1998; Radlein, 1999), formaldehyde resins (Chum and Kreibich, 1993), NOx and SOx emission reduction (Zhou et al., 1997) etc.
condensation, polymerization and cracking of organic constituents. As a result of such experimental conditions, the organic fraction obtained is a complex mixture of high-molecular-weight substances of restricted value for most applications. On the other hand, in vacuum pyrolysis as well as in flash pyrolysis, condensable gases are quickly removed from the hot zone of the reactor, preserving the identity of original compounds and therefore yielding simple mixtures.
Vacuum slow pyrolysis of sugar cane bagasse has been studied in a search for less degraded liquid products (Brossard et al., 2000; Penedo, 2000). This liquid fraction is rich in two components: levoglucosan and phenols (Lomax et al., 1991; Penedo, 2000). According to exploratory tests conducted by authors of this article, both types of substances seem to have great importance in the foaming behavior of alkaline bio-oil solutions when they are used in mineral ore flotation.
Alkaline solutions of bio-oil from slow pyrolysis of bagasse have been used as foaming agents in sulfured copper ore flotation (Brossard and Cortez, 1997). At that time the hypothesis that phenol components were accountable for observed results, was advanced. According to this, a pyrolysis process that would not promote additional thermal changes in the primary bio-oil should be a better option for the same purpose.
The present work deals with the use of sugar cane bagasse bio-oil from vacuum pyrolysis, in the form of alkaline solution for the sulfured copper ore flotation process. Unfortunately, a careful literature search did not show reports regarding the use of bio-oil as foaming agents for sulfured Cu or any other minerals.
MATERIALS AND METHODS
Vacuum Pyrolysis Experiments
Vacuum pyrolysis laboratory installation was furnished of three ice-cooled flasks interconnected and that were connected to the gas exit of an electrically heated pyrolysis reactor in such a way that sequential collection of three fractions (Fractions I, II, and III) was possible under each experimental condition. These fractions constitute three condensates originating in the reactor and used in this work.
All experiments were carried out under vacuum at 20 kPa with air-dried integral bagasse (12% moisture content, d.b.) and pressed into briquettes of different apparent densities. The final pyrolysis temperature
was uniformly maintained at 425 oC during 2 hours. Experimental conditions adopted for this study are shown in Table 1.
Heating speeds as well as bagasse density levels were chosen in order to confirm the hypothesis that under slow pyrolysis conditions in moderate vacuum, an increase in heating speed and relatively low-density-bagasse briquettes, should yield bio-oils with higher phenol content. Yields of total solid (charcoal), liquid (water and organics) and gaseous products are shown in Table 2.
The liquid fractions from the selected pyrolysis conditions were analyzed for total phenols (F) and levoglucosan (L) by means a Hewlett-Packard 5890 Series 11 gas chromatograph connected to a Hewlett – Packard 598913 mass spectrometer. Results, including pH of all fractions, are shown in Table 3.
Flotation Experiments
Experiments were conducted by means of a discontinuous bench installation furnished with a ball mill with a processing capacity of 0.8 kg mineral pulp in 0.8 kg water and a Denver flotation machine (2.5 L mineral pulp capacity). Sulfured cupper mineral used in bench tests was analyzed (see Table 4) with a UNICAM ATI atomic absorption spectrometer.
Flotation Reagents
Potassium amyl xanthate was used as collector and pH was regulated in accordance with current industrial practice at Mina Grande El Cobre, with carbide ash, which is the solid residue of calcium carbide hydrolysis in acetylene gas production. Foaming agents were prepared from the tar fractions in Table 3 or from pure phenols mixtures by adding NaOH 1 M solution up to neutralization point. In this way the reddish-brown aqueous solutions with 22% average solid content were prepared.
Flotation Conditions
All flotation parameters selected, except for flotation time and further processing of the foams collected, are currently used in industry.
Foaming agent-to-mineral mass ratios (g.ton-1): 50 and 200.
55% mineral pulp particles
〈
0.074 mm. Pulp pH adjusted to 10.6.
Liquid-to-solid ratio (mLg-1): 3.3.
Flotation time: 8 minutes.
Table 1: Conditions for vacuum slow pyrolysis (2 hour pyrolysis time)
Variables Condition 1 Condition 2 Condition 3
Heating speed
(OC. min-1) 12.4 5.4 12.4
Apparent density
(kg m-3) 263.8 263.8 362.4
Table 2: Yields of charcoal, pyrolytic liquids and gaseous products from vacuum slow pyrolysis of bagasse briquettes
Yields (% d.b.)*
Experimental condition Charcoal Pyrolytic liquids Gaseous products
1 33.26 42.73 24.01
2 28.41 53.14 18.45
3 30.29 46.57 22.64
* Mean values of 5 replicates
Table 3: Total phenols and levoglucosan (%) in bio-oil fractions I II and III (pH of each fraction)
Experimental condition 1 2 3
Bio-oil fraction I III III I III III I III III
Total phenols (F) 13.3 9.5 10.1 9.3 7.2 4.1 10.2 8.6 7.9
Levoglucosan (L) 14.4 4.1 15.6 10.1 1.5 1.2 11.8 10.4 12.9
F-to-L ratio 0.92 2.32 0.65 0.92 4.8 3.42 0.90 0.83 0.61
pH 3.50 4.15 3.90 4.20 4.80 5.10 3.9 4.40 4.65
Table 4: Composition of cupper mineral
Component %
Ni 0.007 Co 0.005 Fe 11.03 Cu 2.27 Zn 0.013 Mn 0.126 Mg 1.04
Al 2.79 Ca 0.17 Cr 0.011
SiO2 0.096
SO42- 12.04
S / BaSO4 7.48
RESULTS AND DISCUSSION
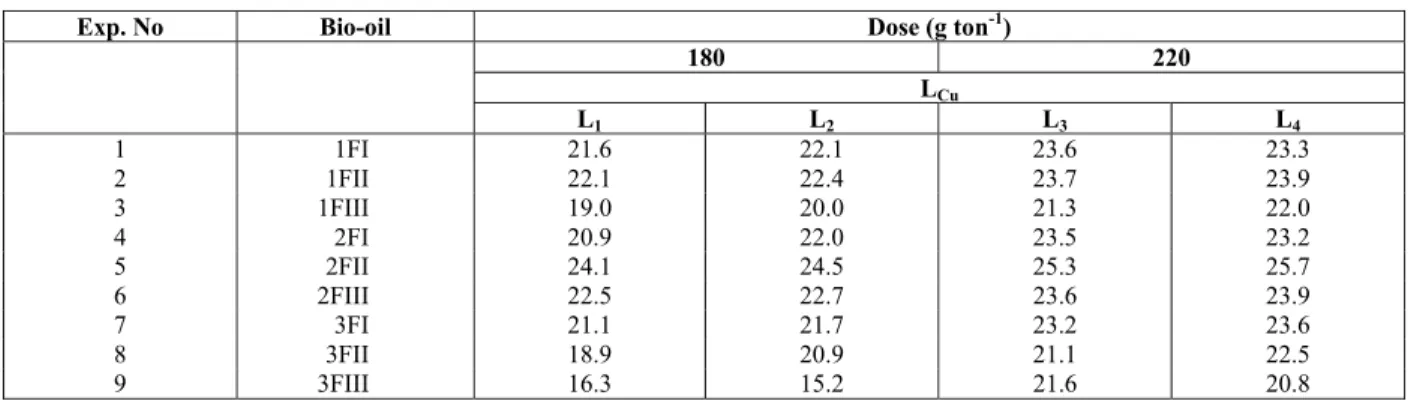
Bio-oil fractions obtained from vacuum pyrolysis experiments in order of increasing F / L ratio are as follows: 2FII > 2FIII > 1FII > 1FI, 2FI, 3FI > 3FII > 1FIII > 3FIII. If phenols as a whole play a decisive role in flotation with alkaline bio-oil solutions, the higher percentage in a given bio-oil fraction, the higher LCu should be.
On the other hand, as observed in exploratory tests, levoglucosan content showed the opposite effect, making foam formation difficult and thus lowering LCu.
Therefore F-to-L ratio could be used as a predictor of the foaming capacity of alkaline bio-oil solutions prepared under different pyrolysis conditions.
A two-way analysis of variance (ANOVA) of these results followed by a LSD test (Table 6) shows that factors dose and type of alkaline solution influence LCu, although the factor dose appears to be the more important. LSD tests applied to these results at
α
=0.05 show that higher foaming agent- to-mineral ratio (200 g ton-1) and bio-oil fraction 2FII are the best levels for both factors. As shown in Table 7, alkaline solution from bio-oil fraction 2FII is significantly better as foaming agent than the rest of the solutions tested. It is also the alkaline solution from the bio-oil fraction with the highest phenol-to-levoglucosan ratio.A closer look at Table 7 allows speculation about a possible decreasing order of effectiveness of the different alkaline solutions: 2FII > 2FIII, 1FII > 1FI, 3FI, 2FI > 3FII, 3FIII which follows the decreasing magnitude of the F-to-L ratio. Next step was to
discover the role of individual phenols in bio-oil fraction mixtures.
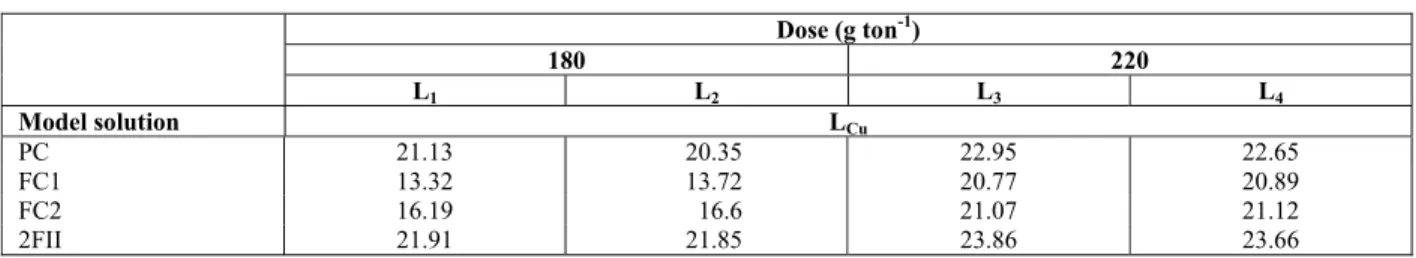
For this purpose alkaline solutions of pure p-cresol and of phenol mixed with p-p-cresol were prepared and compared to 2FII alkaline solution in relation to the LCu increasing (see Table 8). Flotation experiments were conducted under the same conditions previously described. The results obtained for these model phenol solutions are shown in Table 9.
A two-way ANOVA and LSD tests applied to former results show that the p-cresol in bio-oil alkaline solution is the main component although not the only one responsible for the increase in LCu. Both factors (dose and foaming agent), have a statistically significant effect on LCu. From these results it is reasonable to conclude that p-cresol is the most active component of bio-oil fraction 2FII.
Table 5: LCu obtained with alkaline bio-oil solutions at two doses
Exp. No Bio-oil Dose (g ton-1)
180 220 LCu
L1 L2 L3 L4
1 1FI 21.6 22.1 23.6 23.3
2 1FII 22.1 22.4 23.7 23.9 3 1FIII 19.0 20.0 21.3 22.0
4 2FI 20.9 22.0 23.5 23.2
5 2FII 24.1 24.5 25.3 25.7 6 2FIII 22.5 22.7 23.6 23.9
7 3FI 21.1 21.7 23.2 23.6
8 3FII 18.9 20.9 21.1 22.5 9 3FIII 16.3 15.2 21.6 20.8 ∗ L1 and L2 are replicates of the same dose
Table 6: Two-way ANOVA for LCu for types of alkaline solution and dose
Source of variation Sum of Squares Df* Mean Square F-ratio p-value
(A) Dose 36.69 1 36.69 118.67 0.0000
(B) Type of
alkaline solution 109.36 8 13.67 40.87 0.0000
AB 13.58 8 1.69 5.08 0.002
Residual 6.02 18 0.33
Total (corrected) 168.65 35
*Degrees of freedom
Table 7: LSD tests for LCu using different bio-oil alkaline solutions
Method: 95 % LSD
Contrasts Difference
2FII-1FI *2.25 2FII-1FII *1.88 2FII-1FIII *4.33 2FII-2FI *2.50 2FII-2FIII *1.73
2 F II-3FI *2.5
Table 8: Composition of alkaline phenol model solutions
Model solution Composition p-cresol %
PC pure p-cresol 100.0
FC1 p-cresol, phenol 67.0
FC2 p-cresol, phenol 80.0
2FII bio-oil fraction p-cresol, ethyl, and methoxy phenol 30.0
Table 9: LCu for phenol model solutions
Dose (g ton-1)
180 220
L1 L2 L3 L4
Model solution LCu
PC 21.13 20.35 22.95 22.65
FC1 13.32 13.72 20.77 20.89
FC2 16.19 16.6 21.07 21.12
2FII 21.91 21.85 23.86 23.66
*L1 and L2 are replicates of each dose
CONCLUSIONS
The foaming properties of alkaline pyrolysis bio-oil previously reported (BROSSARD and CORTEZ, 1997) are closely related to its phenol content and more specifically to its total phenol-to- levoglucosan mass ratio. When vacuum pyrolysis bio-oil is separated into fractions, this ratio varies and, consequently, a marked difference between the alkaline solutions prepared from them was noted. Bio-oil alkaline solutions with the highest total phenol-to-levoglucosan ratios are also the responsible for the highest LCu. Among the phenol constituents, p-cresol is the main responsible of this behavior. Although the fact that pure p-cresol shows results comparable to bio-oil 2FII fraction indicates that there exists some kind of synergistic effect with others bio-oil phenols For this reason it is more appropriate to consider total phenol-to-levoglucosan mass ratio as a predictor of good performance in increasing LCu.
It was also established that this foaming agent behaves better when added at 200 gton-1 of mineral. Preliminary estimates of the production cost of a ton of alkaline bio-oil remain at around 400 USD dollars. Compared with those for other foaming agents, such as pine oil, this could be an attractive alternative, especially if an optimization study using lower SABO doses is conducted.
ACKNOWLEDGEMENT
The authors would like to thank FAPESP and CAPES for the financial support, provided for this work.
NOMENCLATURE
ANOVA Analysis of variance Df: Degrees of freedom F-ratio F test for variances
2FIII Bio-oil fraction III in experimental condition 2
LCu Percentage of Cu in cupper flotation concentrates
L1 and L2 Replicates of LCu determination LSD Least significant difference p-value Real α value of a contrast
REFERENCES
Boucher, M. E., Chaala, A. And Roy, C. Bio-Oils Obtained by Vacuum Pyrolysis of Softwood Bark as a Liquid Fuel for Gas Turbines. Part 1: Properties of Bio Oil and its Blends with Methanol and Pyrolysis Aqueous Phase. Biomass & Bioenergy, 19, p. 337 (2000).
Brossard, L. E., Cortez, L. A. B, Penedo M., O. E. And Bezzon G. Vacuum Distillation of Slow Pyrolysis Bagasse Bio Oil. Energy for Sustainable Development, IV (2), p. 51 ( 2000). Brossard L. E And Cortez, L. A. B. Potential for the
Use of Pyrolytic Bio Oil from Bagasse in Industry. Biomass & Bioenergy, 12 (5), p. 363 (1997).
Diebold, J. P And Bridgwater, A. V. Overview of Fast Pyrolysis of Biomass for the Production of Liquid Fuels in Fast Pyrolysis of Biomass. A Handbook.; A. Bridgwater CPL Press, p. 14 (1999).
Diebold, J. And Scahill, J. Production of Primary Pyrolysis Oils in a Vortex Reactor“ in Pyrolysis Oils from Biomass, Soltes, E. J., Milne, T. A. (eds). ACS Symposium Series 376; American Chemical Society, p. 31 (1988).
Lomax, J. A., Commandeur, J. M., Arisz, P.W. And Scott, D.S. Characterization of Oligomers and Sugarring-Cleavage Products in The Pyrolysate of Cellulose. J. Anal. Appl.. Pyrol. 19, p. 65 (1991). Pakdel, H., Zhang H. G. And Roy, C. Detailed
Characterization of Biomass Pyrolysis Oils .Polar Fractions. In Advances in Thermochemical Biomass Conversion, AV. Bridgwater, Blackie London, p. 1068 (1994).
Penedo, M. MSc. Thesis, Efluentes de la Pirolisis Lenta al Vacio del Bagazo de Caña de Azúcar, Universidad de Oriente, Santiago de Cuba, p 45-50 (2000).
Radlein, D., Piskorz J. And Majerski, P. Method of Upgrading Pyrolysis Liquids for Use as Fuels and as a Source of Chemicals by Reaction with Alcohols, European Patent Appl. EP 0718392 (1996).
Radlein, D. The Production of Chemicals from Fast Pyrolysis Bio-Oils in Fast Pyrolysis of Biomass: A Handbook. A. Bridgwater, S. Czernik, J. Diebold, D. Méier, A. Oasmaa, C. Peacocke, J. Piskorz, D. Radlein. CPL Press, p. 164 (1999). Roy, C., Blanchette, D., Korving, L., Yang, J. And
De Caumia, B. Development of a Novel Vacuum Pyrolysis Reactor with Improved Heat Transfer Potential. In Bridgwater A.V., Boococks DGB. Developments in Thermochemical Biomass Conversion. London, UK: Blackie Academic and Professional, p. 351 (1997).
Shadix, C. R And Tennison, P. J. Effect of Char Content and Simple Additives on Biomass Pyrolysis Oil Droplet Combustion, 27th Symposium (International) on Combustion, The Combustion Institute (1998).
Yorgun, S., Sensoz, S. and Kocar, M. Characterization of the Pyrolysis Oil Produced in the Slow Pyrolysis of Sunflower-Extracted Bagasse, Biomass & Bioenergy, 20 p. 141 (2001).