Procedia Computer Science 64 ( 2015 ) 969 – 976
1877-0509 © 2015 Published by Elsevier B.V. This is an open access article under the CC BY-NC-ND license (http://creativecommons.org/licenses/by-nc-nd/4.0/).
Peer-review under responsibility of SciKA - Association for Promotion and Dissemination of Scientific Knowledge doi: 10.1016/j.procs.2015.08.615
ScienceDirect
Conference on ENTERprise Information Systems / International Conference on Project
MANagement / Conference on Health and Social Care Information Systems and Technologies,
CENTERIS / ProjMAN / HCist 2015 October 7-9, 2015
Detection of road accident accumulation zones with a visual
analytics approach
Luís Ramos
a,*, Luís Silva
b, Maribel Yasmina Santos
a, João Moura Pires
ba
ALGORITMI Research Centre, University of Minho, Azurém Campus, 4804-533 Guimarães , Portugal b
NOVA LINCS Lab, Universidade Nova de Lisboa, 2829-516 Caparica, Portugal
Abstract
Nowadays, road accidents are a major public health problem, which increase is forecasted if road safety is not treated properly, dying about 1.2 million people every year around the globe. In 2012, Portugal recorded 573 fatalities in road accidents, on site, revealing the largest decreasing of the European Union for 2011, along with Denmark. Beyond the impact caused by fatalities, it was calculated that the economic and social costs of road accidents weighted about 1.17% of the Portuguese gross domestic product in 2010. Visual Analytics allows the combination of data analysis techniques with interactive visualizations, which facilitates the process of knowledge discovery in sets of large and complex data, while the Geovisual Analytics facilitates the exploration of space-time data through maps with different variables and parameters that are under analysis. In Portugal, the identification of road accident accumulation zones, in this work named black spots, has been restricted to annual fixed windows. In this work, it is presented a dynamic approach based on Visual Analytics techniques that is able to identify the displacement of black spots on sliding windows of 12 months. Moreover, with the use of different parameterizations in the formula usually used to detect black spots, it is possible to identify zones that are almost becoming black spots. Through the proposed visualizations, the study and identification of countermeasures to this social and economic problem can gain new grounds and thus the decision-making process is supported and improved.
© 2015 The Authors. Published by Elsevier B.V.
Peer-review under responsibility of SciKA - Association for Promotion and Dissemination of Scientific Knowledge.
Keywords: Road traffic accidents; black spots; visual analytics
* Corresponding author. Tel.: + 351 925 829 769.
E-mail address: [email protected]
© 2015 Published by Elsevier B.V. This is an open access article under the CC BY-NC-ND license (http://creativecommons.org/licenses/by-nc-nd/4.0/).
1.Introduction
With the increase of the storage devices capacity, organizations and society tend to collect huge amounts of data, which, when analyzed properly, influence the way we deal with information and use this information in the decision-making process. Currently, the raw data collection is not a problem, but the ability to identify methods and models that can transform data into reliable information or knowledge is a challenge. As the capacity to collect and store data increases faster than our ability to make decisions based on that data, most of the time the data are stored without properly filtering, refinement and processing2. The excess of information has associated the danger of losing focus to the purpose we want to achieve1, either because the data may be irrelevant for a specific task or because it has been processed and/or displayed improperly.
Nowadays, road traffic accidents have become a serious social problem and require concerted efforts for effective and sustainable prevention, although the problem is still overlooked. Of all the systems that people have to deal every day, the road transport system is the most complex and dangerous. According to the World Health Organization and the World Bank11, traffic accidents are a major public health problem and is expected that they will increase if countries do not treat the road safety properly. Therefore, road accidents are an increasingly important phenomenon that needs to be studied either in Portugal or in any other country. The number of fatal victims in road accidents worldwide has increased between 2000 and 2011 in 300 000 people14. Without increased efforts and new initiatives, the total number of fatal and injured victims in road accidents is expected to increase by about 65% between 2000 and 2020, and for developing or underdeveloped countries is expected to increase up to 80% for fatal victims. Most of these deaths are currently among pedestrians, cyclists and motorcyclists11.
In 2011, road accidents occupied the 9th place in the main list of causes of death worldwide14, while in 2013 already occupied the 8th place, being the leading cause of death among young people between 15 and 29 years old13. Although the number of fatalities caused by road accidents has not increased between 2010 and 2013, in global terms, it remains an unacceptable value of 1.24 million fatalities worldwide13.
Portugal had in 1995 an expressive number of fatalities per million inhabitants, with 271 deaths, but in 2012 the number had fallen to 68 deaths, remaining still above the average of the European Union (EU) that is of 55 deaths6,7. This high accident rate has deserved a special attention from several authorities in Portugal, mainly by the National Road Safety Authority (ANSR), resulting in more prevention campaigns (speed, drink-driving and not wearing seat belts, etc.) and a stronger police action. Although in the last decade there have been significant improvements in Portugal in reducing accidents, there is still much more to do until we reach the traffic safety levels registered in other countries of the EU6.
In this work, this phenomenon is analyzed and studied using a Visual Analytics approach. According to Thomas and Cook12, Visual Analytics is the science of analytical reasoning facilitated by interactive visual interfaces. It combines automated analysis techniques with interactive visualizations for effective understanding, reasoning and decision-making based on sets of large and complex spatio-temporal data.
In this paper, a dynamic approach for the identification of road accident accumulation zones, here named black spots, based on Visual Analytics techniques is presented. Road accident accumulation zones represent a measure for identifying locations where there is a high concentration of road accidents, allowing the later analysis of these locations. The identification of black spots follows a set of fixed parameters of gravity and proximity between accidents, in a time period of a year ranging from January 1 to December 31. With Visual Analytics techniques the identification of black spots on sliding windows of 12 months is possible. Moreover, with the use of different parameterizations in the identification of black spots, it is possible to identify zones that are almost becoming black spots. The proposed approach presents as advantages not only the opportunity to tune the identification of black spots but also the possibility to track these spots and see when they are getting worse until the moment in which they really become black spots.
2.Related Work
There is not a clear and compiled framework to define and recognize a road accident accumulation zone, with different countries using different approaches and definitions. To identify road accident accumulation zones there are different approaches, such as analyzing historical data of traffic accidents, which includes the accident number method (using Poisson regression or negative binominal regression), accident rate method, quality control method15, accumulative frequency method, matrix method8, gray theory method17, time series analysis method, safety assessment regression method, accident rate coefficient method, approaches based on neural networks, spatial distribution9 and genetic algorithms16.
However, a new innovative method for identifying road traffic accidents black spots emerged5, focusing on the relationships between black spots and road elements, that divides the road chain in road sections (street segments) and intersections, in two different layers. Then statistical charts are constructed showing the distribution of the number of accidents and traffic volume for the different road elements and their types (e.g., one-way road, road level, among others). By analyzing the relationships, the main inducing causes for traffic accidents are identified. It is now interesting to mention an interesting study about the economic benefits of the reduction in crash rate developed in Western Australia10.
Although several works addressed the problematic of identification of black spots, none of them present a dynamic approach that is able to tune this process and monitor the evolution of this phenomenon.
3.Black Spots Identification and Characterization
For National authorities like ANSR, the detection of critical areas on public roads where there have been a certain number of accidents it is of upmost importance, as it allows the identification of locations that deserve special attention and, maybe, possible intervention by the corresponding authorities. The detection of critical areas is based in the records of car accidents and their consequences, data that is collected in the Statistics Bulletin of Traffic Accidents (Boletim Estatístico de Acidentes de Viação), filled at the time of the accident.
For ANSR, the identification of black spots considers a road segment with an extension up to 200 meters, in which there has been at least five accidents with human consequences (minor injuries, serious injuries or fatalities) in the year under analysis, and where the sum of the severity indicator of the accidents is equal or greater than 20, as shown in formula (1).
ܵ݁ݒ݁ݎ݅ݐݕܫ݊݀݅ܿܽݐݎ ൌ ͵ כ ݊ݑܾ݉݁ݎ݂݉݅݊ݎ݆݅݊ݑݎ݅݁ݏ +
ͳͲ כ ݊ݑܾ݉݁ݎ݂ݏ݁ݎ݅ݑݏ݆݅݊ݑݎ݅݁ݏ ͳͲͲ כ ݊ݑܾ݉݁ݎ݂݂ܽݐ݈ܽ݅ݐ݅݁ݏ (1)
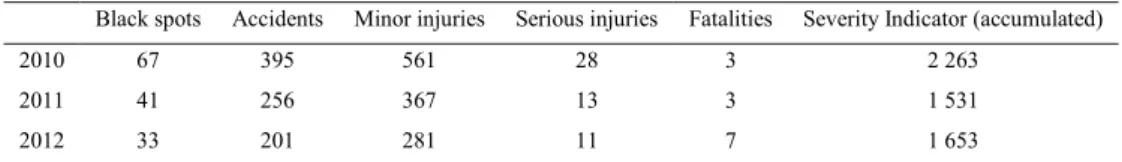
For the study presented in this paper, we used 25 596 records of accidents with victims provided by ANSR, occurred between January 2010 and December 2012, in Portugal. Each accident contains information about the route, mileage, date, human consequences, vehicles involved, among other information. According to ANSR data3,4, Table 1 shows the information of black spots by year.
Table 1. Black spots information between 2010 and 2012.
Black spots Accidents Minor injuries Serious injuries Fatalities Severity Indicator (accumulated) 2010 67 395 561 28 3 2 263
2011 41 256 367 13 3 1 531 2012 33 201 281 11 7 1 653
Besides being static, this method of identification of black spots has other limitations, as: i) it does not use different values for the number of accidents; ii) it does not use different values for the length of the track segment; iii) it does not consider different severity indicators to foresee zones that will become or can become a black spot; and, iv) it restricts the time window of the analyzed accidents to a calendar year.
4.Dynamic Identification of Black Spots with a Visual Analytics approach
As was described in the previous section, the identification of black spots usually follows a set of strict rules in what concerns the length of the road segments, the level of severity and so on. In this section, Visual Analytics is used as a basis for the automatic identification of black spots. The proposed approach allows two different perspectives: i) the possibility of specifying different values for the minimum requirements, and ii) the use of sliding windows of 12 months.
4.1.Minimum requirements specification
To study the sensitivity in the identification of black spots, it was decided to change, individually and combined, the minimum requirements actually used by ANSR (e.g., number of accidents, length of road segment and severity indicator).
Changing the minimum number of accidents allows detecting nearly black spots, because fulfill the same requirements of length of road segment and severity indicator of black spots, yet with fewer accidents. Changing the spatial extension allows detecting spots that require a length higher than 200 meters to become black spots, i.e., if in a segment of 210 meters there are five accidents with an aggregated severity indicator greater than 20, this zone will be classified as a black spot. Through this process, the length of the considered road segment could be enlarged to incorporate other accidents in the analysis. Lastly, changing the severity indicator parameter allows detecting spots that are not considered black due to the non-compliance of the minimum condition of the severity indicator, existing however five accidents, at least, in a 200 meters road segment. In these three cases, the spots that are identified are here named gray spots and are compared with the ones obtained using the black spots process.
In order to identify gray spots, seven different analyses were performed following the parameterizations shown in Table 2. Parameterization A is the default one, which corresponds to the values that are used in the identification of black spots (namely by institutions as ANSR).
Table 2. Parameterization of identification of black spots.
Parameterization A B C D E F G H Number of accidents 5 5 5 4 4 4 5 5 Length of road segment (meters) 200 300 400 200 300 400 200 variable Severity indicator 20 20 20 20 20 20 18 20
Parameterization G is the only parameterization where the minimum requirement for severity indicator is 18, distinct from parameterization A. In parameterization H, the gray spot identification ends when there is no other accident in the 200 meters that follow the last considered accident. It allows identifying an extension of the road where successive accidents occur with a maximum distance of 200 meters between them.
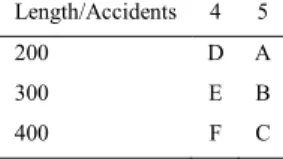
Table 3 shows the classification of the parameterizations regarding the number of accidents and the length of the road segment.
Table 3. Parameterizations classification considering the number of accidents and length of road segment. Length/Accidents 4 5
Using the defined values (Table 2), Table 4 presents the number of gray spots identified in each parameterization, by year.
Table 4. Amount of annual gray spots identified by each parameterization.
Year/Parameterization A B C D E F G H 2010 67 85 115 116 155 195 75 63 2011 41 72 93 77 118 151 48 41 2012 33 61 79 63 101 127 47 34 Total 141 218 287 256 374 473 170 138
In what concerns the number of accidents, when the number of accidents changes from 5 to 4, there is an increase, in average, in order of 82% for the 200 meters road segment (parameterizations A and D), 71% for the 300 meters road segment (parameterizations B and E) and 65% for the 400 meters road segment (parameterizations C and F). This means that the identification of gray/black spots seems to be sensitive to the number of accidents.
When changing the length of the road segment, considering a minimum of 5 accidents and increasing the road segment length from 200 to 300 meters (parameterizations A and B) there is an increase, in average, of 55%; 104% when considered an increase from 200 to 400 meters (parameterizations A and C) and 32% when increasing from 300 to 400 meters (parameterizations B and C). Again, the identification of black spots seems to be sensitive to the variation of the length of the road segment. However, with parameterization H (variable length of road segment), less spots were detected when comparing with the number of black spots identified by parameterization A in 2010 and 2011, where the number of near spatially black spots, which have been merged, is superior to number of new
gray spots detected for extensions with variable length.
When comparing parameterizations with a minimum number of 4 accidents (parameterizations D, E and F), the increase, in average, of the amount of gray spots identified between the 200 and 300 meters extension is 46%, 85% between 200 and 400 meters and 26% between 300 and 400 meters.
In average, the sensitivity of the minimum number of accidents for identifying black spots, and gray, is bigger when the minimum number of accidents is 5 (67%) (parameterization A), when comparing with 4 accidents (55%) (parameterization G), for the various extensions and averages of the three years.
The parameterizations used for the severity indicator show that when the minimum severity indicator decreases from 20 to 18 (parameterizations A and G) more 21% of gray points are identified, in average, when comparing with the black spots identified by parameterization 1, where the identification of black spots does not seem very sensitive to the severity indicator.
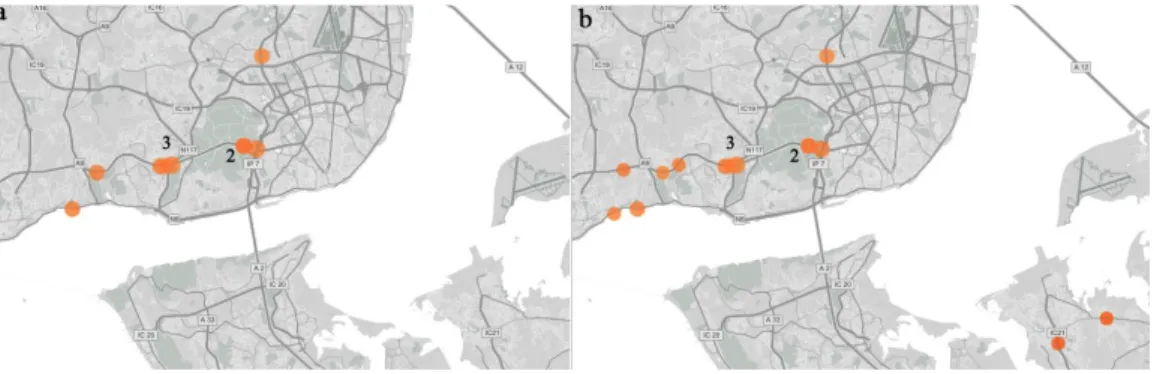
In Fig. 1 a), it is possible to see 9 black spots identified by the criteria used by ANSR. In Fig. 1 b) are presented 14 gray spots identified when the minimum number of accidents is reduced to 4, even using a minimum severity indicator of 20 and a maximum road segment length of 200 meters (parameterization D). Of these 14 gray spots, 9 are black spots considered in Fig. 1 a) and the remaining gray spots are possible future black spots.
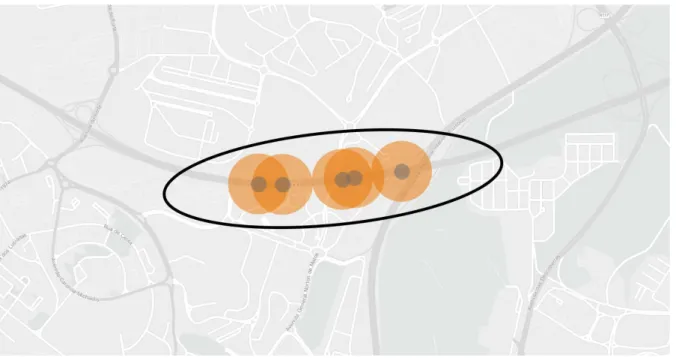
To study the evolution of identification of gray spots was identified the black (or gray) spot that shares all of your accidents with other gray spots that have more accidents beyond the shared ones. The gray spots that contain other black/gray spots were identified by a parameterization more flexible and embracing than that by which the black/gray spots contained were identified. In Fig. 2, it is presented 5 gray spots (gray points) contained in one
“super gray spot” (orange points), formed by a road segment where there is a chain of accidents with a maximum space between them of 200 meters.
Fig. 2. Gray spots (gray points) contained in a “super black spot” (orange points) in 2011.
4.2.Temporal sliding windows
Taking the parameterization used by ANSR for the identification of black spots, a 12 months sliding window was used. This allows the continuous visualization of the evolution of black spots over time without restricting the study to a calendar year. This concept is important because besides being an approximation to the reality of black spots, it allows portraying the temporal extension of the black spots, as a black spot can be formed within 30 days, information that is missed in a fixed annual window.
When using the standard parameterization, 141 different black spots were identified between 2010 and 2012, considering windows that match the calendar years. However, when considering sliding windows of 12 months, between January 2010 and December 2012, the number rises to 534 distinct black spots, some of them with shared accidents.
Fig. 3 shows the black spots of Portugal zoomed in the regions of Lisbon and Oporto, identified between June 2011 and May 2012 (red points). The figure also shows the displacement of the black spots from the previous sliding window (gray points), from May 2011 and April 2012.
Fig. 3. Black spots of consecutive sliding windows (June 2011 - May 2012).
5.Conclusions
This paper presented the identification of black spots using a dynamic approach that is able to use different parameterizations for the variables used in this identification, as well as is able to use sliding windows in this process.
The proposed process of changing the minimum requirements of black spots allows the identification of spots, which may be new when adjustments are made to the detection parameters. Thus, the results of this process are useful, as they allow studying the evolution of black spots and foresee when a road segment is going to become a black spot.
The temporal sliding windows allow a continuous visualization of the evolution of black spots in a 12 months perspective, without restricting the study to a fixed calendar year.
Future work will include the introduction of new visual analytics tools as time spirals, growing ring maps and space-time cubes, and the use of data mining algorithms for the identification of predictive models.
Acknowledgements
Altran Portugal and the team that cooperated with us in this project. Our work could not be possible without their help, knowledge and kind cooperation.
References
1. Andrienko G, Andrienko N, Demsar U, Dransch D, Dykes J, Fabrikant SI, et al. Space, time and visual analytics. International Journal of Geographical Information Science 2010;24(10):1577–1600.
2. Andrienko G, Andrienko N, Jankowski P, Keim D, Kraak M, Maceachren A, et al. Geovisual Analytics for Spatial Decision Support: Setting the Research Agenda. International Journal of Geographical Information Science 2007;21(8):839–857.
3. Autoridade Nacional de Segurança Rodoviária (2012). Sinistralidade Rodoviária (in Portuguese) – Ano de 2011. 4. Autoridade Nacional de Segurança Rodoviária (2013). Sinistralidade Rodoviária (in Portuguese) – Ano de 2012.
5. Chen H. Black Spot Determination of Traffic Accident Locations and Its Spatial Association Characteristic Analysis Based on GIS. Journal of Geographic Information System 2012;4(6):608-617.
6. European Commission (2013a). Road safety evolution in EU – Fatalities by population.
7. European Commission (2013b). Road Safety Vademecum. Road safety trends, statistics and challenges in the EU 2011-2012.
8. Hu SR, Wu KH. Accident Risk Analysis and Model Applications of Railway Level Crossings. Proceedings of the 11th International IEEE Conference on Intelligent Transportation Systems 2008;687-692.
9. Jinlin W, Xi C, Kefa Z, Wei W, Dan Z. Application of Spatial Data Mining in Accident Analysis System. 2008 International Workshop on Education Technology and Training & 2008 International Workshop on Geoscience and Remote Sensing 2008;472-475.
10. Meuleners LB, Hendrie D, Lee AH, Legge M. Effectiveness of the Black Spot Programs in Western Australia. Accident Analysis and Prevention 2008;40:1211-1216.
11. Peden M, Scurfield R, Sleet D, Mohan D, Hyder AA, Jarawan E, et al. World report on road traffic injury prevention. Geneva: World Health Organization; 2004. p.3-9.
12. Thomas JJ, Cook KA. Illuminating the Path: The research and development agenda for visual analytics. IEEE Computer Society Press
2005;1-184.
13. World Health Organization (2013a). Global Status Report on Road Safety 2013. Supporting a decade in action.. 14. World Health Organization (2013b). The top 10 causes of death.
15. Yulong P, Jianmei D. Improvement in the quality control method to distinguish the black spots of the road. Proceedings of the Eastern Asia Society for Transportation Studies 2005;5:2106-2113.
16. Yu-Zeng L, Dian-Ye Z. Arrangement distinguish method of traffic accident black spots based on the genetic algorithms. Journal of Transportation Engineering and Information 2005;2:1-7.