A Comparison between the Warren-Averbach Method and
Alternate Methods for X-Ray Diffraction Microstructure Analysis
of Polycrystalline Specimens
Bojan Marinkovica*, Roberto Ribeiro de Avilleza**, Alvaro Saavedrab,
Fernando Cosme Rizzo Assunçãoa
aDepartamento de Ciência dos Materiais e Metalurgia, Pontifícia Universidade
Católica do Rio de Janeiro, 22453-900-Rio de Janeiro - RJ, Brazil
bDepartamento de Química, Centro de Pesquisa da Petrobras,
Rio de Janeiro - RJ, Brazil
Received: November 11, 2000; Revised: April 18, 2001
The fundamental parameters approach is used to simulate the instrument contribution to the X-Ray diffraction profile. This procedure eliminates the need to experimentally prepare a reference sample of the studied crystalline material when using the Warren-Averbach method to investigate microstrutural parameters. The Warren-Averbach method is also compared to the Balzar and Enzo methods, two other popular methods of size-strain analysis. The analysis was carried out using bohmite powder having two different nominal average crystallite sizes, 80 Å and 200 Å. A 50%-50% mixture of these materials was used as a third sample. The proposed simulation procedure provides good results and is much faster to implement than the usual procedure that includes the preparation of a reference. For larger crystallite sizes, the results calculated from the Warren-Averbach method for the volume-weighted average crystallite size differs significantly from the ones obtained from the Balzar and Enzo methods. The limitations of the Balzar and Enzo methods are also discussed.
Keywords:X-ray diffraction, Warren-Averbach method, convolution profile fitting meth-ods, size-strain analysis, bohmite
1. Introduction
In the last five decades, defect structure analysis of polycrystalline materials by X-ray powder diffraction tech-nique has been able to cover a number of lattice imperfec-tions. They are often called size-strain analyses and usually include the evaluation of average crystallite sizes, crystal-lite size distributions, microstrains, dislocation densities and stacking fault probabilities. They are generally based on two different approaches1-3 and have been incorporating an impressively high number of modifications and nuances that is to hard too mention all of them4-10. Both approaches require a twofold task: the determination of the intrinsic (pure) physical diffraction line profile of the sample and, then, the extraction of the lattice imperfection parameters.
The first highly elaborated approach of size/strain analysis is Warren-Averbach method (known also as a Warren-Averbach-Bertaut method11) which employs the deconvolution Fourier-transform method (known also as the Stokes method) for the determination of the intrinsic physical line profile, followed by the Fourier method for evaluation of lattice imperfections1. This method states that the Fourier coefficients for intrinsic physical line profile are the product of two terms: the size and the strain coeffi-cient. The coefficients are numerically calculated. The method was initially proposed for application in the field of metals and alloys12-15, but rapidly was extend to the area of ceramic16 and also polymer materials17.
The second approach was outlined by Balzar2 and Enzo3 among other authorsand is based on the convolution
e-mail: *[email protected], **[email protected]
profile-fitting method as a tool for the extraction of the intrinsic physical diffraction line profile. The intrinsic line parameters extract in this manner, such as 2θ diffraction line positions, full width at a half maximum (FWHM), integral breadths and others, that define diffraction line shapes, are further used to calculate the Fourier transforms of intrinsic diffraction lines.
Balzar’s method uses the Voigt function and its Fourier transform to describe the intrinsic line profile, which is used to calculate both the size and strain coefficients proposed by Warren and Averbach. The advantages of Balzar’s method are that the Voigt function Fourier transform has an analytical form and the convolution of two Voigt func-tions is also a Voigt function, so size and strain coefficients could be analytically determined.
Enzo’s method uses a pseudo-Voigt function and its Fourier transform for the description of the intrinsic line profile. The size and strain coefficients are afterwards numerically determined following Warren-Averbach method.
The acceptance of the convolution profile-fitting meth-ods in the materials science community is very high due to the much less consuming time than the Warren-Averbach method, giving, nonetheless, trustful results. There are numbers of publications on lattice imperfection analyses using the second approach18-23. However, the Warren-Averbach method is still considered as the less biased one, because it does not assume any shape for the diffraction lines. At the other side, the second approach uses some analytical functions to describe the diffraction line shapes. Experimentally it has been showed that in the most cases satisfactory representation of diffraction lines is done by Voigt function, or by some of it approximations, pseudo-Voigt and Pearson VII. Nevertheless, excellent discussion on advantages and disadvantages of these two main direc-tions in size/strain analysis is given in the literature1,24,25.
The principal aim in this publication is to use the fundamental parameters26 profile fitting to simulate the instrument contribution and, therefore, reduce the time employed in the Warren-Averbach method. It will be com-pared with two different modifications of the second ap-proach described in the works of Balzar2 and Enzo et al.3
Further, it was briefly discussed the reliability of the sur-face-weighted and volume-weighted distribution functions to recognize eventual bimodal crystal size distribution in the polycrystalline specimens.
The bohmite, a material with orthorhombic structure, very important catalyst in the petroleum industry is used to demonstrate the method.
2. Theoretical Background
The dynamical diffraction theory of perfect crystal pre-dicts existence of very sharp diffraction lines with some
small inherent breadth, which results of the uncertainty principle27. Each diffraction line is also broadened, un-avoidably, by spectral dispersion and instrumental factors. However, every polycrystalline material with microstruc-ture consisting of grains less than 1 µm and some lattice imperfections (any type of point, line or planar defects) will show some additional broadening effect. The part of the diffraction line that is the consequence of the sample mi-crostructure is called, most frequently, physical diffraction line. Therefore, the shape and breadth of the experimental diffraction line are the mixture of different effects.
For the evaluation of microstructural (defect structure) parameters of interest in materials science and metallurgy, such as, average crystallite sizes, crystallite size distribu-tions, microstrains and some others, it is necessary to deal only with physical part of diffraction line.
The procedure of separation of the physical diffraction line from the experimental one, that is developed in this publication, is based on the simulation of spectral disper-sion and instrumental effects utilising the fundamental parameters (FP) approach26. It is a convolution adjusting
of the experimental diffraction lines, obtained from some kind of standard material, with functions related to the dimensions of the diffractometer, the physical variables of the specimen and the X-rays emission profile. The main instrumental parameters used for simulation are receiving-slit width, receiving-receiving-slit length, radius of the diffractome-ter, flat-specimen error function, X-ray target width, source length, sample size, primary and secondary soller slit an-gles, as proposed by Cheary and Coelho26. The advantage
of the fundamental parameters is the fact that they are nominally known for each X-ray diffraction equipment,
i.e., they are identifiable and measurable terms. Nonethe-less, they should be verified by profile fitting of the diffrac-tion pattern of some standard material. The LaB6, a standard
proposed by NIST2, was used and the value of the least
square refining weighted pattern R factor, Rwp, was lower
than 5.4, indicating high quality refining. Still, it is essential to mention that the NIST standard material specimen showed, in this occasion, some weak physical broadening due to existence of crystallites with average sizes of about 6000 Å. It is proposed to use the so-adjusted fundamental parameters of the standard specimen to generate ideal diffraction lines (containing just spectral and instrumental contributions) at the positions of interest for the investi-gated specimen. The bohmite peaks (0 2 0) and (0 8 0) were chosen to be used in Warren-Averbach method, since the crystallographic direction [0 1 0] is the only direction that provides secondary order lines required for this method. The intensities of so-generated peaks are irrelevant in the process of deconvolution28. Thus, the instrument is
ad-justed only once by the use of some standard material (it could be LaB6, Si, BaF2) and the parameters may be used
standard specimen for each new investigated material that could usually take a very long time. The step to obtain the ideal peak now could be successfully done in the matter of minutes. From this point the Warren-Averbach method proceeds in the classical manner1. However, the tedious calculation of Fourier coefficients is now facilitated by the interactive program Fourya29 that calculates the real and imaginary Fourier coefficients in the matter of seconds. Still, some useful and practical observations about the Warren-Averbach method will be provided during the dis-cussion.
3. Experimental
The X-Ray diffractometer was a Philips 1820, with CuKα radiation, acceleration tension of 40 kV and current of 30 mA, also equipped with a graphite monochromator and two Soller slits. The nominal diffractometer parameters are presented in Table 1.
Three specimens of bohmite with different nominal crystallite size distributions were investigated by X-ray diffraction technique. The first sample has the nominal monomodal distribution with nominal average crystallite size of 200 Å; the second one is also characterized by the nominal monomodal crystallite size distribution with nominal average crystallite size of 80 Å; the third one is the 50%:50% mixture of first two samples. These samples were kindly provided by CENPES-PETROBRAS and identified as stated previously. The nominal sizes were determined by the method developed by Saavedra and DeAngelis30. These three samples are recorded diffractometrically over the same 2θ range (7-65°), with 2θ step of 0.02° and acquisition time of 10 seconds per step, covering all bohmite diffrac-tion lines. The diffracdiffrac-tion lines from (020) to (231) were recorded also separately with the 20 seconds per step.
4. Results and Discussion
The FP approach provides a systematic way to generate a diffraction pattern for any crystalline material and a specific diffractometer, once a standard material, in this case, LaB6-NIST standard, has been fitted. Table 1
com-pares the nominal values for the equipment used in this research with the adjusted parameters by the Koalariet/X-Fit program26. It must be noted that the parameters sample length, radius and target size were not adjusted. The used target size, 0.1 mm, was found to provide a better fitting for the overall parameters than the nominal one by trial and error. Crystallite size and microstrain were also used in the fitting of the standard material, the fitting residual, Rwp, was
5.358 and the goodness of fit was 1.112. The simulation of the bohmite peaks at (0 2 0) and (0 8 0) was done assuming infinite crystallite size, zero microstrain and constant back-ground.
Figure 1 shows the peak (0 8 0) for the 200 Å nominal size specimen. It is clearly visible the overlap of the Kα1 and Kα2 for the experimental peak. The Fourier transform and deconvolution were easily done with the program Fourya29. The simulated equipment peak was used as the reference peak for the Stokes method for the deconvolu-tion. A linear background for the experimental peak was chosen, by trial and error, in such way that no downward concavity was observed for the first Fourier coefficients of the intrinsic physical line profile (deconvoluted profile). This procedure results in no “hook effect” in the size
Table 1. Comparison of the nominal diffractometer dimensions and adjusted dimensions determined by fitting the NIST standard material, LaB6.
Nominal diffractometer dimensions (Philips 1820) Receiving slit
width (mm)
Receiving slit length (mm)
Target size (mm)
Fixed divergence
angle
Sample length (mm)
Source length (mm)
Soller slits (degree)
Radius (mm)
0.2 17.5 0.2 1.0° 20.0 12.0 unknown 173
Adjusted diffractometer dimensions Receiving slit
width (mm)
Receiving slit length (mm)
Target size (mm)
Fixed divergence
angle
Sample length (mm)
Source length (mm)
Soller slits (degree)
Radius (mm)
0.1630 11.234 0.1 1.21° 20.0 11.963 3.848 173
Figure 1. Experimental and instrument X-ray diffraction profiles at
coefficients of the intrinsic diffraction line Fourier trans-forms.
Figure 2 shows the real part of the calculated Fourier transform of the peak (0 8 0) presented in Fig. 1 for the 200 Å nominal size specimen. The separation of the size and strain contributions was done by the classical Warren-Averbach approach, using the real parts of the Fourier transform of the intrinsic peaks (0 2 0) and (0 8 0). Figure 3 presents the size coefficients of the Fourier transform for the [0 1 0] crystallographic family direction in the 200 Å nominal size specimen. The same procedure was per-formed for the other samples.
The volume-weighted size distributions1,2 for the three specimens are presented in Fig. 4. The samples 80 Å and 200 Å were supposed to have a monomodal distribution. The sample 200 Å shows a very broad distribution. The mixture of these two samples looks definitely bimodal. The
surface-weighted size distributions for the same samples are shown in Fig. 5. All samples seem to be monomodal, but the samples 200 Å and “mixture” show a longer tail for larger crystallite sizes. The present results indicate that surface-weighted size distributions are not always capable to differentiate bimodal conditions. No consistent discus-sion has been provided in the literature for this topic. On the other hand, both Balzar and Enzo methods do not show any bimodal distribution for these samples, as one may notice from Fig. 6 which presents the crystal size distribu-tions obtained by these methods for the sample “mixture”. Benedetti et al.18 applied the Enzo’s method for a precipitated zirconia powder and observed a shoulder in the volume-weighted crystallite distribution function towards higher L values. This shoulder could be an indication of a bimodal distribution. However, they discarded their results assuming that they were due to a too large difference in the Gaussian content of the diffraction lines (1 1 1) and (2 2 2) used in the method. They did not realize that as long as the diffraction peak is well fitted, they were just using the
Figure 2. Real part of the Fourier transform for family direction [0 1 0]
for sample with nominal 200 Å crystallite size.
Figure 3. Size coefficients determined from the real part of the Fourier
transform for family direction [0 1 0] for sample with nominal 200 Å crystallite size.
Figure 4. Volume-weighted distributions as a function of crystallite sizes
for the three samples.
Figure 5. Surface-weighted distribution as a function of crystallite sizes
Warren-Averbach method which has no restrictions for calculation of multimodal distributions.
However, Balzar’s method is not able to show a bimo-dal distribution because the used Fourier transform ap-proximation for the Voigt function31 is an always decreasing function, which does not allow for a secondary peak.
The method proposed by Warren-Averbach makes no assumption about the form of the peak profile and the size coefficient, Enzo’s method restricts the peak profile to a pseudo-Voigt function, but the size coefficient is also cal-culated as in the Warren-Averbach method. Balzar’s method restrains the peak profile, the size and the strain coefficients to a Voigt function. Balzar’s and Enzo’s method separates the size and strain coefficient following Warren-Averbach. If A(L) is the Fourier transform for the intrinsic peak profile, then
A(L) = Asize(L).Astrain(s, L)
Asize(L) is the unknown size coefficient and the strain
coefficient is given by
Astrain(s, L) = exp( -2π2s2L2<ε2(L)>),
where s is the variable in reciprocal space, L is the column length of orthogonal diffracting planes and ε2(L) is the
mean-square strain, orthogonal to diffracting planes, averaged over the distance L.
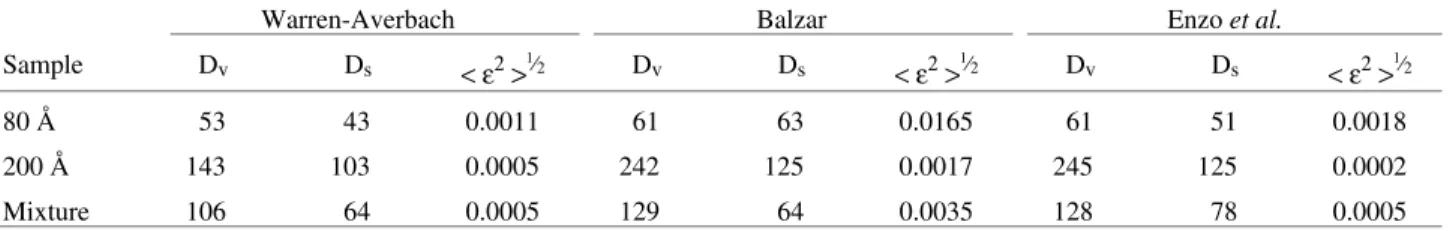
Table 2 presents the average crystallite sizes obtained from the surface and volume-weighted distributions, and the microstrain, <ε>21/2 for all three methods. All methods show the same trends. Although, it is clear that the micros-trains values determined through the Balzar method are almost one order of magnitude greater than the values obtained by the other two methods. The average crystallite sizes from the surface-weighted distributions are about the same for all three methods. Balzar and Enzo methods show almost identical average crystallite sizes from the volume-weighted distributions for all the specimens, but differ from the Warren-Averbach method for the 200 Å sample. Two possible complementary explanations are considered. Firstly, the convolution profiles employed by Balzar and Enzo do not correctly account for the intrinsic asymmetry of the profiles (due to the sample microstructure), while the Warren-Averbach method does not assume any shape for the diffraction lines24. Further, the sample with larger crys-tallite sizes has narrower intrinsic physical line profiles and, therefore, requires more Fourier coefficients to de-scribe the diffraction line than the analytical functions employed in the Balzar or Enzo convolution methods.
Figure 7 presents the root mean square averaged strain versus crystallite size for two samples. Specimen 200 Å shows almost constant strain values while the sample "mix-ture" shows the hyperbolic strain decrease, similar to that obtained by Balzar and Enzo methods, followed by strong oscillations. The Specimen 80 Å showed very strong oscil-lations for crystallite sizes greater than 25 Å, so it was not considered reliable. The behavior of strain, presented by the specimen 200 Å, was also observed by Alexandrov et al.32, which suggested to be caused by inhomogeneity in
the strain and reduction contribution from smaller crystal-lites possessing larger values of strain.
5. Conclusion
The proposed procedure to obtain an instrumental dif-fraction profile provides good results and is much faster to implement than the usual procedure that include the prepa-ration of a reference sample of the studied material with large crystalllite sizes and without microstrains.
Table 2. Comparison of the defect structure parameters determined by X-Ray Diffraction for three different approaches.
Warren-Averbach Balzar Enzo et al.
Sample Dv Ds <ε2>1⁄2 Dv Ds <ε2>1⁄2 Dv Ds <ε2>1⁄2
80 Å 53 43 0.0011 61 63 0.0165 61 51 0.0018
200 Å 143 103 0.0005 242 125 0.0017 245 125 0.0002
Mixture 106 64 0.0005 129 64 0.0035 128 78 0.0005
Mixture is a 50 w% of each nominal sample. Crystalite sizes are in Ångstrons. <ε2>1⁄2 calculated at D
v/2.
Figure 6. Comparison of the volume-weighted distributions determined
The volume-weighted crystallite size distribution is more capable to distinguish multimodal conditions than the surface-weighted crystallite size distribution.
For larger crystallite sizes, the results calculated from the Warren-Averbach method for the volume-weighted average crystallite size differs significantly from the ones obtained from the Balzar and Enzo methods.
The results obtained for the microstrains presented the same trends, but the values from the Balzar method are one order of magnitude higher than the values of the other two methods.
Even though the Warren-Averbach method is more involved and tedious to execute, it does provide more consistent data and is capable to distinguish bimodal distri-butions.
Acknowledgements
This work was supported by PETROBRAS, CNPq and FAPERJ.
References
1. Warren, B.E. X-ray Diffraction, Addison-Wesley, Reading, 1969.
2. Balzar, D. J. Res. NIST, v. 98, n. 3, p. 321-353, 1993; Balzar, D. Croatica Chemica Acta, v. 69 p. 3, p. 1069-1115, 1996. 3. Enzo, S.; Fagherazzi, G.; Benedeti, A.; Polizzi, S. J. Appl.
Cryst., v. 21, p. 536-542, 1988.
4. Louer, D.; Auffrédic, J.P.; Langford, J.I.; Ciosmak, D.; Niepce, J.C. J. Appl. Cryst., v. 16, p. 183-191, 1983. 5. Langford, J.I. J. Appl. Cryst., v. 11, p. 10-14, 1978. 6. Keijser, Th.H. de.; Langford, J.I.; Mittemeijer, E.J.; Vogels,
A.B.P. J. Appl. Cryst., v. 15, p. 308-314, 1982.
7. Berkum, J.G.M. van.; Vermeulen, A.C.; Delhez, R.; Keijser, Th.H. de.; Mittemeijer, E.J. J. Appl. Cryst., v. 27, p. 345-357, 1994.
8. Vogel, W.; Haase, J.; Hosemann, R. Z. Naturforschg., v. 29, p. 1152-1158, 1974.
9. Sánchez-Bajo, F.; Cumbrera, F.L. J. Appl. Cryst., v. 30, p. 427-430, 1997.
10. Takahashi, H. J. Phys. Soc. Jpn., v. 27, p. 708, 1969. 11. Audebrand, N.; Magnenet, C.; Auffrédic, J.P.; Louer, D.
Mat. Sci. Forum, v. 321-324, p. 1034-1039, 2000. 12. McKeehan. M.; Warren, B.E. J. Appl. Phys., v. 24 n. 1,
p.52-56, 1953.
13. Williamson, G.K.; Smallman, R.E. Acta Cryst., v. 7, p. 574-581, 1954.
14. Aqua, E.N.; Wagner, C.N.J. Phil. Mag., v. 9, p. 565-589, 1964.
15. Sen, R.; Chattopadhyay, S.K.; Chatterjee, S.K. Metall. Ma-ter. Trans. A, v. 29, p. 2639- 2642, 1998.
16. Louer, D.; Vargas, R.; Auffrédic, J.P. J. Amer. Cer. Soc., v. 67 n. 2, p. 136-141, 1984.
17. Crist, B.; Cohen, J.B. J. Polym. Sci., v. 17, p. 1001-1010, 1979.
18. Benedeti, A.; Fagherazzi, G.; Enzo, S.; Battagliarin, M. J. Appl. Cryst., v. 21, p. 543-549, 1988.
19. Balzar, D.; Ledbetter, H.; Roshko, A. Powd. Diffraction, v. 8, n. (1), p. 2-6, 1993.
20. Balzar, D.; Stephens, P.W.; Ledbetter, H.; Li, J.; Dunn, M.L.
Mat. Res. Soc. Symp. Proc., n. 453, p. 715-720, 1997. 21. Hurley, D.C.; Balzar, D.; Purtscher, P.T.; Hollman, K.W. J.
Appl. Phys., v. 83 n. 9, p. 4584-4588, 1998.
22. Marinkovic, B.A.; Zakula, Z.V.; Sreckovic, T.; Tomasevic, M.; Ristic, M.M. Cryst. Res. Technol., v. 34 n. 7, p. 881-889, 1999.
23. Balzar, D.; Ledbetter, H. Adv. in X-ray Analy., v. 39,p. 457-464, 1997.
24. Klug, H.P.; Alexander, L.E. X-ray Diffraction Procedures for Polycrystalline and Amorphous Materials, J.Wiley & Sons, New York, 1974.
25. Snyder, R.L.; Fiala, F.; Bunge, H.J. Defect and Microstruc-ture Analysis by Diffraction, International Union of Crystal-lography - Oxford University Press, New York, 1999. 26. Cheary, R.W.; Coelho, A. J. Appl. Cryst., v. 25, p. 109-121,
1992.
27. Young, R.A. The Rietveld Method, International Union of Crystallography - Oxford University Press, New York, 1993.
28. Guinier, A. X-ray Diffractions in Crystals, Imperfect Crys-tals, and Amorphous Bodies, Dover Publications, Inc., New York, 1994.
29. Cheary, R.W.; Coelho, A. Fourya - Line Profile Fourier Analysis Program, Version 4.2, 1996.
30. Ganesan, P.; Kuo, H.K.; Saavedra, A.; DeAngelis, R.J. J. Catalysis, v. 52, p. 310-320, 1978.
31. Selivanov, V.N.; Smislov, E.F. Zavod. Lab., v. 57, p. 28, 1991.
32. Alexandrov, I.V.; Zhang, K.; Lu, K. Ann. Chim. Fr., v, 21, p. 407-416, 1996.
Figure 7. Root mean square averaged strain versus crystallite size