Article
J. Braz. Chem. Soc., Vol. 23, No. 1, 32-38, 2012. Printed in Brazil - ©2012 Sociedade Brasileira de Química 0103 - 5053 $6.00+0.00
A
*e-mail: [email protected]
Pt L
2,3- Edge
X-ray Absorption Spectroscopy Investigation of Zerovalent
[Pt(PPh
3)
2(
η
2-L)] {L = C
2
H
4, C
60and C
2(CN)
4} Compounds
Gilson H. M. Dias,a Nazareth F. da Fonsecab and Marcelo H. Herbst*,b
aInstituto de Química, Universidade Estadual de Campinas, CP 6154, 13083-970 Campinas-SP, Brazil
bDepartamento de Química, Universidade Federal Rural do Rio de Janeiro, 23890-000 Seropédica-RJ, Brazil
Espectros de absorção de raios X nas bordas L2,3 da platina (Pt) de três compostos [Pt(PPh3)2(η2-L)] {L = C2H4, C60 and C2(CN)4} foram obtidos. As bandas de absorção observadas
são efetivas para mensurar a força π*-ácida dos ligantes olefínicos (L) coordenados ao fragmento
Pt(PPh3)2. As energias dos orbitais dπ, determinadas quantitativamente pela diferença entre
os deslocamentos das inflexões das bordas e de seus máximos nas linhas brancas L2,3 nas segundas derivadas dos espectros, seguem a ordem [Pt(PPh3)2(η2-C2H4)] < [Pt(PPh3)2(η2-C60)] <
[Pt(PPh3)2{η2-C2(CN)4}]. Essas energias dos orbitais dπ estão em concordância com as alterações
nos comprimentos de ligação das olefinas livres e coordenadas, e com os deslocamentos químicos de coordenação no espectro de RMN de 31P dos compostos. Além disso, os valores experimentais
concordam com resultados teóricos obtidos para as energias de interação de orbitais dπ calculados no nível de funcional de densidade para compostos modelo [Pt(PH3)2(η2-L)].
X-ray absorption spectra at the PtL2,3-edges have been measured for three [Pt(PPh3)2(η2-L)]
{L = C2H4, C60 and C2(CN)4} compounds. The spectral features are effective for measuring the
π*-acid strength of ligands (L) coordinated to the Pt(PPh3)2 fragment. The energies of the dπ-orbitals
are quantitatively determined using the difference between the edge jumping and the edge maximum shifts of the L2,3-white lines in the second derivatives of the spectra. The dπ-orbital energies follow
the order [Pt(PPh3)2(η2-C2H4)] < [Pt(PPh3)2(η2-C60)] < [Pt(PPh3)2{η2-C2(CN)4}]. These dπ-orbital
energies are in good agreement with the changes in the bound olefinic carbon bond lengths and the 31P NMR chemical shifts of the coordinated phosphines. Furthermore, the experimental values
are in good agreement with available dπ-orbital interaction energy terms calculated using density
functional theory for model [Pt(PH3)2(η2-L)] compounds.
Keywords: Pt L2,3-edge XAS, zerovalent platinum compounds, π back-donation energy,
spectral decomposition
Introduction
X-ray absorption spectroscopy(XAS) is a powerful tool for characterising the electronic and structural properties of coordination complexes. Modern synchrotron radiation facilities make XAS an attractive experimental method for studying several absorbing transition metals.1 XAS
has the ability to probe both occupied and unoccupied 5d valence orbitals through studying the region of the PtL2,3
edges. Two absorption peaks (white lines) are observed at L3- and L2-edges and are split largely due to spin-orbit
coupling. The L2,3-edges identify the valence 5d-charges of the Pt center in accordance with the selection rules for
the photoabsorption process (∆l = ± 1 and ∆J = 0, ± 1). Because electrons are ejected from the 2p, J = 3/2, inner
orbitals, the L2 edge probes only the d-final orbitals that are
characterised by J = 3/2, whereas the L3 edge probes those d
orbitals with J = 3/2 and 5/2. The allowed 2p → 6s electric dipole transition is not observed because of the small spatial overlap between the 2p and the 6s wave functions.2 For
metals with a closed shell d10 configuration, the spectrum
is a simple arctangent curve, which reflects the ejection of the electrons restricted to the core orbitals of the continuum Fermi-Sommerfeld levels.3 A very nearly filled 5d
3/2 state at
the L2 edge of Pt metal and its small clusters results in an insignificant d valence band contribution.4 Consequently,
orbitals, the valence-charge redistribution of a closed-shell d10-metal upon alloy formation results in the emergence of
prominent white lines at the L-edges. These absorptions provide useful signatures for d-charge depletions from the metal sites.5 Therefore, these white lines are a key feature
for interpreting the Pt L2,3 XAS spectra of zerovalent
platinum compounds.
Because the Pt L-edges directly probe the unoccupied 5d valence orbitals, assembling the correct information regarding the molecular orbitals would be useful, particularly considering that the coordination of side-on unsaturated ligands to a metal results in vacant d-orbitals on the metal center. The classical Dewar-Chatt-Duncanson model,6 shown in Scheme 1, states that the occupied
π orbitals on the ligands donate electron density to the unoccupied s- or d-orbitals (or sd-hybrids) of the metal (σ-donation)simultaneously with back-donation of electron density from occupied metal d orbitals to the empty π* orbital of the ligand (π back-donation). As a consequence, the carbon-carbon bond distance of the alkene ligand increases as a result of both decreased electron density in the bonding π-orbital and increased electron density in the antibonding π*-orbital.
The compounds [M(PH3)2(η2-L)] {M = Ni, Pd, Pt;
L = C2H4, C60, C2(CN)4}, which are model compounds
for [Pt(PPh3)2(η2-L)], have been the subject of study by
several theoretical approaches.7-9 The upper valence levels
of the bent C2v Pt(PH3)2 fragment have two available filled
b1 and b2 platinum orbitals of dπcharacter. The π
back-donation to the lowest unoccupied orbital (LUMO) of the ligand, which has π* character, mainly involves the highest occupied (HOMO) b2 orbital. The HOMO lies in
the PtC2 plane, whereas the electron density donation from
the filled HOMO π orbital of the ligand flows mainly into the 6s-6pz platinum LUMO of a1 symmetry (σ donation).
Previous studies on [Pt(PH3)2(η2-L)] have identified
that the major part of the covalent bonding energy term stems from π back-donation to the alkene ligand, which is particularly dependent on the position of the ligand π* energy level and the relativistic destabilisation of the Pt 5d valence orbitals.9
The rather unexpected experimental result of prominent white lines at L2,3-edges within the structurally similar
compounds [Pt(PPh3)2(η2-L)], shown in Scheme 2,allowed
us to gain further insight into their chemistry.
We concentrate our study on the bond energy differences that result in the white lines in XAS spectra as a contribution to the development of a more efficient method in predicting the relative magnitude of the electronic density in such metal centers.10 This method is based on the decomposition
of the second derivative XAS spectra by using a rather simple model formed by an arctangent step function added to a Lorentzian function. Our results demonstrate that in analysing XAS spectra of organometallic compounds, in which electronic changes at the metal center are usually small, addressing only the absorption spectra is not sufficient; the second derivative provides a better means for accessing reliable data.
Results and Discussion
The white lines at the absorption edges are especially sensitive to the lifetime of the core holes as well as the localisation and hybridisation of the valence d orbitals. The absorption area, which stems from white lines, is often used for developing semi-quantitative estimations of the unoccupied levels of open d-shell metals. The usual method to obtain the area is by integrating the difference between the white lines and arctangent curves.11 The arctangent
background spectrum of a closed-shell d10-metal, or a metal
with an insignificant d valence band contribution to the white line, partially minimises the uncertainty that arises from the calibration using the EXAFS (extended X-ray absorption fine structure) oscillations. Another reliable Scheme 1. Ligand σ donation to metal (a1←π) and metal to ligand
π back-donation (b2→π*), according to the orbital interactions in the
Dewar-Chatt-Duncanson model.
Scheme 2. Typical structure of the [Pt(PPh3)2(η2 L)] compounds, showing
the crowd of triphenylphosphine ligands. The central tetrahedron shows the coordination of both olefin and phosphine ligands to the Pt atom.
Scheme 2. Typical structure of the [Pt(PPh3)2(η2-L)] compounds, showing
method for analysing XAS spectra is the decomposition of the white line into an absorption curve (usually a Lorentzian or a Voigt function) and an arctangent function, although this method can produce more than one result that matches the experimental data. In the refinement of nonlinear functions, white lines are fit to a combination of Lorentzian functions to model the absorption curve of the localised states and the remaining step-like arctangent function for the oscillatory components of the continuous states.12 Thus, the decomposition method corresponds
to the non-linear least-square fitting of the experimental data to a combination of a Lorentzian (or Voigt) and an arctangent functions. However, one must be aware that peak fitting is an empirical analysis method, and that the line shapes used to fit the experimental spectrum have little physical meaning. Thus, peak fitting should be used for semi-quantitative purposes, such as the relative variation of spectral features of similar compounds. Instrumental limitations, such as the thickness effect,13 and the absence
of a genuine arctangent function are other factors that can affect the results adversely in both methods. In this work we have used both the decomposition method and the subtraction of metallic gold XAS spectrum method. The decomposition method was best suited, concerning the fitting of the edge jumping (E0) and the possibility of
obtaining the fit of the second derivative of the spectra. Figure 1 shows that the Pt L3-XAS spectra of
[Pt(PPh3)2(η2-L)] compounds share similar features.
Relatively strong and narrow white lines arise at the edge and are followed by deep EXAFS oscillations. In addition to the L3 white line, a pronounced L2 white line (not shown)
was also observed, reflecting an unfilled d3/2 characteristic
for this edge. The proportional broadening of both edges was estimated by the L3/L2 area ratio, which reflects the
contribution of the J = 3/2 and 5/2 hole populations.14
This ratio is calculated by taking the integrated areas underneath the full Lorentzian peaks fit to the L3 and L2
edge spectra and dividing them in the form AL3/AL2. The
values of AL3 and AL2 and of the area ratios are listed in
Table 1. The area ratios are related to the d count in the sequence [Pt(PPh3)2(η2-C2H4)] < [Pt(PPh3)2(η2-C60)] <
[Pt(PPh3)2{η2-C2(CN)4}] (Table 1). As a consequence of
a large contribution of d3/2 state to both edges, the L3 edge
was used in conjunction with L2 to obtain more reliable
values in the next stage.15
The spectral interpretation of the white lines, consistent with a quantitative description for the binding energy, was guided by the edge jumping energy (E0), located in the
inflection point at the rising edge, and the edge maximum (Emax) of the white line. For most typical complexes, it
has been assumed that only the HOMO is involved at the
E0, whereas the Emax reflects the LUMO holes in an MO
description.16 Moreover, the E
max shifts to a higher energy
concomitantly with the white line broadening. As a result, the difference between Emax and E0 has an approximate value of
the half-width of the raising edge.17 The HOMO is naturally
located in the E0 for the particular case of [Pt(PR3)2L]
compounds, while the Emax reflects the holes created mainly
on the b2-hybrid orbitalby back-bonding into the relatively
localised LUMO. Therefore, the ∆Eπ = Emax – E0 can be
related to the dπ-orbital interaction energy.The main edge
feature of [Pt(PPh3)2(η2-L)] compounds is the broadening of
the white-line in the XAS spectra (Figure 1), which is more Figure 1. Experimental normalised Pt L3-edge XAS absorption spectra of
[Pt(PPh3)2(η2-L)] compounds (small circles) plotted with the decomposed
model spectra (solid line) and the model component curves (dashed line, Lorentzian curve; dotted line, arctangent curve). (a) [Pt(PPh3)2(η2-C
2H4)],
distinguishable as a doublet growth in the second derivative spectra shown in Figure 2.
The splitting observed in the second derivative of the XAS spectrum is influenced by the degree of vacancy in 5d levels. With regard to this spectral pattern, the experimental and deconvoluted second derivatives were used as guides in determining the energy positions of peaks more accurately.18 Table 1 presents selected results
for the Pt L2,3-edges XAS and relevant ancillary data for
the [Pt(PPh3)2(η2-L)] compounds.
The energy values listed in Table 1 are as expected, where ∆Eπ is related to both the elongation parameter (∆R) and the coordination chemical shift (∆P), calculated from literature data for free and coordinated ligands listed in Table 2.
In Figure 3, significant trends are observed. The plot of ∆Eπ against ∆R follows the usual order [Pt(PPh3)2(η2-C2H4)] < [Pt(PPh3)2(η2-C60)] < [Pt(PPh3)2{η2-C2(CN)4}], which can
be explained by the strength of the dπ back-donation
interaction.
The progressive destabilisation of the b2-type dπ donor
orbital level, as the energy level of the olefin LUMO in Pt(PPh3)2 moiety decreases, will decrease the dπ−π* energy
gap. Because ∆P is inversely proportional to ∆Eπ, the 31P chemical shift of the bonded PPh3, which is upfield relative
to the free molecule, indicates that the energy of the HOMO b2 orbital increases. This fact is expected in view of the
σ-donor properties of the lone pair orbital on the ancillary PPh3 ligands, which mixes in an antibonding manner with
Figure 2. Second derivatives of the normalised Pt L3-edge XAS spectra of
[Pt(PPh3)2(η2-L)] compounds (small circles) plotted with the decomposed
second derivatives spectra (solid line). The symbols for lorentzian and arctangent curves are the same of those in Figure 1. (a) [Pt(PPh3)2(η2-C2H4)],
(b) [Pt(PPh3)2(η2-C
60)] and (c) [Pt(PPh3)2{η2-C2(CN)4}].
Table 1. Selected results of the Pt L2,3-edges XAS and the relevant ancillary data for [Pt(PPh3)2(η2-L)] {L = C2H4, C60, C2(CN)4)}
Compound AL3a AL2a Rb ∆Eπ L3 ∆Eπ L2 ∆Eπ
c ∆E
t d ∆Re ∆Pf
[Pt(PPh3)2(η2-C2H4)] 8.28 4.61 1.8 3.5 3.3 3.40 3.19 0.095 39.6
[Pt(PPh3)2(η2-C
60)] 8.42 3.81 2.2 4.9 4.8 4.85 4.60 0.119 31.8
[Pt(PPh3)2(η2-C
2(CN)4)] 8.72 3.47 2.5 6.7 6.3 6.50 5.81 0.180 20.9
aAreas at L
3 (mean ± 0.2) and L2 (mean ± 0.4) edges in eV per cm2. bArea ratio AL3/AL2. cAverage L2,3 edges energy ∆Eπ = Emax – E0 (mean ± 0.03) in eV. dSum ∆E
t = EB2 + EB1 in eV from Nunzi et al.8eElongation parameter ∆R. Difference between the carbon-carbon bond lengths of coordinated and free
molecules in angstroms. fDifference between the chemical shifts of 31P coordinated and 31P of free PPh 3 in ppm.
Table 2. Collected literature data for free and coordinated ligands
Molecule C-C bond
distance / Å d
31P NMR /
ppm
Reference
C2H4 1.339(5) - 19
C60 1.383(4) - 20
C2(CN)4 1.67 - 21
PPh3 - −5.6 22
[Pt(PPh3)2(η2-C
2H4)] (1) 1.434(13) 34.0 (CD2Cl2) 23
[Pt(PPh3)2(η2-C60)] (2) 1.502(30) 26.2 (CD2Cl2) 28
[Pt(PPh3)2{η2-C
Figure 3. Plot of the energy, ∆Eπ, versus∆P and∆R. Experimental
uncertainties in bond distances are in the 0.01 Å range, in 31P chemical
shifts are 0.1 ppm, following the original reports. Uncertainties in ∆Eπ are 0.03 eV. The dashed lines indicate the trend in the data.
the antisymmetric b2 combination. The predicted amount
of charge withdrawn from the Pt(PPh3)2 fragment by
back-donation is greater for the tetracyanoethylene ligand in [Pt(PPh3)2(η2-L)] complexes. The ethylene ligand removes
approximately half the amount of tetracyanoethylene, whereas fullerene-60 withdraws an intermediate amount.
It is noteworthy that the XAS data are in good agreement with the results of a density functional theory calculation that has been performed on model complexes.25 Theoretical
procedures decompose part of the total binding energy of [(PH3)2Pt(η2-L)] complexes into the orbital interaction term
energy Eorb = EA1 + EB2 + EB1. The energy contributions from
the two synergistic bonding modes originate from stabilising interactions between occupied and virtual orbitals of separate (PH3)2Pt and L fragments, corresponding to σ donation (EA1)
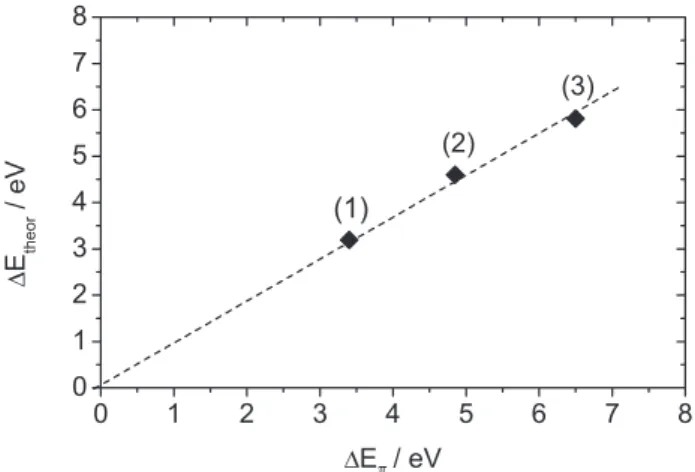
and to π back-donation (∆Et = EB2 + EB1).26 The theoretical contribution of the sum of the d-hybrid orbitals, which are depopulated upon coordination, ∆Et, was plotted against the experimental ∆Eπ in Figure 4.
Figure 4. The relationship between ∆Eπ and ∆Etheor. Extrapolation of the
line to the zero intercept indicates the trend in the data.
The convergence of the resulting line and the hypothetical zero point energy suggests that this point would fall in the line. Because PH3 is used as model for
PPh3 in the ∆Et calculation, the π-acceptor properties of the
phosphine ligand are neglected. Energy values between the experimental ∆Eπ and the theoretical ∆Et, which are smaller
than 1 eV in Table 1, can be related to back-donation to the d orbital of the phosphorus atom.
Experimental
Preparation of complexes
The [Pt(PPh3)2(η2-C2H4)] (1),27 [Pt(PPh3)2(η2-C60)] (2)28
and [Pt(PPh3)2{η2-C2(CN)4}] (3)29 complexes were
synthesised as described elsewhere and stored under argon prior to use.
X-ray absorption spectroscopy measurements and data analysis
The experimental spectra at the Pt L2,3 edges were
recorded at the National Synchrotron Light Laboratory (LNLS, Campinas, SP, Brazil), using the synchrotron radiation at an energy of 1.37 GeV with an average ring current of 120 mA. The Pt L2,3-edgeXAS spectra were
measured on the XAFS I station equipped with a double crystal Si(220) monochromator in transmission mode and two silicon crystals that were slightly detuned to avoid higher harmonics. The XAS data were collected with a 1s accumulation time per point and an energy increment of 0.5 eV in transmission mode at room temperature by using two ionisation chambers filled with argon and measuring the incident (monitor) and transmitted (detector) beam intensity. The powder samples were pasted on a grid carved on a lead metal sheet and capped with Kapton tape. The spectrum of a 7.5 µm platinum metal foil was recorded before and after each XAS spectrum to check energy calibration. All spectra were normalised to unity in the continuum absorption across the absorption edges, such that the step heights coincide.
Conclusions
Pt L2,3 XAS proved to be a powerful quantitative tool
for probing the energy of vacant d-orbitals in the triad of compounds [Pt(PPh3)2(η2-L)] {L = C2H4, C60, C2(CN)4},
ligands increases in the order [Pt(PPh3)2(η2-C2H4)] <
[Pt(PPh3)2(η2-C60)] < [Pt(PPh3)2(η2-C2(CN)4)]. It is
important to note that for obtaining reliable data from the XAS spectra of organometallic compounds, it is more appropriate to employ the second derivative spectral decomposition than the absorption spectrum itself, due to the usually small changes in electronic density upon complex formation. Finally, the XAS data act as a good reference for the density functional theory data, showing that the differences in the entire binding energy resulting from the approximation of PPh3 with PH3 are
not negligible.
Acknowledgments
We thank the Fundação de Amparo à Pesquisa do Estado de São Paulo (FAPESP) for support of this research (grant 97/11567-7). This work was also partially supported by LNLS. Authors are grateful to an anonymous referee for valuable suggestions.
References
1. Bianconi, A.; Garcia, J.; Benfatto, M.; Top. Curr. Chem.
1988, 145, 29; Bianconi, A. In X-Ray Absorption: Principles, Applications, Techniques of EXAFS, SEXAFS and XANES;
Koningsberger, D. C.; Prins, R., eds.;Wiley: New York, 1988; Penner-Hahn, J. E.; Coord. Chem. Rev. 1999, 192, 1101.
2. Pantelouris, A.; Küper, G.; Hormes, J.; Feldmann, C.; Jansen, M.; J. Am. Chem. Soc. 1995, 117, 11749; Brown, M.; Peierls,
R. E.; Stern, E. A.; Phys. Rev. B: Condens. Matter Mater. Phys.
1977, 15,738; Hitchcock, A. P.; Wen, A. T.; Rühl, E.; Chem. Phys. 1990, 147, 51.
3. Richtmyer, F. K.; Barnes, S. W.; Ramberg, E.; Phys. Rev. 1934,
46, 843.
4. Ramaker, D. E.; Mojet, B. L.; Oostenbrink, M. T. G.; Miller, J. T.; Koningsberger, D. C.; Phys. Chem. Chem. Phys.1999, 1, 2293.
5. Behrens, P.; Assmann, S.; Bilow, U.; Linke, C.; Jansen, M.;
Z. Anorg. Allg. Chem. 1999, 625, 111; Behrens, P.; Solid State
Commun. 1992, 81, 235; Naftel, S. J.; Bzowski, A.; Sham, T. K.;
J. Alloys Compd.1999, 283, 5; Drube, W.; Treusch, R.; Sham,
T. K.; Bzowski, A.; Soldatov, A. V.; Phys. Rev. B: Condens. Matter Mater. Phys. 1998, 58, 6871; Jeon, Y.; Qi, B. Y.; Lu, F.;
Croft, M.; Phys. Rev. B: Condens. MatterMater. Phys. 1989,
40, 1538.
6. Dewar, M. J. S.; Bull. Soc. Chim. Fr. 1951, 18, C79; Chatt, J.; Duncanson, L. A.; J. Chem. Soc. 1953, 2939.
7. Albright, T. A.; Hoffmann, R.; Thibeault, J. C.; Thorn, D. L.;
J. Am. Chem. Soc. 1979, 101, 3801; Ziegler, T.; Inorg. Chem.
1985, 24, 1547; Morokuma, K.; Borden, W. T.; J. Am. Chem. Soc.
1991, 113, 1912; Nunzi, F.; Sgamellotti, A.; Re, N.; Floriani, C.;
J. Chem. Soc., Dalton Trans. 1999, 3487; Uddin, J.; Dapprich,
S.; Frenking, G.; Yates, B. F.; Organometallics1999, 18, 457. 8. Fujimoto, H.; Nakao, Y.; Fukui, K.; J. Mol. Struct. 1993, 300,
425; Koga, N.; Morokuma, K.; Chem. Phys. Lett. 1993, 202, 330; Lichtenberger, D. L.; Wright, L. L.; Gruhn, N. E.; Rempe, M. E.; J. Organomet. Chem. 1994, 478, 213; López, J. A.; Mealli, C.; J. Organomet. Chem. 1994, 478, 161; Nunzi, F.;
Sgamellotti, A.; Re, N.; Floriani, C.; Organometallics2000, 19, 1628; Craciun, R.; Vincent, A. J.; Shaughnessy, K. H.; Dixon, D. A.; Inorg. Chem. 2010, 49, 5546.
9. Li, J.; Schreckenbach, G.; Ziegler, T.; Inorg. Chem. 1995, 34,
3245.
10. C60 is herein treated as an electron-deficient polyalkene.
11. Jeon, Y.; Chen, J.; Croft, M.; Phys. Rev. B: Condens. Matter Mater. Phys. 1994, 50, 6555; Benfield, R. E.; Grandjean, D.; Kröll, M.;
Pugin, R.; Sawitowski, T.; Schmid, G.; J. Phys. Chem. B
2001, 105, 1961.
12. Outka, D. A.; Stöhr, J.; J. Chem. Phys. 1988, 88, 3539; Mansour, A. N.; Cook Jr., J. W.; Sayers, D. E.; J. Phys. Chem. 1984, 88,
2330.
13. Choy, J. -H.; Kim, D. -K.; Demazeau, G.; Jung, D. -Y.; J. Phys. Chem. 1994, 98, 6258.
14. Pease, D. M.; Fasihuddin, A.; Daniel, M.; Budnick, J. I.;
Ultramicroscopy2001, 88, 1.
15. Sham, T. K.; Phys. Rev. B: Condens. Matter Mater. Phys. 1985,
31, 1888; Sham, T. K.; Solid State Commun. 1987, 64, 1103; de Groot, F. M. F.; Hu, Z. W.; Lopez, M. F.; Kaindl, G.; Guillot, F.; Tronc, M.; J. Chem. Phys.1994, 101, 6570.
16. Qi, B.; Perez, I.; Ansari, P. H.; Lu, F.; Croft, M.; Phys. Rev. B: Condens. Matter Mater. Phys. 1987, 36, 2972.
17. Sham, T. K.; Phys. Rev. B: Condens. Matter Mater. Phys.1985,
31, 1903.
18. Lytle, F. W.; Greegor, R. B.; Appl. Phys. Lett. 1990, 56, 192;
Wang, W. -C.; Chen, Y.; Hu, T. -D.; Phys. Status Solidi B 1994,
186, 545.
19. Costain, C. C.; Stoicheff, B. P.; J. Chem. Phys. 1959, 30, 777.
20. Fedurco, M.; Olmstead, M. M.; Fawcett, W. R.; Inorg. Chem.
1995, 34, 390.
21. Bekoe, D. A.; Trueblood, K. N.; Z. Kristallogr.1960, 113, 1. 22. Asaro, F.; Lenarda, M.; Pellizer, G.; Storaro, L.; Spectrochim.
Acta, Part A 2000, 56, 2167; Pellizer, G.; Graziani, M.; Lenarda, M.; Polyhedron1983, 2, 657; Berger, S.; Braun, S.;
Kalinnowski, H. -O.; NMR Spectroscopy of the Non-Metallic Elements; Wiley: Chichester, 1977, p. 709.
23. Cheng, P. -T.; Nyburg, S. C.; Can. J. Chem. 1972, 50, 912. 24. Bombieri, G.; Forselli, E.; Panattoni, C.; Graziani, R.; Bandoli, G.;
J. Chem. Soc. A1970, 1313.
25. Karhánek, D.; Kacer, P.; Kuzma, M.; Splíchalová, J.; Cervený, L.;
26. Frenking, G.; Fröhlich, N.; Chem. Rev. 2000, 100, 717 and references therein.
27. Nagel, U.; Chem. Ber. 1982, 115, 1998.
28. Fagan, P. J.; Calabrese, J. C.; Malone, B.; Science1991, 252,
1160.
29. Baddley, W. H.; Venanzi, L. M.; Inorg. Chem. 1966, 5, 33.
Submitted: January 25, 2011
Published online: October 13, 2011
![Figure 1 shows that the Pt L 3 -XAS spectra of [Pt(PPh 3 ) 2 (η 2 -L)] compounds share similar features](https://thumb-eu.123doks.com/thumbv2/123dok_br/18996751.462448/3.892.457.792.118.763/figure-shows-xas-spectra-compounds-share-similar-features.webp)
![Table 1. Selected results of the Pt L 2,3 -edges XAS and the relevant ancillary data for [Pt(PPh 3 ) 2 (η 2 -L)] {L = C 2 H 4 , C 60 , C 2 (CN) 4 )}](https://thumb-eu.123doks.com/thumbv2/123dok_br/18996751.462448/4.892.97.425.292.1022/table-selected-results-edges-xas-relevant-ancillary-data.webp)