*e-mail: [email protected]
Influence of the Microstructure on the Degree of Sensitization of a
Duplex Stainless Steel UNS S31803 Aged at 650°C
Evelin Barbosa de Méloa*, Rodrigo Magnaboscob, Carlos de Moura Netoa
aDepartment of Mechanical Engineering, Technological Institute of Aeronautics – ITA, Praça Marechal Eduardo Gomes, 50, CEP 12228-900, São José dos Campos, SP, Brazil
bDepartment of Materials Engineering, Ignatian Educational Foundation – FEI,
Av. Humberto A. C. Branco, 3972, office K5-09, CEP 09850-901, São Bernardo do Campo, SP, Brazil
Received: February 22, 2013; Revised: June 5, 2013
This work evaluates the phase transformations during aging of an UNS S31803 DSS at 650°C
and its inluence on the DOS. The material was solution treated at 1175°C and then aged at 650°C for
times up to 360 h. SEM-BSC images indicate the formation of Cr2N, σ and χ phases in the samples aged at 650°C. The analysis of DL-EPR curves, obtained in a 1 M H2SO4 + 0.25 M NaCl + 0.01 M
KSCN solution, shows an increase in DOS values for samples aged at 650°C. Probably, this increase observed in DOS values is mainly related to the presence of Cr- and/or Mo-depleted α, as a result of σ phase, χ phase and/or Cr2N formation at 650°C. Moreover, a possible healing up of Cr- and/ or Mo-depleted areas is observed between 1 h and 4 h of aging at 650°C.
Keywords: duplex stainless steel, DL-EPR, degree of sensitization, sigma phase
1. Introduction
Duplex stainless steels (DSS) are those with a microstructure composed by two phases, ferrite (α) and austenite (γ), which appear in approximately equal volume fractions1. Their favourable combination of properties makes this class of steels widely employed in oil and gas, petrochemical and pulp and paper industries2.
Between –50°C and 250°C, a great combination of mechanical properties and corrosion resistance is offered by DSS. However, a large variety of secondary undesirable phases may form in the temperature range of 300°C and 1000°C, during isothermal aging or as a result of incorrect heat treatment procedures1.
Between 300°C and 1000°C the most important secondary phases which can precipitate are alpha prime phase (α’) and sigma (σ) phase. Alpha prime phase is chromium enriched and, depending on ferrite composition, its formation may happen by nucleation and growth of precipitates or by spinodal decomposition3. Moreover, α’ phase formation is expected in temperatures below 500°C1,
being mostly studied at 475°C. Sigma phase is chromium
and molybdenum enriched if compared to the matrix alloy4, and it is mainly formed between 650°C and 900°C5.
Results presented by Borba and Magnabosco6 reinforce the possibility of σ phase formation in temperatures below
700°C, as it is observed the formation of this phase during
aging of an UNS S31803 DSS at 600°C and 650°C, highly evidenced after 96 h of aging. Arikan and Doruk7, also
working with an UNS S31803 DSS, observe the formation of σ phase from 1000 min (~16 h) of aging at 650°C on, with an increase of σ phase amount with aging time.
Between 650°C and 900°C σ phase may form from ferrite phase by an eutectoid decomposition mechanism leading to secondary austenite (γ2) formation (α→σ+γ2)1,7,8.
However, at 850°C, some authors9,10 found that σ phase may form by different mechanisms depending on aging time. So, at 850°C, for aging times up to 10 min, σ phase may form from direct precipitation from ferrite phase, resulting in Cr and Mo depleted α, also denominated secondary ferrite (α2) phase (α→σ+α2). Moreover, between 30 min and 5 h of aging at 850°C the eutectoid decomposition of α, resulting in γ2 (also depleted in Cr and Mo) is observed. Also, after total α phase consumption at 850°C, σ phase fractions continue to rise due to γ phase consumption for its formation9,10.
Besides σ phase formation, chi (χ) phase and chromium nitride (Cr2N) formation may also result from isothermal
heat treatments of DSS between 700°C and 900°C1. Usually, Cr2N precipitation occurs intergranularly at α/α grain boundaries or at α/γ interfaces1,11, together to the formation of γ2, causing chromium depleted zones11. Chi phase formation generally occurs before σ phase formation and is gradually consumed by σ phase precipitation11-13. As χ phase is enriched in Cr and Mo as well as σ phase (but with larger amounts of Mo than sigma phase11-14), it is expected to promote depletion of the surrounding matrix in such elements11. Besides some authors claim that χ phase formation occurs at α/γ interfaces13, other authors indicate that its formation starts at α/α grain boundaries12.
The formation of Cr and Mo depleted phases such as α2 and/or γ2 have a strong inluence in localized corrosion
resistance and such inluence can be measured by the degree of sensitization (DOS) through Double-Loop Electrochemical
Although DL-EPR tests were at first developed in
order to evaluate the DOS of austenitic stainless steels15,
recent studies use DL-EPR tests to evaluate the inluence of
isothermal aging on DSS and, consequently, of secondary
phases precipitation, in the DOS of these steels7,16-23.
As far as corrosion resistance is concerned, σ phase
formation promotes an increase in the DOS7,16-18,20-23
probably as a result of etching to adjacent areas of formed σ phase, as these regions are likely to be depleted in chromium
and/ or molybdenum. Some authors, working with UNS
S31803 DSS aged at 650°C, show that, after DL-EPR tests in a 2 M H2SO4 + 0.5 M NaCl + 0.01 M KSCN solution,
the DOS increases from 0.036236 (samples aged for 16 h) to 0.824235 (samples aged for 527 h)7, while others show
that, after DL-EPR tests in a 0.3 M HCl + 0.002 M Na2S2O3
solution, the DOS increases from 0.075 (samples aged for 60 min) to 0.2574 (samples aged for 300 min)22.
Recent studies related to isothermal heat treatments of DSS at 650°C are mainly based upon σ phase formation6,7; however, the possibility of χ phase formation and even of Cr2N formation may not be neglected, as there is lack of information about such phases as far as heat treatments
below 700°C are concerned.
Moreover, although a great number of recent works relate DSS phase transformations due to aging between 650°C and 900°C7,16-20,22-23 and DOS evolution, some present
an incomplete microstructural analysis, mainly concerning
the Cr and Mo depleted phases and/or areas, and fail to correlate DOS values and even DL-EPR curves features
with the obtained microstructures.
Therefore, the aim of this work is to study phase
transformations and its inluence on the DOS of an UNS
S31803 DSS aged at 650°C.
2. Experimental Procedures
The studied material, UNS S31803 DSS, has the chemical composition given in Table 1, and was received as a 3 mm thick sheet, rolled at 1100°C and cooled by forced water jet and air blast.
Solution heat treatment was conducted in the as received
material for 30 min at 1175°C, followed by water quenching.
Then the samples were aged at 650°C for 20 min, 1 h, 4 h or 360 h in a tubular electric furnace which maintained aging temperature 2°C around the chosen temperature. All heat treatments were conducted in a 99.9% N2 atmosphere to suppress oxidation of the samples surfaces. Following the heat treatments samples were water quenched.
After the heat treatments the specimens were ground
using silicon carbide (SiC) papers to an 80-grit inish before
mounting in thermosetting plastic, leaving an exposed surface area of approximately 0.4-0.6 cm2, parallel to the rolling direction. The mounted samples were metallographic polished in a semi-automatic grinding and polishing
machine, with inal polishing provided by 1-µm diamond
abrasive. Ommediately after polishing, samples surfaces
were washed with ethyl alcohol (C2H5OH) and dried with hot blown air.
X-Ray diffraction, using a Cu-Kα radiation, helped
in phase identiication. The scan was performed in the 2θ
angular range of 30-120° with a scan speed of 1°/min and
a step size of 0.04°.
Scanning electron microscopy (SEM), through backscattered (BSC) electron images, were also used for phase determination. BSC electron images were analysed considering that χ phase appears lighter than σ phase due to its higher molybdenum content11-14 and that Cr
2N appear darker due to its nitrogen content24.
Quantitative metallography of σ and χ phases (showed as a sum and denominated as intermetallic phases) was
performed in six ields of each sample with an automated
image analysis system attached to an optical microscope, using SEM-BSC images of polished samples. The evaluation of ferrite phase percentage was obtained by magnetic
measurements using a ferritscope (FOSCHER MP30) calibrated with standard samples. On each sample
20 measurements were made.
Taking into consideration only the presence of α, γ and intermetallic phases, γ content can be calculated using Equation 1:
% γ = 100 - % α - % intermetallic phases. (1)
DL-EPR tests were carried out in a 1 M H2SO4 + 0.25 M NaCl + 0.01 M KSCN solution, exposed to air, at a controlled temperature of 30°C ± 2°C, using a jacketed glass cell as test cell. The test temperature was controlled using a thermostatic circulating water bath attached to the test cell. The test cell had a saturated calomel electrode (SCE) as a reference electrode, a platinum wire as counter electrode and, as working electrode, samples polished until 1-µm
diamond abrasive inish were used.
Samples were immersed in the test solution for 5 minutes to ensure both the stabilization of the open circuit
potential (OCP) and the testing temperature of the cell, and then the anodic polarization was conducted from the OCP, at a scan rate of 1.67 mV/s. The scan direction was reversed at the potential of +300 mVSCE, and the tests were inished at the OCP previously measured. After DL-EPR tests, samples
surfaces were washed with distilled water and dried with hot blown air to be examined by optical microscopy. The electrochemical tests were repeated three times for each heat-treatment condition.
The DOS was determined by the ratio between the
maximum anodic current density during the reactivation (ir) and the maximum anodic current density during the activation (ia), as described by Equation 2:
DOS = ir / ia. (2)
Table 1. Chemical composition (wt%) of the studied material.
Cr Ni Mo Mn N C Si Cu Co P S Nb Fe
3. Results and Discussion
Figure 1 presents the equilibrium phase content as a function of temperature, calculated using Thermo-Calc
software and TC-Fe6 database. At 1175°C (solution
temperature) the equilibrium consists of α and γ phases with approximate volume fractions of 62% and 38% respectively. Ferrite phase volume fraction obtained experimentally
(57.3 ± 2.3%) is also plotted in Figure 1 and it is almost
identical to the calculated equilibrium value (62%),
considering the standard deviation of the experimental measurements. This may indicate that the solution treatment
performed at 1175°C for 30 min is enough to reach
equilibrium between α and γ phases and to develop a duplex microstructure. Still in Figure 1, at 650°C, the calculated equilibrium phases are α, γ, σ and Cr2N, with approximate volume fractions of 12%, 54%, 32% and 2%, respectively.
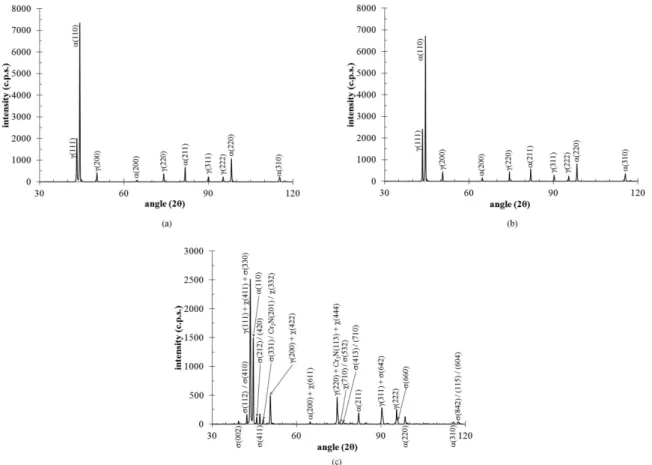
X-ray diffraction patterns for the UNS S31803 DSS studied are presented in Figure 2. For the solution treated sample (Figure 2a) and for the sample aged 4 h (Figure 2b) at 650°C the X-ray diffraction patterns indicate only α and γ phases, while the X-ray diffraction pattern for the sample aged 360 h at 650°C (Figure 2c) indicates Cr2N, σ and χ phases, besides α and γ phases. However, as all Cr2N and χ phase peaks appear combined with other phases peaks, this technique cannot be used to clear determine the formation of such phases.
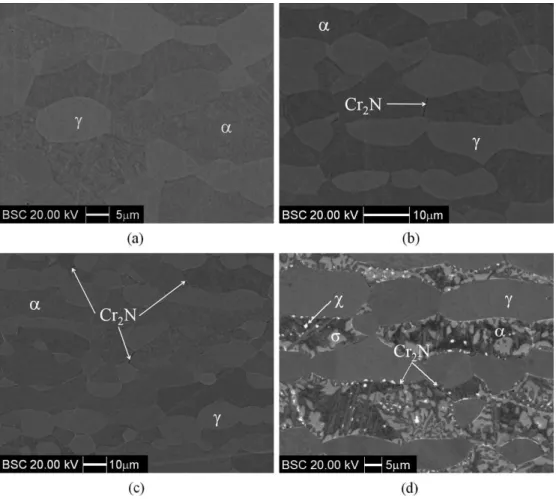
On order to conirm the phases formed in the UNS
S31803 DSS studied, SEM-BSC images were obtained (Figure 3). Solution treated sample (Figure 3a) indicates only α and γ phases. For samples aged 1 h (Figure 3b) and 4 h at 650°C (Figure 3c), besides α and γ phases, Cr2N (darker regions, due to nitrogen content24) formation mainly occur at α/α phase boundaries. For the sample aged 360 h at 650°C (Figure 3d), besides α and γ phases, it is also observed the presence of σ phase (light grey, due to chromium and molybdenum contents), χ phase (white, as it is enriched in molybdenum if compared to sigma phase11-14) and
Figure 1. Equilibrium volume fraction of phases, calculated using Thermo-Calc software and TC-Fe6 database. Ferrite phase volume
fraction (%) experimental value, for the solution treated sample, is also presented.
Cr2N (darker points, due to nitrogen content24). Therefore,
BSC images conirm the evidences of Cr2N and χ phase formation previously pointed out by X-ray diffraction patterns (Figure 2c).
Comparing the microstructural observations of the present work with those of Arikan and Doruk7 it seems
that, besides these authors make a brief comment on the possibility of χ phase or Cr2N formation after aging an UNS S31803 DSS, they claim it was not possible to observe χ or Cr2N in their optical micrographs. However, Arikan and Doruk7 would have probably observed such phases if they had not performed SEM analysis in their samples after electrolytic etching with oxalic acid, as they would have prevented the Cr enriched phases to be etched away before SEM analysis.
Ot is important to point out that the absence of Cr2N peaks in the diffraction pattern of the sample aged 4 h at 650°C (Figure 2b) may be related to the small amounts of Cr2N observed in the BSC images (Figure 3c). So, considering the small amounts of Cr2N, their volume fraction was
neglected in phase quantiication, and σ and χ phases will be designated as intermetallic phases, since they are both Cr- and Mo-rich phases, probably associated to areas depleted in those elements.
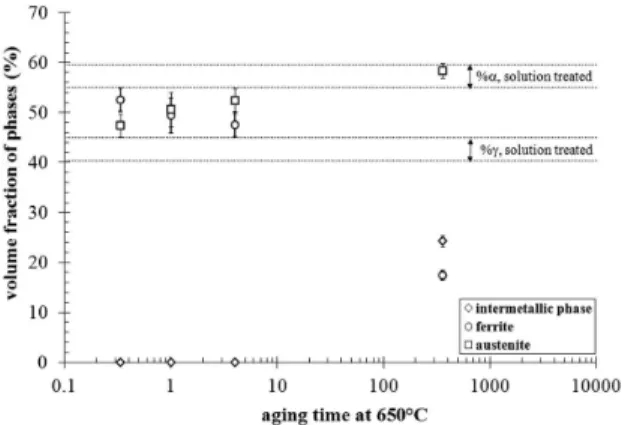
Figure 4 shows the volume fractions of phases obtained by quantitative metallography of BSC images. For samples aged for times up to 4 h at 650°C an increase in γ volume fraction as well as a decrease in α volume fraction is observed (Figure 4), but only small amounts of Cr2N are observed mainly at α/α phase boundaries (Figure 3).
Ontermetallic phase formation between 4 h and 360 h of
aging at 650°C leads to a great drop in α phase volume fraction combined with an increase in γ volume fraction (Figure 4). The increase in γ volume fraction observed for samples aged up to 4 h at 650°C may be related to γ2 formation in cooperation with Cr2N, while between 4 h and 360 h of aging the increase observed in γ fraction is probably related to γ2 formation as a result of Cr2N, σ and χ phases formation. Moreover, the reduction observed in α phase fractions (Figure 4) indicates that the intermetallic phases and Cr2N are probably formed by the consumption of α phase.
A comparison between the experimental volume fractions obtained after 360 h of aging at 650°C (Figure 4) and the equilibrium volume fractions (Figure 1) shows that the remaining volume fraction of α phase (17.4 ± 1.0%) is higher than expected (12%) while the volume fraction of formed intermetallic phases (24.3 ± 1.1%) is lower than
the value predicted for σ phase at the equilibrium (32%). Moreover, after 360 h of aging at 650°C a slightly higher volume fraction value of γ phase (58.3 ± 1.5) is observed than the expected at equilibrium (54%). So, it is important to highlight that as the equilibrium phases expected at 650°C are α, γ, σ and Cr2N (Figure 1), the differences found in the comparison between experimental and calculated volume fractions of phases, as well as the presence of χ phase (Figure 3), indicate that aging at 650°C for time periods up to 360 h is not enough to establish the thermodynamic equilibrium in the UNS S31803 DSS studied.
DL-EPR tests in 1 M H2SO4 + 0.25 M NaCl + 0.01 M KSCN, for the solution treated sample and for samples aged at 650°C, produced the typical curves presented in Figure 5.
Ot can be observed in Figure 5 that there is an evident
increase in ia and ir for the sample aged 360 h at 650°C. This increase may be related to the development of chromium and molybdenum depleted areas as a consequence of intermetallic phase formation.
Another important observation is the existence of a second current density peak during reactivation for the
sample aged 360 h at 650°C. Magnabosco, Santos and Mélo25 show that the potentiodynamic polarization curves, in acid solution, for a solution treated sample of an UNS S31803 duplex stainless steel present two distinct anodic current density peaks, indicating that the one with a lower potential corresponds to α phase and the other with a higher potential represents γ phase. Moreover, it is expected that a multiphase material presents an anodic polarization curve which represents a sum of the individual curves of existing phases26. So, the appearance of a second peak may be related to the existence of α and γ phases, both with distinct electrochemical behaviours. Also, a high Cr and Mo depletion in the original α matrix in the sample aged 360 h at 650°C could explain why the α phase peak (lower potential) is highly evidenced in this sample, indicating the possibility of α2 formation.
However, it is important to point out that, as there is only
one well deined peak in the activation portion of the curve,
even though a second peak appears during reactivation, only the reactivation peak with higher potential was used to calculate the degree of sensitization for the sample aged for 360 h at 650°C in order to properly compare the values of ir and ia.
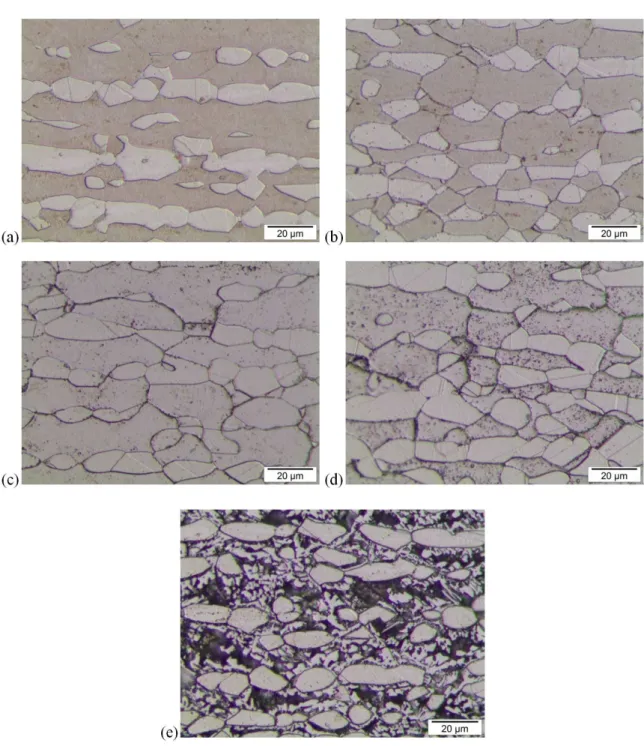
Optical micrographs of samples surfaces after DL-EPR
tests, for the solution treated sample and for the samples aged at 650°C, are presented in Figure 6. A more intense etching at α/α grain boundaries, α/γ interfaces and inside α grains is observed when the solution treated sample and the samples aged at 650°C are compared (Figure 6).
While the etch at α/α grain boundaries is enhanced from 1 h of aging at 650°C on (Figure 6c), at α/γ interfaces it is better observed from 4 h of aging at 650°C on (Figure 6d). Also, some areas inside α grains are slightly etched after 1 h of aging at 650°C and this etching becomes more intense with aging time, leading to a great material removal inside α grains in the sample aged 360 h at 650°C.
A comparison between SEM-BSC images (Figure 3) and samples surfaces after DL-EPR tests (Figure 6) shows that etching provided by DL-EPR tests promotes material removal at intermetallic phase adjacent areas. Therefore, samples surfaces behaviour after DL-EPR tests are absolutely consistent with the microstructural observations as the material removal is probably taking place at chromium
and/or molybdenum depleted areas adjacent to intermetallic phase formation. Ot is important to point out that γ phase remains with no signs of etching after DL-EPR tests, reinforcing that the secondary phases formation observed are mainly related to phase transformations taking place at α phase.
As the analysis of the volumetric fraction of phases (Figure 4) indicates not only an increase in γ phase fractions but also a remaining α phase fraction (even after aging 360 h
at 650°C), the chromium and/or molybdenum depleted areas
may be related to α2 and/or γ2 phases formation as a result of intermetallic phase formation. This statement is valid as it is not possible to separate the contributions of the original α matrix and a possible chromium and/or molybdenum α phase coexistence in the analysed samples.
Moreover, as the main precipitation observed for samples aged for times up to 4 h at 650°C is related to
Figure 4. Volume fraction of phases as a function of aging time at 650°C.
Figure 5. Typical DL-EPR curves in a 1 M H2SO4 + 0.25 M
NaCl + 0.01 M KSCN solution, for the solution treated sample and for samples aged at 650°C. The maximum anodic current density during the reactivation (ir) and the maximum anodic current density
Cr2N formation, probably, for such samples, the etched areas are depleted in chromium, although the slightly etched areas observed inside ferrite grains may indicate an early stage of some secondary phase formation, presenting particles yet too small to be distinguished by SEM-BSC images. However, when the sample aged 360 h at 650°C is analysed, the etched areas may be depleted in chromium
and/or molybdenum as the intermetallic phases formed are
chromium and molybdenum enriched.
DOS evolution as a function of aging time at 650°C
is compared to the solution treated sample behaviour in
Figure 7. Ot can be observed in Figure 7a that aged samples until 4 h at 650°C present DOS values a little higher than
that of the solution treated sample, but values are still very low. However, for the sample aged for 360 h at 650°C it is
observed a great increase in DOS values when compared
to the solution treated sample or even other samples aged
at 650°C (Figure 7a).
On addition, a better observation of DOS values of samples aged up to 4 h at 650°C is presented in Figure 7b. Besides the small increase in DOS values until 4 h of aging
at 650°C, when compared to the solution treated sample,
Figure 6. Optical micrographs of samples surfaces after DL-EPR tests. Solution treated sample (a) and samples aged at 650°C for
apparently between 1 h and 4 h of aging, there is a slight
reduction tendency in DOS values, already observed by
other authors20,23,27. This reduction tendency in DOS values
may indicate healing up of chromium/ molybdenum
depleted areas due to Cr and Mo redistribution between the surrounding matrix and depleted areas, as stated elsewhere27. This Cr and Mo redistribution is more likely
to happen between the surrounding matrix and depleted areas than between intermetallic phases and depleted areas as intermetallic phases do not behaviour as solid solutions when it comes to alloying elements redistribution.
On addition, the great increase observed for DOS values
for the sample aged 360 h at 650°C is consistent with the observations of higher intermetallic phase fractions values for this sample, showed in Figure 4, as higher intermetallic
phase fractions may indicate the presence of more areas subjected to Cr and Mo depletion. Moreover, taking into consideration that the γ phase is not etched during DL-EPR tests and the fact that the highly evidenced α phase peak during reactivation (in the sample aged 360 h at 650°C) is probably due to α2 phase formation, the main
Cr-/Mo-depleted phase responsible for the increase in DOS values
seems to be α2.
Thus, this small increase in DOS values until 4 h of
aging, besides the slight decrease observed between 1 h and 4 h of aging, as well as the great increase for sample aged for 360 h at 650°C point out that intermetallic phase
formation at 650°C leads to the formation of chromium and/
or molybdenum depleted regions, which are considerably deleterious to corrosion resistance of UNS S31803 duplex stainless steel studied in this work.
4. Conclusions
• Samples aged for times up to 4 h at 650°C mainly present Cr2N formation at α/α grain boundaries and a possible γ2 phase formation;
• Aging at 650°C for times up to 360 h leads to Cr2N, χ and σ phase formation probably accompanied by
Cr- and/or Mo-depleted α2 and/or γ2 phase formation;
• A comparison between sample surfaces after DL-EPR
tests and SEM-BSC images of aged samples shows that etching provided by DL-EPR tests promotes material removal at intermetallic phase adjacent areas, indicating that the material removal is probably taking
place at chromium and/or molybdenum depleted
areas, which may correspond to α2 and/or γ2 phases;
• A slight decrease in DOS values is observed between
1 h and 4 h of aging at 650°C indicating a possible healing up of the microstructure due to Cr and Mo redistribution between the surrounding matrix and depleted areas;
• The great increase observed for DOS values for the
sample aged 360 h at 650°C may be associated with
the existence of more areas subjected to
Cr-/Mo-depletion as a consequence of higher intermetallic phase fractions values observed for this sample. Also,
there is evidence that the main Cr-/ Mo-depleted phase responsible for the increase in DOS values is
α2.
Acknowledgements
The authors would like to thank the Brazilian National Council of Scientific and Technological
Development - CNPq (Process nº 141097/2011-6) for the given inancial support.
Figure 7. Degree of sensitization (DOS) in 1 M H2SO4 + 0.25 M
NaCl + 0.01 M KSCN solution for samples aged at 650°C compared to the solution treated sample: (a) samples aged up to 360 h; (b) samples aged up to 4 h.
References
1. Nilsson JO. Super duplex stainless steels. Materials Science and Technology. 1992; 8(8):685-700.
2. Padilha AF, Plaut RL and Rios PR. Stainless steels heat
treatment (chapter 12). On: Totten GE. Steel heat treatment:
metallurgy and technologies. 2nd ed. Boca Raton: CRC
Press; 2007. p. 695-739.
3. Solomon HD and Devine TM Jr. Duplex stainless steels: a
tale of two phases. On: Conference of the Duplex Stainless Steels; 1982; Ohio. Ohio: ASM; 1982. p. 693-756.
4. Herbsleb G and Schaab P. Precipitation of intermetallic compounds, nitrides and carbides in AF 22 duplex steel and
their inluence on corrosion behavior in acids. On: Duplex stainless steels – conference proceedings; 1982; Ohio. Ohio:
5. Hall EO and Algie SH. The sigma phase. Metallurgical Reviews.1966; 11:61-88.
6. Borba RM and Magnabosco R. Alterações microestruturais
entre 550°C e 650°C para o aço UNS S31803 (SAF 2205). On:
Anais do IX Seminário Brasileiro do Aço Inoxidável; 2008;
São Paulo. São Paulo: ABONOX; 2008. p. 30-35.
7. Arikan ME and Doruk M. Determination of Susceptibility to
Ontergranular Corrosion of UNS 31803 Type Duplex Stainless
Steel by Electrochemical Reactivation Method. Turkish Journal of Engineering and Environmental Sciences. 2008; 32:323-335.
8. Barbosa CA, Mori FY, Souza MHC and Falleiros OGS.
Formação de Fase Sigma em Aço Onoxidável Austenítico Ferrítico. Metalurgia-ABM. 1976; 32(227):669-673.
9. Magnabosco R and Alonso-Falleiros N. Pit Morphology and its Relation to Microstructure of 850°C Aged Duplex Stainless Steel. Corrosion. 2005; 61(2):130-136. http://dx.doi. org/10.5006/1.3278167
10. Magnabosco R and Alonso-Falleiros N. Sigma Phase Formation and Polarization Response of UNS S31803 in Sulfuric Acid. Corrosion. 2005; 61(8):807-814. http://dx.doi.
org/10.5006/1.3278215
11. Nilsson JO and Wilson A. Onluence of isothermal phase transformations on toughness and pitting corrosion
of super duplex stainless steel SAF 2507. Materials Science and Technology. 1993; 9:545-554. http://dx.doi. org/10.1179/026708393790172222
12. Escriba DM, Materna-Morris E, Plauta RL and Padilha AF. Chi-phase precipitation in a duplex stainless steel. Materials Characterization. 2009; 60:1214-1219. http://dx.doi.
org/10.1016/j.matchar.2009.04.013
13. Calliari O, Zanesco M and Ramous E. Onluence of isothermal aging on secondary phases precipitation and toughness of a duplex stainless steel SAF 2205. Journal of Materials Science. 2006; 41:7643-7649. http://dx.doi.org/10.1007/ s10853-006-0857-2
14. Michalska J and Sozańska M. Qualitative and quantitative analysis of σ and χ phases in 2205 duplex stainless steel.
Materials Characterization. 2006; 56:355-362. http://dx.doi.
org/10.1016/j.matchar.2005.11.003
15. Majidi AP and Streicher MA. The double loop reactivation
method for detecting sensitization in AOSO 304 stainless
steels. Corrosion. 1984; 40(11):584-593. http://dx.doi.
org/10.5006/1.3581921
16. Lopez N, Cid M, Puiggali M, Azkarate O and Pelayo A.
Application of double loop electrochemical potentiodynamic reactivation test to austenitic and duplex stainless steels.
Materials Science and Engineering A. 1997; 229:123-128.
http://dx.doi.org/10.1016/S0921-5093(97)00008-7
17. Lopez N, Cid M and Puiggali M. Onluence of σ-phase on mechanical properties and corrosion resistance of duplex stainless steels. Corrosion Science. 1999; 41:1615-1631. http:// dx.doi.org/10.1016/S0010-938X(99)00009-8
18. Chaves R and Wolynec S. Onvestigação da corrosão seletiva do
aço inoxidável dúplex UNS S31803 por meio de ensaios de reativação potenciocinética de ciclo duplo. On: Anais do58° Congresso Anual da ABM; 2003; Rio de Janeiro. São Paulo:
ABM; 2003. p. 527-536.
19. Amadou T, Braham C and Sidhom H. Double loop electrochemical potentiokinetic reactivation test optimization in checking of duplex stainless steel intergranular corrosion susceptibility. Metallurgical and Materials Transactions A. 2004; 35A:3499-3513.
20. Gong J, Jiang YM, Deng B, Xu JL, Hu JP and Li J. Evaluation of intergranular corrosion susceptibility of UNS S31803 duplex stainless steel with an optimized double loop electrochemical potentiokinetic reactivation method.
Electrochimica Acta. 2010; 55:5077-5083. http://dx.doi.
org/10.1016/j.electacta.2010.03.086
21. Chandra K, Singhal R, Kain V and Raja VS. Low temperature embrittlement of duplex stainless steel: Correlation between mechanical and electrochemical behavior. Materials Science and Engineering A. 2010; 527:3904-3912. http://dx.doi. org/10.1016/j.msea.2010.02.069
22. Ebrahimi N, Momeni M, Moyaed MH and Davoodi A. Correlation between critical pitting temperature and degree of sensitization on alloy 2205 duplex stainless steel. Corrosion Science. 2011; 53:637-644. http://dx.doi.org/10.1016/j.
corsci.2010.10.009
23. Morais LC, Santos DC and Magnabosco R. Estudo exploratório
do grau de sensitização do aço inoxidável UNS S31803 através de técnica de reativação potenciodinâmica de duplo loop. On:
Anais do 67° Congresso Internacional Anual da ABM; 2012; Rio de Janeiro. São Paulo: ABM; 2012.
24. Magnabosco R. Kinetics of sigma phase formation in a duplex stainless steel. Materials Research. 2009; 12(3):321-327. http://
dx.doi.org/10.1590/S1516-14392009000300012
25. Magnabosco R, Santos DC and Melo EB. Relation between microstruture and selective corrosion of duplex stainless steel
submitted to heated hydrochloric acid. On: Proceedings of EUROCORR 2009; 2009; Nice. Paris: CEFRACOR, 2009.
26. West JM. Electrodeposition and Corrosion Processes. 2nd ed.
London: Van Nostrand; 1970. p. 86-105.
27. Park CJ, Rao VS and Kwon HS. Effects of sigma phase on