*e-mail: [email protected]
Development of Carbon-based Nanomaterials Indicators Using the Analytical
Tools and Data Provided by the Web of Science Database
D.H. Milanez*, M.T. Schiavi, R.M. do Amaral, L.I.L de Faria, J.A.R. Gregolin
Materials Engineering Department, Information Center for Materials Technology, Federal University of São Carlos – UFSCar, Rod. Washington Luís, Km 235,
CEP 13565-905, São Carlos, SP, Brazil
Received: January 11, 2013; Revised: May 7, 2013
The recent rise of nanotechnology and nanomaterial research is marked by the huge amount of publications indexed in electronic databases, which can be evaluated using bibliometric indicators in order to help researchers ind hidden trends, gain novel insights and support new scientiic developments. Although in-depth analyses require specialized software and advanced methodologies, some initial indicators can be developed using the analytical tools available in databases and provide useful information about a speciic subject or research ield. This paper aims to explore the Web of Science’s analytical tool for analyzing the scientiic output regarding carbon-based nanomaterials. The results provide several key indings, including research trends and publications in carbon nanotubes, fullerene and graphene, as well as revealing the main global players and journals from 2001 to 2010. Despite the usefulness of the analytical tool, a number of limitations hindered the development of important indicators, such as those involving citation and collaboration.
Keywords: bibliometrics, scientometrics, carbon nanotubes, fullerenes, graphene
1. Introduction
Over the last few decades, there has been increasing interest in nanotechnology and current advances have been quite striking and evident from publication and patent data due to worldwide efforts in research and investments from funding programs1-5. While in 2005 the global public
spending in the ield was estimated at US$ 4.5 billion1, in
2011 the total global funding reached a round igure of US$ 10 billion5. The USA, China, Japan, Germany, South
Korea, France, Russia, the UK, India and Italy have been the most proliic countries in the nanotechnology ield. For instance, the US National Nanotechnology Initiative has invested cumulatively totaling US$ 18 billion (including the 2013 request) since its inception in 2001 and the budget for 2011 was US$ 1.8 billion6. The Chinese government
invested US$ 893 million during 2005-2007 period2 in its
nanotechnology program and in 2011 its budget achieved near US$ 2.3 billion5.
An important aspect of nanotechnology is the nano-scale structures of materials, which involves typical dimensions between 0.1 and 100 nanometers (nm)7, equivalent to
100,000 times smaller than the size of a human hair. At this scale, nanomaterial can exhibit particular behaviors which can be exploited in the development of new technologies and products for society2,4,8-12. Therefore, nanomaterials have been received considerable attention from nanotechnology governmental programs5. Among the
promising nanomaterials, special attention has been paid to carbon-based nanomaterials (carbon nanotubes, fullerenes and graphene) due to their unique mechanical, physical and
chemical properties and high potential of application mainly in the ield of electronics, optics and engineered materials8-12.
Recently, there has been wide interest in using bibliometric indicators to measure productivity in science and technology (S&T), communication and performance evaluation in order to support planning and research developments4,13-15. Bibliometrics aims to measure registered scientiic and technological communication using mathematical and statistical counting of articles, patent documents, citation, words and terms to ind hidden trends and patterns, and to gain insights into a subject characterized by different levels of stratiication12.
Due to its capability to analyze large volumes of data and information, bibliometrics has been used to evaluate quantitatively the research performance of complex, emergent and highly productive areas, such as nanotechnology. For instance, Kostoff, Koytcheff and Lau9 exploited the nanotechnology research literature from 1991 to 2005 using data from the Science Citation Index and Social Science Citation Index databases (Web of Science). They separated the publications into clusters according to nanotechnology taxonomies and mapped the proliic authors, key journals, institutions and countries, and the most cited authors, journals and documents using bibliometrics9. Beaudry and Allaoui10 measured the impact of public
grants, private contracts and collaboration of Canadian nanotechnology academics by crossing data names from the scientiic publications indexed in Scopus, granted patent from USPTO and contracts registered with the University Research Information System. Chang, Wu and Leu11 used
monitor technological trends in carbon nanotubes ield emission display and they revealed different aspects of patenting activities and the role of the emitter material to improve the eficacy in CNT-FED technology. Lately, the rapid increase in scientiic research and technological development in graphene has been veriied using absolute number, collaboration, total of citation and co-word analysis of papers and patents clusters12.
A huge quantity of information has been made available due to recent advances in information technologies and accessibility to electronic databases. Consequently, general analyzing procedures and methods have become complex, requiring specialized tools and software16,17, which are
in most cases commercial and not easily accessible. Nevertheless, technological advances have also taken place in databases that started to provide analytical features for users to diagnose quantitatively the results of their searches18,19. An insightful database analytical feature is the “Analyze Results” from the Web of Science18 which is able to count the publication data from worldwide scientiic production indexed and helps to compile useful indicators. Some studies have employed the Web of Science to identify leading authors, journals, institutions, and countries20-22.
Osorio and Otieno22, for instance, evaluated the productivity
of Brazilian engineers from 2000 to 2006 and found that Materials Science was the most active technology ield. However, none of them provided a detailed procedure of how to compile those indicators using the database feature.
Despite the contribution of bibliometric indicators to develop knowledge in carbon-based nanomaterials, most of the bibliometric work performed currently has used highly complex computational tools and sophisticated methods to analyze large volumes of data, and the specialized features are usually proprietary and not easily accessible by researchers and engineers. The database analytical tool can be applied to evaluate comparatively the scientiic (outputs) publication related to carbon nanotubes, fullerenes and graphene. In order to ill in those gaps, the purpose of this investigation is to explore the Web of Science18 analytical tool to provide useful scientiic publication indicators on carbon-based nanomaterials and to help non-specialists in bibliometric analyses gain initial insights into their scientiic area or subject of interest. The remainder of this paper is divided into three sections. Section 2 describes the experimental procedures, while section 3 presents the results and discusses the limitations of the method used. Finally, section 4 outlines the conclusions.
2. Experimental Procedures
2.1.
Data source, search expression and
indicators developed
Scientiic indicators for carbon nanotubes, fullerenes and graphene were developed using the bibliographic data available from Science Citation Index Expanded. The sample investigated comprised 65,307 scientiic publications from 2001 to 2010 recovered by using the search strategy for carbon nanotubes, fullerenes and graphene presented in Table 1. In the case of nanotechnology, previous studies
have discussed the challenge of retrieving and identifying nanotechnology-related publications3,4,23. However, Huang et al.23 performed a comparative analysis of search
strategies used in the literature, including lexical queries, evolutionary lexical queries, citation analysis and the use of core journal sets. They concluded these strategies produced very similar rankings because they share a core set of keywords, except for the journal set, which did not provide a robust delineation of the area. Therefore, we used the modular search strategy suggested by Porter et al.3, since
it has the advantage of including nano-related terms revised by experts and specialized journals from the nanotechnology area and a step of excluding non-related terms that have the radical “nano”.
All the searches were conducted in the Topic ield, which retrieve terms from the title, abstract and keywords, except in the case of nanotechnology strategy, which required adding the Publication Name ield of search3. All searches were
also limited to Articles, Letters, Notes and Reviews, based on international procedures for developing indicators13,15.
The evolution and main countries, institutions and journals were mapped for each carbon-based nanomaterial. The evolution data of nanotechnology publication were accurately included for comparative purposes. In addition, the following was analysed: the quantity of records in common among carbon nanotubes, fullerenes and graphene and between these selected nanomaterials and nanotechnology using the Boolean operator “AND” to combine the search expressions shown in Table 1. Graphs and tables were developed using Microsoft Ofice Excel (version 2007) from the results of the Web of Science analytical tool. All searches and analysis were carried out between September 17th and 18th, 2012.
2.2.
Procedure for developing indicators using
the Web of Science analytical tool
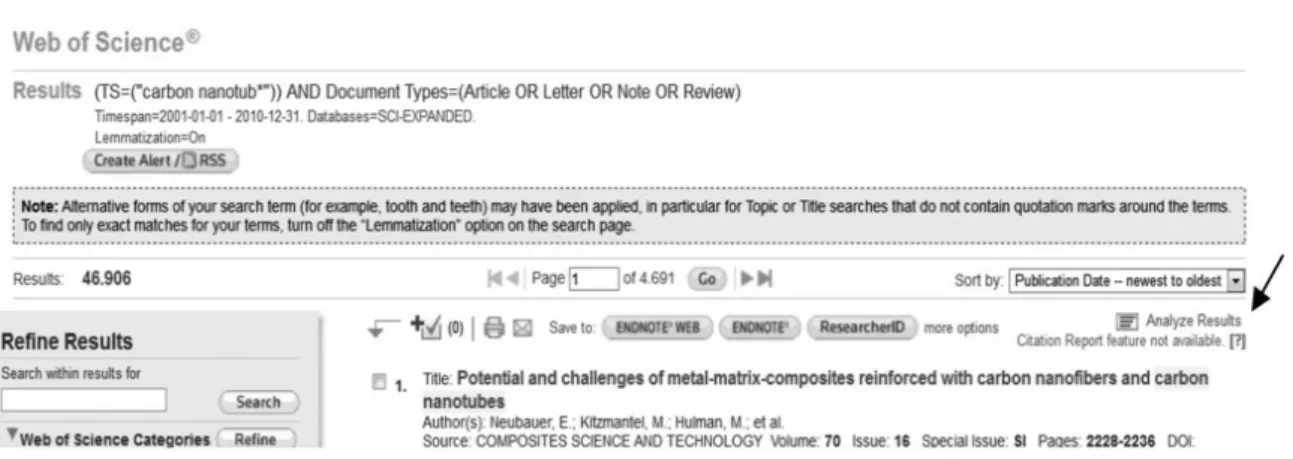
The development of the indicators was rigorously conducted as will now be described. After searching, the results were analyzed with the “Analyze Results” tool from the Web of Science18, the interface of which is highlighted in Figure 1. The “Analyze Results” tool from the Web of Science has an interface that enables users to develop rankings from information of 16 speciic ields of an indexed record. For the purpose of this investigation, ive of them can be highlighted: Publication Year, Country and Territories, Source Titles, Organization and Organization-Enhanced.
Table 1. Search expressions and total number of publications
recovered from 2001 to 2010 for carbon nanotubes, fullerenes, graphene and the nanotechnology ield.
Topic Search Expression Number of Publications
Carbon nanotubes “carbon nanotub*” 46,906
Fullerenes fulleren* 15,251
Graphene graphene* 8,378
Nanotechnology Recommended by Porter et al.3 616,321
The ield option Organization-Enhanced was used instead of ield Organization because it includes the name variants from the Preferred Organization Index24 for the regular organization name.
Another function is the Set Display Option, which shows the top 10, 25, 50, 100, 250, or 500 results and can select a minimum record count to appear in the ranking, as presented in Figure 2. Finally, it is possible to order the results using the function Sort By, which ranks from high to low values according to the number of records in which each value (minimum record count) appears (Record Count option) or sorts the list in ascending alphabetical (A-Z) or numerical (0-9) order (Selected Field option). In addition, after selecting a speciic ield and coniguring the set display, the analytical tool supplies the elements outside of the display and the number of records that do not contain data in the ield being analyzed.
To determine the temporal data of publication per country and institution, in order to calculate the average percentage growth from 2001 to 2010, the feature “View Records” was used due to the fact that it is not possible to cross data in a straightforward way from different ields using the analytic tool (for instance, it is not possible to cross directly the data from countries with the publication year). Therefore, we used a three-step procedure for
indirect data crossing, as illustrated in Figure 3a-c, which exempliies the country-publication year. Prior to that, the top ten countries were ranked (A) to show the top 500 with a minimum record of one (B) and sorting by record count (C), and then the option Analyze was selected (D). The next step was to choose a speciic country (E) and its publication was restricted by clicking in the option View Record (F), as can be seen in Figure 3a. Afterwards, we carried out a new analysis, selecting the “Analyze Results” tool again (G, Figure 3b). Finally, a new rank was created according to the publication year (H), setting the data to the top 500 results with a minimum record count of one (I) and sorted by numerical order choosing the option Selected Field (J). The results of these steps were related to the annual publication of the selected country. This procedure was repeated analogously for other top countries and for the top ten institutions. Furthermore, the outcome values from the analytical tool can be exported by clicking in Select Analysis Data to File (K), after choosing the options Data rows displayed in table or All data rows. A plain text ile will be downloaded with all the values analyzed by the feature.
2.3.
Calculations performed
The annual percentage growth (Gi) was calculated using Equation 1 below, where Ni is the number of publications
Figure 1. Illustration of the Web of Science analytical tool accessible from the “Analyze Results” in the search results screen. Source: Web of Science.
in the year “i” and Ni-1 is the number of publications in the year “i-1”. The average annual growth was obtained from the simple mean of annual rates for the period of 2001 to 2010.
(
−)
−
− ×
= 1
1 100 i i i
i
N N
G
N (1)
The contribution (Ci) was calculated using the Equation 2 below, where Ni is the number of publication of “i” and T is the total of publication of the “i” context. The “i” can be a subject, country, institution or journal. Furthermore, all calculations and graph representation were performed with the software Microsoft Ofice Excel (2007 version).
Figure 3. Procedure for indirect data crossing exempliied to obtain the annual publication data from the United States on carbon nanotubes.
= i i
N C
T
(2)
2.4.
Evaluation of the method proposed
In order to evaluate the method of using the Web of Science analytical tool to develop scientiic indicators and discuss its limitations and drawbacks, the following analysis was carried out. To assess the future capacity of replication of the indicators, new searches for each carbon-based nanomaterial was performed on April 6th, 2013 using
the same search expressions and limits described below. The number of publication per year was obtained using the analytical tool and using bibliometric software (in this case, after downloading the complete bibliographic record datasets for each nanomaterial). The number of publication per year was compared from the results obtained on September 17th and 18th, 2012 and on April 6th, 2013. The
bibliometric software used was VantagePoint (version 5.0). The type of information available to be analyzed in the analytical tool was compared with a regular complete raw record imported from the Web of Science25. Another
issue checked was the consistency of the institution’s total number of publications, because they might have different denominations. In this case, the total publications of two main institutions (Tsinghua University and University of California) in carbon nanotubes was obtained from two ields of the analytical tool (“Organization” and “Organization-Enhanced”) and from bibliometric software, in which there are features to clean and standardize institution names. Other limitations have been discussed elsewhere considering more sophisticated bibliometric analysis14,15.
3. Results and Discussion
3.1.
Evolution of scientific production of
carbon-based nanomaterials and nanotechnology
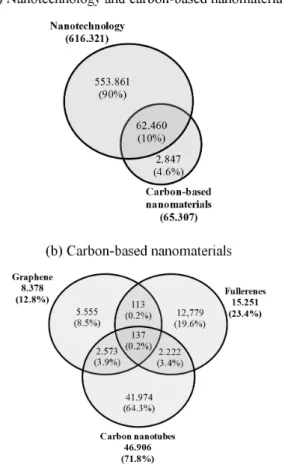
The Web of Science historical search showed that carbon-based nanomaterials have accumulated 65,307 publications from 2001 to 2010, in which 62,460 publications were identiied in the dataset recovered for nanotechnology, as can be seen in Figure 4a. Interestingly, the total number of publications on carbon-based nanomaterials publication represents 10.1% of the nanotechnology area, considering the total of 616,321 recovered for nanotechnology. However, a total number of 2,847 publications, which represents 4.6% of the total carbon-based nanomaterials publications, were not found by the nanotechnology search strategy due to the fact that the term used to retrieve graphene data was not used in the nanotechnology search expression. Arora et al.26 have
recently updated Porter’s nanotechnology modular search strategy in order to attempt changes of emerging technology deinitions over time and many new nano-related terms and journal names were included.
Comparisons among the total number of publications recovered by the three carbon-based nanomaterials search strategies are illustrated in Figure 4b, in which 46,906 publications (71.8%) referred to carbon nanotubes, 15,251 (23.4%) to fullerenes and 8,378 (1.,8%) to graphene.
Only 137 publications (slightly more than 0.2%) contained all the three nanomaterials search terms, and this suggests that few piece of research have taken into account carbon nanotubes, fullerenes and graphene at the same time. By contrast, carbon nanotubes seemed to be an important subject for advances in graphene and in fullerenes research, because it markedly appears in publications on these nanomaterials.
Nanotechnology publications increased sharply from 2001 to 2010 displaying an average growth of 13.3% annually, as shown in Figure 5. Nevertheless, publications on carbon nanotubes and graphene grew at higher rates (26.5% and 48.1%, respectively) in the same period. A possible explanation for this result might be that carbon nanotubes have been the target of several technological developments9,11, and in the case of graphene, there is still a lack of knowledge about this nanomaterial8,12. Meanwhile, fullerene publications grew at much lower rates, just 4.0% per year, which suggests a trend to maturity or stagnation, and corroborates the indings reported by Braun, Schubert and Kostoff27, who analyzed the evolution of fullerene
publications from 1985 to 1996. Although the authors suggested that new discoveries concerning fullerenes could cause a further boom in publications, our results do not indicate this occurrence until 2010.
Figure 4. Diagram of publications obtained from crossing the search
3.2.
Main countries with publications in
carbon-based nanomaterials
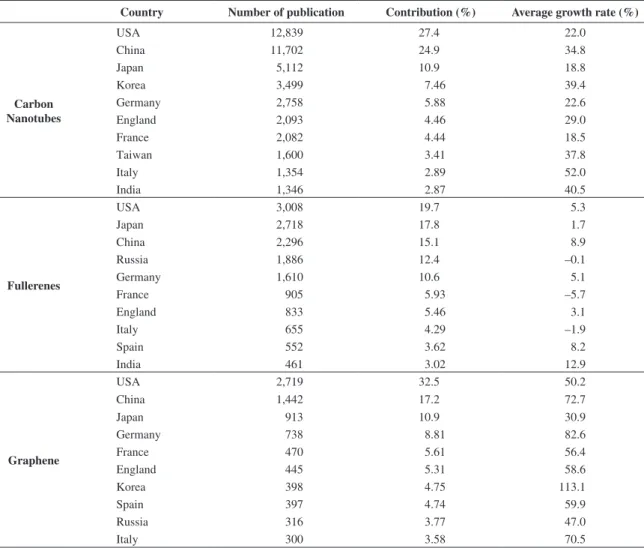
From 2001 to 2010, 105 countries had at least one publication in carbon nanotubes, while in fullerene, there were 98, and in graphene, 81. The absence of data from the “country/territory” analytical ield was less than 0.3% for all nanomaterials. The USA and China are the leading countries in carbon nanotubes and graphene publications, whereas the USA and Japan are prominent in fullerenes, as presented in Table 2. The top 10 countries, which were also listed as the great supporters of nanotechnology research2,5, shared
a signiicant part of the total carbon-based nanomaterial publications: 83.0% for carbon nanotubes, 81.4% for fullerene and 79.8% for graphene. Furthermore, Seven countries can be highlighted considering the data from the three tables: the USA, China, Japan, Germany, England, France and Italy (the UK can be evaluated as a whole territory if the countries that belong to this region - England, Scotland, Wales and Northern Ireland - were selected in the “Countries/Territories” and then analyzed together after clicking in View Records).
Figure 5. Progress of carbon-based nanomaterials publications from 2001 to 2010. Source: Science Citation Index Expanded/ Web of Science.
Table 2. Number of publications, contribution and average growth rate from most productive countries of carbon-based nanomaterials
in the period of 2001 to 2010.
Country Number of publication Contribution (%) Average growth rate (%)
Carbon Nanotubes
USA 12,839 27.4 22.0
China 11,702 24.9 34.8
Japan 5,112 10.9 18.8
Korea 3,499 7.46 39.4
Germany 2,758 5.88 22.6
England 2,093 4.46 29.0
France 2,082 4.44 18.5
Taiwan 1,600 3.41 37.8
Italy 1,354 2.89 52.0
India 1,346 2.87 40.5
Fullerenes
USA 3,008 19.7 5.3
Japan 2,718 17.8 1.7
China 2,296 15.1 8.9
Russia 1,886 12.4 –0.1
Germany 1,610 10.6 5.1
France 905 5.93 –5.7
England 833 5.46 3.1
Italy 655 4.29 –1.9
Spain 552 3.62 8.2
India 461 3.02 12.9
Graphene
USA 2,719 32.5 50.2
China 1,442 17.2 72.7
Japan 913 10.9 30.9
Germany 738 8.81 82.6
France 470 5.61 56.4
England 445 5.31 58.6
Korea 398 4.75 113.1
Spain 397 4.74 59.9
Russia 316 3.77 47.0
Italy 300 3.58 70.5
Source: Science Citation Index Expanded/Web of Science.
2005, whereas for carbon nanotubes, China started leading in 2008 and Korea overtook Japan in 2010. The average growth rate of carbon nanotubes publications was more signiicant in Italy, India, Korea, Taiwan and China than for the USA, Japan, Germany and France (see Table 2). Besides other possible explanations, this result may be related to the emergence of the S&T system of the former countries2,13.
Conversely, countries with a more developed S&T, such as the USA, Japan, Germany and France have researched and published signiicantly on carbon nanotubes since the early ‘90s, and they may be experiencing a tendency towards maturation and effects of the recent economic crisis. In the case of graphene, in which there is still a lack of knowledge in spite of its potential8,12, a huge average growth rate of scientiic publications on this nanomaterial can be seen, mainly in Korea, Germany, China and Italy, while the USA and China emerge at the forefront of production (Figure 6c).
According to Table 2, low values of the annual average growth are observed for the top countries in fullerenes when compared to the results for other nanomaterials. In the case of Russia, France and Italy, the values of their rates were negative and the number of publications from Russia and France declined gradually from 2001 to 2010. For the USA, China and Germany, a positive rise was still observed while the other countries revealed a stagnation of their scientiic publications on fullerene (Figure 6b).
3.3.
Contribution of the most productive
institutions in carbon-based nanomaterials
The ranking of organizations which have contributed to carbon nanotubes research was 7,383 institutions for carbon nanotubes, 3,740 for fullerene and 2,243 for graphene. Less than 0.3% of each nanomaterial data did not have any data from the “Organization-Enhanced” ield. The top 10 institutions listed in Table 3 played an important role in the development of each nanomaterial, because they represented 17.8% of the total publications in carbon nanotubes, 24.2% in fullerenes and 23.1% in graphene. The Chinese Academy of Science, the Russian Academy of Science, the University of California and the Japanese S&T Agency were the organizations that contributed enormously to advances in scientiic productivity in carbon-based nanomaterials. In addition, the Chinese Academy of Science and the Russian Academy of Science consist of numerous research institutes in their countries and the Japanese S&T Agency supports many research activities, and these facts may inluence the results of Table 3.
It can be clearly seen that the growth rates of the top institutions for carbon nanotubes were high, especially for the Japanese S&T Agency, the Chinese Academy of Science and Peking University. In the case of graphene, high growth rate values were observed in all the top institutions, particularly the Massachusetts Institute of Technology and The National Centre for Scientiic Research. In contrast, lower growth rates are observed for the main publisher countries in fullerenes, except for the Japanese S&T Agency, the University of California and the Chinese Academy of Science, whose annual number of publications grew by relatively high values in this ield. Furthermore, the Russian Academy of Science had a slightly negative rate in the period of analysis, although it displayed the most publications from 2001 to 2010.
3.4.
Main publication journals in carbon-based
nanomaterials
From 2001 to 2010, a list of 1,871 publications in carbon nanotubes was published, while for fullerene, this total was 1,182 and for graphene, just 584. The top 10 journals for each carbon-base nanomaterial are shown in Table 4. Only two of them are highlighted in all three tables, Physical Review B and Applied Physics Letters, which are also the top productive journals for carbon nanotubes and graphene topics. Additionally, ive other journals appeared in the rankings of these two nanomaterials at the same time: Nanotechnology, Carbon, Nano Letters, the Journal of Physical Chemistry C and the Journal of Applied Physics. In terms of carbon nanotubes and fullerene publications,
Figure 6. Progress of country publications in carbon nanotubes,
another two journals were signiicant: Chemical Physics Letters and the Journal of Physical Chemistry B.
Physical Review B seems to be the most important journal for carbon-based nanomaterial, because it contains 4.7% of carbon nanotubes publications, 3.3% of fullerene publications and 18.5% of graphene publications. In addition, the top journals for carbon nanotubes accounted for 27.2% of the total number of publications on this nanomaterial, whereas the most productive journal for fullerenes published 23.0% of its publications on the material, and in the case of graphene, 48.9%.
3.5.
Drawbacks and limitations of the proposed
method
Although the method presented in this paper provided an easy way to compile some traditional scientiic indicators using the Web of Science analytical feature, some drawbacks and limitations need to be highlighted and discussed. First of all, databases are not static repositories (for example, Web of Science updates weekly) and new data inserted in updates might affect future replication of the indicators. In
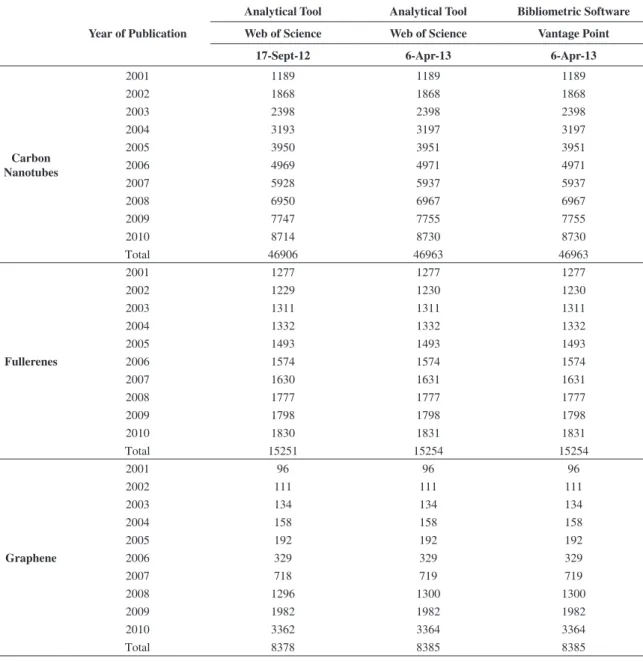
our case, though, it was not noticed as can be seen from Table 5, which presents the number of publication per year obtained in different date of analysis and using different tools. No signiicant differences were observed when the total number of publications obtained in September 2012 and April 2013 were compared (they represent less than 0.1% with regards the total number of publications for each nanomaterial). These similar results can be explained in part by the limits imposed on the search, which includes the use of data only from the Science Citation Index Expanded and of four types of document (article, letter, note and review). Moreover, there was a delay of more than twenty months between the date of compiling indicators (September 17th
and 18th, 2012) and the inal date of the period analyzed
(December 31st, 2010). Consequently, the database had
had enough time to insert data for the period analyzed (2001-2010). Nonetheless, there would be a high risk of failure if the analysis using the analytical tool took into account periods closest to the date when the indicators were being developed. This drawback for future replication can be minimized if the bibliographic records of the publication are
Table 3. Number of publications, contribution and average growth rate for the top institutions in carbon-based nanomaterials from 2001 to 2010.
Institution Number of publication Contribution (%) Average growth rate (%)
Carbon Nanotubes
Chinese Academy of Science 2,344 5.0 26.8
Tsinghua University 1,106 2.4 22.3
University of California 1,064 2.3 18.8
Nat. Inst. of Adv. Industrial S&T 709 1.5 23.5
Japan S&T Agency 660 1.4 42.9
Max Planck Society 639 1.4 12.9
Peking University 632 1.3 26.5
Russian Academy of Science 623 1.3 24.4
Massachusetts Inst. of Technology 612 1.3 24.8
Rice University 580 1.2 25.4
Fullerenes
Russian Academy of Science 1,082 7.1 –0.6
Chinese Academy of Science 590 3.9 12.1
Tohoku University 426 2.8 6.9
Lomonosov Moscow State Univ. 329 2.2 9.3
Osaka University 322 2.1 6.5
University of California 306 2.0 18.9
Kyoto University 305 2.0 9.8
Japan S&T Agency 280 1.8 28.5
University of Tokyo 265 1.7 3.3
University of Erlangen-Nuremberg 253 1.7 9.9
Graphene
University of California 346 4.1 96.6
Chinese Academy of Science 341 4.1 100.4
Spanish National Research Council 232 2.8 65.1
Max Planck Society 194 2.3 75.7
National University of Singapore 184 2.2 97.7
Russian Academy of Science 176 2.1 51.8
Tsinghua University 147 1.8 85.7
Japan S&T Agency 146 1.7 41.4
Nat. Centre for Scientiic Research 142 1.7 110.6
Massachusetts Inst. of Technology 138 1.6 114.9
downloaded and storage in a local computer. Additionally, Table 5 shows that the number of publications achieved using the analytical tool and bibliometric software were identical, which shows the accuracy of the database feature in counting the publications.
Secondly, there are also some limitations of information available for the analytical tool. For instance, it does not provide lists with the keywords given by authors, total number of citations received, and references cited, etc. The citation analysis, for example, would reveal which countries and institutions were in the line board in carbon-based nanomaterials research. That information can be found in the regular complete bibliographic record exported by the database and parsed using bibliometric software25. Another
drawback of the analytical tool is the impossibility of inserting directly external data for the analysis, such as the journal impact factor, or improves the precision of indicators cleaning and standardization names of institutions and people, as also noted in other studies21. Regarding cleaning
and standardization processes, the columns “Organizations” (not standardized) and “Organizations Standardized”
from Table 6 show how the use of bibliometric software can improve the precision of the publication count per institution. In fact, Web of Science has also undertaken efforts to improve the standardization of organization names24, as exempliied from the column “Organizations-Enhanced” from Table 6. This process of grouping different denominations into one standard institution name represents a great challenge due to the fact that some denominations can be wrongly-indicated, especially when author names are considered.
The fact that the database analytical tool does not cross publication data directly or provide charts and network representation is another issue. Despite the risk of failure, such data-crossing can be carried out with some effort and creativity, such as using the three-step procedure described in section 2.2 or the one provided by Osorio and Etieno22,
and the quantiied data could be imported into network or chart-drawing software. In this case, bibliometric software would be unnecessary, but its use would speed up the data-crossing process. In the case of the visualization tools, bibliometric approaches usually combine multiple programs
Table 4. Most productive journals for carbon-based nanomaterials and their contribution from 2001 to 2010.
Journal Number of Publication Contribution (%)
Carbon Nanotubes
Physical Review B 2,221 4.7
Applied Physics Letters 1,926 4.1
Nanotechnology 1,481 3.2
Carbon 1,408 3.0
Nano Letters 1,226 2.6
Journal of Physical Chemistry C 1,146 2.4
Chemical Physics Letters 909 1.9
Journal of Nanoscience and Nanotechnology 901 1.9
Journal of Physical Chemistry B 791 1.7
Journal of Applied Physics 765 1.6
Fullerenes
Physical Review B 504 3.3
Journal of the American Chemical Society 451 3.0
Chemical Physics Letters 442 2.9
Journal of Physical Chemistry B 341 2.2
Journal of Chemical Physics 320 2.1
Fullerenes Nanotubes and Carbon Nanostructures 319 2.1
Applied Physics Letters 303 2.0
Journal of Physical Chemistry A 289 1.9
Synthetic Metals 274 1.8
Chemical Communications 270 1.8
Graphene
Physical Review B 1,554 18.5
Applied Physics Letters 523 6.2
Physical Review Letters 462 5.5
Nano Letters 303 3.6
Carbon 289 3.4
Journal of Physical Chemistry C 268 3.2
ACS Nano 203 2.4
Journal of Physics Condensed Matter 168 2.0
Nanotechnology 165 2.0
Journal of Applied Physics 161 1.9
Table 5. Number of publications per year obtained on different dates of analysis and using different features.
Year of Publication
Analytical Tool Analytical Tool Bibliometric Software
Web of Science Web of Science Vantage Point
17-Sept-12 6-Apr-13 6-Apr-13
Carbon Nanotubes
2001 1189 1189 1189
2002 1868 1868 1868
2003 2398 2398 2398
2004 3193 3197 3197
2005 3950 3951 3951
2006 4969 4971 4971
2007 5928 5937 5937
2008 6950 6967 6967
2009 7747 7755 7755
2010 8714 8730 8730
Total 46906 46963 46963
Fullerenes
2001 1277 1277 1277
2002 1229 1230 1230
2003 1311 1311 1311
2004 1332 1332 1332
2005 1493 1493 1493
2006 1574 1574 1574
2007 1630 1631 1631
2008 1777 1777 1777
2009 1798 1798 1798
2010 1830 1831 1831
Total 15251 15254 15254
Graphene
2001 96 96 96
2002 111 111 111
2003 134 134 134
2004 158 158 158
2005 192 192 192
2006 329 329 329
2007 718 719 719
2008 1296 1300 1300
2009 1982 1982 1982
2010 3362 3364 3364
Total 8378 8385 8385
Source: Science Citation Index Expanded.
Table 6. Comparison of total number of publications from institutions in carbon nanotubes from 2001 to 2010 using the analytical tool (“Organizations” and “Organizations-Enhanced” columns) and bibliometric software (“Organizations Standardized” columns).
Institution Name Organizations Organizations Standardized Organizations-Enhanced
Tsinghua University 595 1105 1105
University of California 333 (Berkeley) 1066 1066
Source: Science Citation Index Expanded.
to perform analysis, calculation and representation as there is no unique software able to fulill all the requirements and bibliometric analysis known18. Furthermore, sophisticated bibliometric approaches, such as text mining, measurement of impact using citations, cluster analysis, network metrics and interdisciplinary linkages, are not possible using the analytical feature9-17.
4. Conclusion
of scientiic publications in fullerenes was signiicantly lower and suggested maturation or stagnation of research concerning this nanomaterial. The top countries shared 83.0%, 81.4% and 79.8% of the total number of publications for carbon nanotubes, fullerenes and graphene, respectively, and the USA proved to be the main country of accumulated scientiic productivity (publications) throughout the period investigated, although China overtook the American leadership in (publications on) carbon nanotubes publication from 2008. Institutions from the USA, China, Japan and Russia played an important role in the advances of the nanomaterials analyzed with emphasis on the Chinese Academy of Sciences, the Russian Academy of Sciences, the University of California and the Japanese S&T Agency. Among the journals which have the most scientific publications, the Physical Review B and the Applied Physics Letters can be highlighted as the main vehicles to publish carbon-based nanomaterials research. These outcomes support our hypothesis that the Web of Science analytical tool and the procedures used are helpful for researchers from any area in developing important indicators. They may be applied to other nanotechnology dimensions or knowledge areas to understand the worldwide and local dynamics of scientiic productivity in publications.
By making the analytical tool available, which has the advantages of database wide coverage, indexing quality and worldwide use, the Web of Science has also become a supplier of highly valuable information and indicators. However, we have discussed a number of important limitations and drawbacks that need to be considered when
using this database feature. First of all, future replication of indicators may be dificult when analysis considers periods close to the date of compiling indicators. Secondly, the analytical tool does not consider the citation and collaboration data of a publication, which are useful in supporting analysis of quality and mapping joint efforts of countries and institutions, respectively. Other issues regard the fact that the analytical tool does not directly cross data from different ields and that cleaning and standardization processes for names are not available, besides the advances already incorporated into the database. Finally, the analytical feature does not provide information from the author’s keywords or terms extracted from the title and abstract, which can be advantageous to understand better where the research is directed. Thus, we recommend the use of the Web of Science analytical tool only as a starting point and for general performance examination. In cases of deep understanding, advanced methods and specialized software should be used.
Acknowledgements
The authors are grateful to the Brazilian National Council of Technological and Scientific Development (process number 160087/2011-2); to the Graduate Program on Materials Science and Engineering and to the Graduate Program on Science, Technology and Society, both from the Federal University of São Carlos, for supporting this work. We are also grateful to the anonymous referees for their comments on this manuscript.
References
1. Roco MC. International Perspective on Government Nanotechnology Funding in 2005. Journal of Nanoparticle
Research. 2005; 7(6):707-712. http://dx.doi.org/10.1007/
s11051-005-3141-5
2. Huang C and Wu Y. State-led technological development: a case of China’s nanotechnology development. World
Development. 2012; 40(5):970-982. http://dx.doi:10.1016/j.
worlddev.2011.11.013
3. Porter AL, Youtie J, Shapira P and Schoeneck DJ. Reining search terms for nanotechnology. Journal of Nanoparticle
Research. 2008; 10(5):715-728. http://dx.doi.org/10.1007/
s11051-007-9266-y
4. Salerno M, Landoni P, Verganti R. Designing foresight studies for Nanoscience and Nanotechnology (NST) future developments. Technological Forecasting and Social
Change. 2008; 75(8):1202-1223. http://dx.doi.org/10.1016/j.
techfore.2007.11.011
5. European Commission. Observatorynano. Public funding of nanotechnology. Available from: <http://www.observatorynano. eu/project/ilesystem/iles/PublicFundingofNanotechnologies_ March2012.pdf>. Access in: 27/10/2012.
6. United States. National Nanotechnology Initiative.
NNI Supplement to the President’s 2013 Budget. 2012.
Available from: <http://www.nano.gov/node/748>. Access in: 13/04/2013.
7. International Organization for Standardization - ISO. TC 229: Nanotechnologies. ISO; 2005. Available from: <http://www.iso.
org/iso/standards_development/technical_committees/other_ bodies/iso_technical_committee.htm?commid=381983>. Access in: 18/10/2012.
8. Geim AK and Novoselov KS. The rise of graphene. Nature
materials. 2007; 6(3):183-91. http://dx.doi.org/10.1038/
nmat1849
9. Kostoff RN, Koytcheff RG and Lau CGY. Global nanotechnology research literature overview. Technological
Forecasting and Social Change. 2007; 74(9):1733-1747. http://
dx.doi.org/10.1016/j.techfore.2007.04.004
10. Beaudry C and Allaoui S. Impact of public and private research funding on scientiic production: the case of nanotechnology.
Research Policy. 2012; 41(9):1589-1606. http://dx.doi.
org/10.1016/j.respol.2012.03.022
11. Chang PL, Wu CC and Leu HJ. Using patent analyses to monitor the technological trends in an emerging field of technology: a case of carbon nanotube ield emission display.
Scientometrics. 2009; 82(1):5-19. http://dx.doi.org/10.1007/
s11192-009-0033-y
12. Lv PH, Wang GF, Wan Y, Liu J, Liu Q and Ma F. Bibliometric trend analysis on global graphene research.
Scientometrics. 2011; 88(2):399-419. http://dx.doi.org/10.1007/
s11192-011-0386-x
14. Okubo Y. Bibliometric indicators and analysis of research
systems: methods and examples. OECD Science, Technology
and Industry Working Papers; 1997. Available from: <http:// dx.doi.org/10.1787/208277770603>. Access in: 27/10/2012. 15. Moed H, Glänzel W and Schmoch U. Handbook of quantitative
science and technology research. 2004 ed. New York: Kluwer
Academic Publishers; 2004. 810 p.
16. Feldmand R and Sanger J. The text mining handbook: advanced approaches in analyzing unstructured data. Cambridge: Cambridge University Press; 2007.
17. Yang YY, Akers L, Klose T and Yang CB. Text mining and visualization tools - Impressions of emerging capabilities.
World Patent Information. 2008; 30(4):280-293. http://dx.doi.
org/10.1016/j.wpi.2008.01.007
18. Thomson Reuters. Web of Science analyze results. 2012. Available from: <http://images.webofknowledge.com/ WOKRS57B4/help/WOS/hp_analyze_results.html>. Access in: 20/09/2012.
19. Elsevier. Analyse results in Scopus. 2012. Available from: <http://www.info.sciverse.com/news-events/releases/ scopus/2012/01/07/scopus-release>. Access in: 14/09/2012. 20. Efron N, Brennan N and Nichols JJ. Citation analysis of the
contact lens ield. Optometry and Vision Science. 2012;
89(1):70-9. http://dx.doi.org/10.1097/OPX.0b013e318236dcca 21. Braun T and Schubert A. Journal of radioanalytical and
Nuclear Chemistry, 2005-2009: a citation-based bibliography and impact analysis using Hirsch-type statistics. Journal of
Radioanalytical and Nuclear Chemistry. 2010; 285(1):1-168.
http://dx.doi.org/10.1007/s10967-010-0571-z
22. Osorio NL and Otieno AW. International cooperation of Brazilian research engineers: patterns of collaboration based on a survey of the literature. In: Proceedings ofthe 37th Annual
Frontiers in Education Conference Global Engineering:
Knowledge Without Borders - Opportunities Without Passports; 2007, Milwaukee, US. New York: Institute of Electrical and Electronics Engineers; 2007. p. F1A8-F1A13. 23. Huang C, Notten A and Rasters N. Nanoscience and
technology publications and patents: a review of social science studies and search strategies. The Journal of Technology
Transfer. 2010; 36(2):145-172. http://dx.doi.org/10.1007/
s10961-009-9149-8
24. Thomson Reuter. Web of Science. Searching the Organizations-Enhanced List. Available from: <http://images. webofknowledge.com/WOKRS59B4_2/help/WOS/hp_ organizations_enhanced_index.html>. Access in: 13/04/2013. 25. Thomson Reuter. Web of Science. Full record. Available from:
<http://images.webofknowledge.com/WOKRS59B4_2/help/ WOS/hp_full_record.html#dsy464-TRS_full_record_ields>. Access in: 13/04/2013.
26. Arora SK, Porter AL, Youtie J and Shapira P. Capturing new developments in an emerging technology: an updated search strategy for identifying nanotechnology research outputs. Scientometrics. 2012; 95(1):351-370. http://dx.doi.
org/10.1007/s11192-012-0903-6
27. Braun T, Schubert AP and Kostoff RN. Growth and Trends of Fullerene Research as Relected in Its Journal Literature.
Chemical reviews. 2000; 100(1):23-38. http://dx.doi.