*e-mail: [email protected]
Influence of Specimens’ Design and Manufacturing Process on Microtensile
Bond Strength to Enamel – Laboratory and FEA Comparison
Fernanda Tranchesi Sadeka,*, Antônio Muencha, Isis Andréa Poiateb,
Edgard Poiate Juniorc, Paulo Eduardo Capel Cardosoa
a
Department of Dental Materials, University of São Paulo – USP, São Paulo, SP, Brazil
bDepartment of Operative Dentistry, School of Dentistry, Federal Fluminense University – UFF,
Nova Friburgo, Rio de Janeiro, RJ, Brazil
c
Department of Mining and Petroleum Engineering, University of São Paulo – USP,
São Paulo, SP, Brazil
Received: February 9, 2010; Revised: April 22, 2010
This study evaluated the effect of specimens’ design and manufacturing process on microtensile bond strength, internal stress distributions (Finite Element Analysis - FEA) and specimens’ integrity by means of Scanning Electron Microscopy (SEM) and Laser Scanning Confocal Microscopy (LCM). Excite was applied to flat enamel surface and a resin composite build-ups were made incrementally with 1-mm increments of Tetric Ceram. Teeth were cut using a diamond disc or a diamond wire, obtaining 0.8 mm2 stick-shaped specimens, or were shaped
with a Micro Specimen Former, obtaining dumbbell-shaped specimens (n = 10). Samples were randomly selected for SEM and LCM analysis. Remaining samples underwent microtensile test, and results were analyzed with ANOVA and Tukey test. FEA dumbbell-shaped model resulted in a more homogeneous stress distribution. Nonetheless, they failed under lower bond strengths (21.83 ± 5.44 MPa)c than stick-shaped specimens (sectioned
with wire: 42.93 ± 4.77 MPaa; sectioned with disc: 36.62 ± 3.63 MPab), due to geometric irregularities related to
manufacturing process, as noted in microscopic analyzes. It could be concluded that stick-shaped, nontrimmed specimens, sectioned with diamond wire, are preferred for enamel specimens as they can be prepared in a less destructive, easier, and more precise way.
Keywords: microtensile bond strength, enamel, sample geometry, failure mode, FEA
1. Introduction
Several mechanical tests, such as shear (microshear), tensile (microtensile) and flexural strength, have been used to measure bond strength of dental substrates and composites, being the microtensile technique, currently, the most used. Since parameters and standardized models were not established for this method, many different procedures for specimen preparation and loading are being followed1, resulting
in discrepancies on the data reported by different researchers. As a consequence, the consideration in critically evaluate the microtensile test has risen to overcome some problems associated to it2,3 and also,
to turn it in a more reliable, accurate and sensible test1,4-6.
Though the innumerous advantages associated to the microtensile test, specimens’ preparation is critical, laborious and technically demanding. It involves sequential cuts into the sample, using predominantly a diamond disc1,7, resulting in thin slabs that can be
trimmed or resectioned into beams. Independently on the final shape, sectioning process can introduce stress raisers into the specimen, mainly in enamel, a highly brittle substrate8,9. As a result, high
incidences of premature failure and low bond strength values in enamel have frequently being reported2,4,10,11.
Researches in Engineering fields12-14, demonstrated that sectioning
with a diamond wire can be an alternative to minimize the introduction of structural defects into brittle specimens. And, recently, the Micro-Specimen Former (University of Iowa, IA, USA) has been employed to
standardize the trimming process and could also be an option to avoid additional stress into microtensile specimens15. Their effects, however,
in enamel microtensile specimens, should be better evaluated. Finite element analysis (FEA) of stress distribution has been used to study the sensitivity of bond strengths to specimen design, and changes in testing conditions5,16. Even though, the effect of specimen
size, geometry and manufacturing process in the results of bond strength has been partially studied17,18, most studies are focused in the
dentin substrate6,19-21. To the best of the author’s knowledge, there is
scattered peer-reviewed information specific on microtensile enamel’s specimen and to date potential effects, on enamel microtensile bond strength, of the difference between diamond wire or disc and stick or dumbbell-shaped specimens are unknown. This raises concern on whether a particular manufacturing process or specimen design could be more appropriate for measurement of the microtensile bond strength on enamel. The null hypothesis was that there is no difference in microtensile bond strength on enamel irrespective of the type of test and specimen manufacturing process.
2. Material and Methods
of the most superficial enamel was abraded from the vestibular aspect of the tooth with a 180-grit silicon carbide sand paper under running water to create an enamel flat surface, supported by the underlying dentin; however without exposing it.
The exposed surfaces were acid etched with 37% phosphoric acid for 15 seconds (Total-Etch®, Ivoclar-Vivadent, Schaan, Liechstein),
thoroughly rinsed and dried until the enamel surface appeared chalky. Subsequently, the adhesive system (Excite®, Ivoclar-Vivadent) was
applied as recommended by the manufacturer and light-cured for 20 seconds. A composite resin block (Tetric Ceram®, Ivoclar-Vivadent) of
approximately 5 × 5 × 5 mm was built on the bonding surface, following the incremental technique. Each layer of composite was individually cured for 40 seconds, with an Optilux® 501 light (Demetron®/Kerr,
Danbury, CT - USA) with an output of 600 mW.cm–2.
The bonded specimens were stored in a saline solution at 37 °C for 24 hours before being sectioned. Teeth were randomly divided into 3 groups (n = 10): Group 1 - teeth were cut with a diamond disc (Extec® Technologies Inc., Enfield, CA - USA) and Group
2 – teeth were cut using a diamond wire (Well Diamond Wire Saws, Le Locle - Switzerland), in order to obtain stick-shaped specimens with a cross-sectional area of 0.8 mm2. Both cutting procedures
were done under continuous water-cooling. Group 3 - teeth were cut initially with a diamond disc (Extec®) into stick-shaped specimens
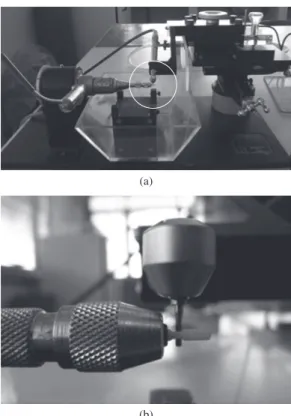
with 2.5 × 2.5 mm that were then trimmed with a cylindrical super fine diamond bur (FG755SF, Kerr-Hawe, Bioggio – Switzerland) mounted on a high-speed handpiece under air-spray, mounted in a Micro-Specimen Former, following the protocol proposed by Armstrong and co-workers15 (Figure 1). The narrowest portion
The incidence of premature failures was calculated for each group. Five specimens from each group were randomly selected for microscopy evaluation. They were previously observed under a Laser Scanning Confocal Microscope (LCM) (Carl Zeiss® Laser
Scanning Systems - LSM510, META, Germany) with an excitation wavelength of 488 nm and an emission filter LP 505 nm. After this previous analysis, specimens were dehydrated with ascending alcohol concentrations (30, 50, 70, 90 and 100%) and dried in a hermetic sealed vial with silica. Each specimen was then mounted on aluminum stubs, sputter-coated with gold-palladium (Edwards®
Coater S150B, Edwards Ltd., London, UK), and observed under a SEM (Philips® 515, Philips, Eindhoven, the Netherlands). Images
taken at relatively low magnifications (25 x – 100 x) provided an overview of the superficial morphology of each specimen, whereas with high magnification views (250 x – 1000 x) defects, microcracks, scratches and wrenches were visualized.
Remaining samples had their cross-sectional areas carefully measured to the nearest 0.01 mm with a digital caliper. For groups 1 and 2, a cyanoacrylate material (Super Bonder® Gel,
Loctite) was used to bond the ends of each specimen on the grip of a Geraldeli’s device 22. Specimens for group 3 were placed in a
Dircks’ device15. Both devices were mounted on a universal loading
machine (Instron model 5565, Instron® Corporation Headquarters,
Canton, MA, USA) and tensile load rate was applied at a crosshead speed of 1 mm/min, until the fracture of the specimen occurred. Bond strength data were considered per tooth in order to take into account the tooth-related variance (n = 10) and specimens with premature bond failures were not included in the compilation of the mean. Then, the statistical analysis of the influence of specimens’ design and manufacturing process was performed with an one-way ANOVA, followed by an all pair-wise multiple comparison post-hoc test (Tukey test). Statistical significance was set in advance at the 0.05 of probability level.
The mode of failure of each specimen was determined using the SEM (Philips® 515) in a secondary electron and back-scattered mode
and classified as cohesive in composite resin – type 1; cohesive in enamel – type 2; adhesive – type 3 and mixed – type 4.
Three-dimensional FEA models were developed using the program MSC/PATRAN® 2005 (MSC.Software Corporation, Santa Ana, CA,
USA) in the pre-processing, post-processing for visualization and evaluation of the results. The processing stage or the solution analysis was performed with the program MSC/NASTRAN 2005 (MSC. Software Corporation, Santa Ana, CA, USA). 3D solid model geometry representing each component or substrate was designed and assembled following the procedures recently described by Poiate and co-authors 23. The modeled specimens were assumed with 10.01 mm
in height and 0.8 mm2 in cross-sectional area (Figure 2). Due to
the symmetry in two planes, only one quarter of the specimen was simulated. The analysis for the two models was run with a bonding agent layer thickness of 10 µm24. All the structures in these models
assumed to be linearly elastic behavior, isotropic and homogeneous, characterized by two physical properties: Young’s Modulus (E) and Poisson’s Ratio (ν) of dentin, enamel, adhesive, and resin composite, were, respectively: 18.6 GPa/0.31, 41 GPa/0.30, 4 GPa/0.35 and 9.4 GPa/0.3824, 25. The interfaces between the structures were presumed
to be perfectly bonded. Tetrahedral element topology (Tet4) was applied. The degree of discretization was established from convergence studies and the m-method of finite element refinement ensured that a proper FE model mesh density was generated. The dumbell model resulted in 33481 nodal points and 194766 elements and the stick model in 15940 nodal points and 92277 elements.
Figure 2. Specimens’ dimensions, for FEA, used for stress analysis. Due to symmetry only one quarter of the specimen is modeled. a) dumbbell and b) stick-shaped models.
The boundary conditions of the models were the same of the experimental tests, thus, in the stick model, the constraints were applied over the surfaces (posterior, anterior and lateral) of dentin and resin composite to simulate the test where the specimen was attached with glue in the Geraldeli’s device, with a free central length of 3.51 mm. In the resin composite side, no rotation and no translation were applied and in the dentin side, just the translation along the symmetry axis was allowed. In the dumbbell model, the constraints (no rotation and no translation) were applied over the neck and shoulder in the resin composite side and in dentin side, just the translation along the symmetry axis was allowed, with a free central length of 3.01 mm, to simulate the specimen attached in the Dircks’ device.
of 103 , 16.7 and 27 MPa, respectively, were used as reference
for results comparison.
3.1. Microtensile bond strength test and premature failure
incidence
The mean and standard deviation microtensile bond strength data are summarized in Figure 3. One-way ANOVA and Tukey’s test revealed statistically significant differences between the three groups (p < 0.05). The bond strength value for the stick-shaped design cut with wire (42.93 ± 4.77 MPa)a was higher than the stick-shaped design
sectioned with disc (36.62 ± 3.63 MPa)b, which was also higher than
dumbbell-shaped specimens (21.83 ± 5.44 MPa)c. Differences were
also found in the incidence of premature failures. It was low when sectioning with wire (5.4%), almost four times higher when sectioning with disc (20.0%) and approximately six times higher when trimmed as a dumbbell (31.8%).
3.2. Results of LCM and SEM integrity analysis
The LCM analyze demonstrated structural defects in the stick-shaped specimens sectioned with the diamond disc and irregularities in the dumbbell-shaped specimens, while the ones cut with wire presented a flawless structural integrity (Figure 4a-c). SEM analyze corroborated to these finds. Structural defects, like cracks, scratches and wrenches were commonly observed in stick-shaped
Figure 3. Mean and standard deviation (MPa) of microtensile bond strength data of all groups. Groups with different letters indicate statistically significant differences (ANOVA and Tukey’s test).
Table 1. The distribution of failure modes (in percentage) between the groups as observed with SEM.
Group Type 1 Type 2 Type 3 Type 4
I – Stick-shaped cut with disc
0.0 18.2 6.3 75.5
II – Stick-shaped cut with wire
0.0 9.3 5.8 84.9
III – dumbbell-shaped 0.0 13.8 7.9 78.3
Figure 5. Representative SEM micrographs of the resin side of fractured specimens in different groups. a) Stick-shaped specimen sectioned with wire. b) Stick-shaped specimen sectioned with disc. c) Dumbbell-shaped specimen. A = adhesive; E = enamel; R = resin composite. a1) Lower magnification (200×), in secondary electron mode, showing a mixed failure (partially cohesive in A, E and C). a2) Same image as (a1), however in back-scattered mode. a3) Higher magnification (500×) of the area limited by a rectangle in (a1), demonstrating fracture in the enamel’s prism (*) and in the adhesive layer (arrow). (b1) Lower magnification (200×), in secondary electron mode, showing a mixed failure (partially cohesive in E, A and C). b2) Same image as b1, however in back-scattered mode. b3) Higher magnification (500×) of the area limited by a rectangle in (b1), demonstrating the cohesive failure in the enamel substrate. c1) Lower magnification (200×), in secondary electron mode, showing a mixed failure (partially cohesive in E, A and C) Air bubble (arrows), imperfect circular shape (*). c2) Opposite side of fractured specimen, evidencing the irregular shape (*). c3) Higher magnification (500×) of the area limited by a rectangle in (c2), demonstrating that the primary failure site was at the enamel border.
specimens sectioned with disc. Even though dumbbell-shaped specimens did not show structural defects, it was not possible to observe perfectly cylindrical trimmed interfaces (Figure 4d-f).
3.3. Mode of failure
reached, while enamel’s tensile strength was exceed, and reached 25 to 30 MPa in the dumbbell-shaped model and up to 62 MPa in the stick-shaped model.
Figure 7 shows the MPS along the symmetry line. The minimum stress in the stick model was 36 MPa and the maximum stress was 43 MPa, while in the dumbbell model was 0 and 23 MPa, respectively. The curve shape of each model was different due to the boundary conditions that each model was submitted.
4. Discussion
Results of the current study revealed that microtensile bond strength in enamel was dependent on specimen designs and manufacturing process, though the null hypothesis should be rejected. Stick-shaped specimens sectioned with a diamond wire showed a significant higher bond strength values (Figure 3), lower incidence of premature failure and cohesive failure in enamel (Table 1) and better a structural integrity of the specimens before being tested (Figure 4). This suggested that sectioning with wire, when bonding is done in enamel, is more reliable compared to stick-shaped specimens cut with a diamond disc and dumbbell-shaped specimens.
The lower bond strength and higher incidence of premature failure and structural defects in enamel associated with stick-shaped specimens sectioned with the diamond disc can be related to the elevated elastic modulus (80.3 ± 7.7 GPa) and low fracture toughness (0.8 MPa.m1/2) of this brittle substrate9,27. Both properties
demonstrate nucleation facility and crack propagation when enamel is stressed. Stress concentration is effective upon contact loading, and the probability of encountering flaws into sectioned specimens increases with increasing dimensions of the contact area. As already demonstrated, contact area of wire saws is about an order of magnitude smaller compared to that of high-end super thin saw blades12. It should
be pointed out that this enamel friability was exacerbated due to the reduced areas of stick-shaped specimens used in this study.
Generally, stick-shaped specimens are easier to prepare with a more consistent outline, as observed in this study. Trimming is very technique sensitive1, mainly in enamel, and it increases the chance of damaging
the specimens by creating defects, flaws and additional stress6,18,
facilitating premature failures. In addition, even though the trimming process in this study was done with the Micro-Specimen Former, milling progress movements were done freehand. For this reason, it was difficult to consistently produce a perfectly cylindrical outline at the bonded interface (Figures 4a and d) and the negative effect of additional trimming was observed. When Ghassemieh simulated a flaw both at the edge and in the middle of the adhesive interface, he found that the percentage of chance in maximum stresses was in order of 30 – 50% and it was concentrated at the tip of the flaw5. The high-stress areas at
the tip of the crack are oriented toward the interface, which results in progression of the crack. Since dumbbell-shaped specimens is in need of bur diamond trimming at the edges, the possibility of creating such a flaw at the edge of the sample is higher.
LCM and SEM results were coherent to the microtensile bond strength data collected, showing the undesirable and deleterious effect that cutting equipment and/or specimens’ shape could induce to microtensile specimens in enamel (Figure 4). Structural defects and irregularities were found more frequently in groups with lower bond strength values (stick-shaped specimens cut with saw and dumbbell-shaped specimens), so can be hypothesized that these defects undermining their integrity, being responsible for their failure under relatively low loading levels and for their higher incidence of premature failure. A rapid propagation to the interface of a defect
Figure 6. Maximum principal stress distribution in dumbbell (a-c) and stick (d-f) shape models in lateral, central and in perspective views, respectively. Each color represents a stress value interval given in MPa unit. 6c and f are split to show the stresses in the interfaces.
Figure 7. Maximum principal stress along the symmetry line in dumbbell and stick-shaped models. The stress in the dumbbell-shaped model extremities is null due to the boundary conditions.
adhesive material (type 3) and no cohesive failure within the resin composite was recorded (type 1). For groups 1 and 3 a large number of specimens showed cohesive failure in enamel (type 2), especially with the stick-shaped specimens cut with disc.
3.4. FEA results
Acknowledgments
This study was supported by FAPESP (process 2005/60644-2).
References
1. Pashley DH, Carvalho RM, Sano H, Nakajima M, Yoshiyama M, Shono Y, et al. The microtensile bond test: a review. Journal of Adhesive Dentistry (Carol Stream), 1999; 1(4):299-309.
2. Sadek FT, Cury AH, Monticelli F, Ferrari M and Cardoso PE. The influence of the cutting speed on bond strength and integrity of microtensile specimens. Dental Materials (Kidlinton), 2005; 21(12):1144-1149.
3. Goracci C, Tavares AU, Fabianelli A, Monticelli F, Raffaelli O, Cardoso PC, et al. The adhesion between fiber posts and root canal walls: comparison between microtensile and push-out bond strength measurements. European Journal of Oral Science (Malden). 2004; 112(4):353-361.
4. de Munck J, Van Landuyt K, Peumans M, Poitevin A, Lambrechts P, Braem M, et al. A critical review of the durability of adhesion to tooth tissue: methods and results. Journal of Dental Research (Washington, DC), 2005; 84(2):118-132.
5. Ghassemieh E. Evaluation of sources of uncertainties in microtensile bond strength of dental adhesive system for different specimen geometries.
Dental Materials (Kidlinton), 2008; 24(4):536-547.
6. Poitevin A, De Munck J, Van Landuyt K, Coutinho E, Peumans M, Lambrechts P, et al. Critical analysis of the influence of different parameters on the microtensile bond strength of adhesives to dentin.
Journal of Adhesive Dentistry (Carol Stream), 2008; 10(1):7-16.
7. Shono Y, Ogawa T, Terashita M, Carvalho RM, Pashley EL and Pashley DH. Regional measurement of resin-dentin bonding as an array. Journal
of Dental Research (Washington, DC), 1999; 78(2):699-705.
8. Arikawa H. Dynamic shear modulus in torsion of human dentin and enamel. Dental Materials Journal (Kdlinton), 1989; 8(2):223-235.
9. Mahoney E, Holt A, Swain M and Kilpatrick N. The hardness and modulus of elasticity of primary molar teeth: an ultra-micro-indentation study.
Journal of Dentistry (Bristol), 2000; 28(8):589-594.
10. de Munck J, Van Meerbeek B, Satoshi I, Vargas M, Yoshida Y, Armstrong S, et al. Microtensile bond strengths of one- and two-step self-etch adhesives to bur-cut enamel and dentin. American Journal of Dentistry (San Antonio), 2003; 16(6):414-420.
11. van Meerbeek B, De Munck J, Mattar D, Van Landuyt K and Lambrechts P. Microtensile bond strengths of an etch&rinse and self-etch adhesive to enamel and dentin as a function of surface treatment. Operative Dentistry (Washington, DC), 2003; 28(5):647-660.
12. Clark WI, Shih AJ, Hardin CW, Lemaster RL and McSpadden SB. Fixed abrasive diamond wire machine - part I: process monitoring and wire tension force. International Journal of Machines Tools & Manufacturing (New York), 2003; 43(3):523-532.
13. Ito S and Murata R. Study on machining characteristics of diamond abrasive wire. Journal of Mechanical Engeneering Laboratory (Tokyo), 1987; 41(5):236-244.
14. Tokura H, Nakayama S and Yoshikawa M. Cutting performance of diamond plated wire tools. International Journal of the Japan Society
for Precision Engeneering (Tokyo), 1992; 58(12):2013-2018.
15. Armstrong SR, Keller JC and Boyer DB. Mode of failure in the dentin-adhesive resin-resin composite bonded joint as determined by strength-based (muTBS) and fracture-strength-based (CNSB) mechanical testing. Dental
Materials (Kidlinton), 2001; 17(3):201-210.
16. Soares CJ, Soares PV, Santos-Filho PC and Armstrong SR. Microtensile specimen attachment and shape--finite element analysis. Journal of Dental
Research (Washington, DC). 2008; 87(1):89-93.
17. Phrukkanon S, Burrow MF and Tyas MJ. The influence of cross-sectional shape and surface area on the microtensile bond test. Dental Materials (Kidlinton), 1998; 14(3):212-221.
18. Goracci C, Sadek FT, Monticelli F, Cardoso PE and Ferrari M. Influence of substrate, shape, and thickness on microtensile specimens’ structural nucleated in the enamel substrate may be again a possible explanation
of this phenomenon28. Moreover, the mode of failure analysis
substantiated with this hypothesis, since most primary failure sites among these groups were at the enamel border (Figure 5).
It could be questioned if these SEM defects found would not be related to SEM artifacts, due to desiccation during sample preparation and/or vacuum process. Nonetheless, it may be elucidated that LCM analysis also demonstrated these structural defects (Figure 4a and c), even though confocal microscopy provides the capacity for direct, noninvasive, serial optical sectioning of intact specimens with a minimum of sample preparation and no vacuum is needed. Moreover, stick-shaped specimens cut with wire underwent through the same sample preparations and vacuum for SEM and presented a flawless structural integrity (Figure 2e).
The two designs used in the study were modeled to evaluate the influence of the geometry of microtensile specimens on the stress developed across the adhesive interface. FEA is a useful approach to help understand structural behavior under load17,19,20. In the two FEA
models studied, the maximum principal stress (MPS) was selected to illustrate the stress generated at the adhesive interface and the stress distribution observed in our FEA models were in agreement with a previous work 5. The maximum stress for the dumbbell design was
in the center and decreased to the extremities, due to its geometry (cylindrical shape) and how it was loaded (Figure 7). Strengths converge to the central region of the model, which is the ideal condition to evaluate a structural behavior of adhesive interfaces. Opposite to that, stick-shaped specimen concentrated the maximum stress at the sharp corner. The average stress evaluated from the rupture load divided by the cross section area was lower than the real failure stress, due to stress concentration. In the edges of stick model it was around 44%, whilst in the dumbbell model the difference was around 27% (Figure 6).
Since FEA showed that there were significant differences in the stress concentration and distribution between the two designs (Figure 6), different bond strength values should be expected. Actually, different bond strength values were found, however, in an opposite way. The stress concentration at the interface in the dumbbell model was smaller compared to stick-shaped model, nevertheless, lower bond strength values were also observed.
The failure stress predicted by FEA is on the basis of assumption that the strengths of the interfaces are equal to the strength of the adhesive and the interfaces between the structures are perfectly bonded. However, there has been no experimental work to support these assumptions. And this could only be valid if the laboratory samples were all perfectly made and are free from flaws, which was rarely obtained, justifying opposite results found. Cracks induced at the edge of the sample during manufacturing process were clearly seen in the microscopy analysis when stick-shaped specimens were cut with the blade and imperfect interface were observed in dumbbell-shaped specimens (Figure 4). As also observed in a recent published research6, even though trimming process was done with
the Micro-Specimen Former, unperfected cylindrical interfaces were observed for the dumbbell-shaped specimens.
Within the limitations of this study, it could be concluded that, theoretically, dumbbell-shaped specimens distribute more uniformly the stress due to their cylindrical geometry and boundary conditions. However, they should only be indicated to evaluate bond strength in enamel if manufacturing process would be improved (like CAD-CAM® process) to reduce imperfections into the interface.
24. Ausiello P, Rengo S, Davidson CL and Watts DC. Stress distributions in adhesively cemented ceramic and resin-composite Class II inlay restorations: a 3D-FEA study. Dental Materials (Kidlinton), 2004; 20(9):862-872.
25. Ko CC, Chu CS, Chung KH and Lee MC. Effects of posts on dentin stress distribution in pulpless teeth. Journal of Prosthetic Dentistry (Saint Louis), 1992; 68(3):421-427.
26. Tanaka M, Naito T, Yokota M and Kohno M. Finite element analysis of the possible mechanism of cervical lesion formation by occlusal force.
Journal of Oral Rehabilitation (Oxford), 2003; 30(1):60-67.
27. Dong XD and Ruse ND. Fatigue crack propagation path across the dentinoenamel junction complex in human teeth. Journal of Biomedical
Material Research Part A (Hoboken), 2003; 66(1):103-109.
28. Callister WDJ. Materials science and engineering: an introduction. New York: Wiley and Sons; 1994.
19. Betamar N, Cardew G and Van Noort R. The effect of variations in hourglass specimen design on microtensile bond strength to dentin.
Journal of Adhesive Dentistry (Carol Stream), 2007; 9(5):427-436.
20. Betamar N, Cardew G and Van Noort R. Influence of specimen designs on the microtensile bond strength to dentin. Journal of Adhesive Dentistry (Carol Stream), 2007; 9(2):159-168.
21. Silva NR, Calamia CS, Harsono M, Carvalho RM, Pegoraro LF, Fernandes CA, et al. Bond angle effects on microtensile bonds: Laboratory and FEA comparison. Dental Materials (Kidlinton), 2006; 22(4):314-324.
22. Perdigao J, Geraldeli S. Bonding characteristics of self-etching adhesives to intact versus prepared enamel. Journal of esthetic and restorative
dentistry (Hamilton), 2003; 15(1):32-41.