Stability of the animal model of oleic
acid-induced acute lung injury*
Estabilidade do modelo animal de lesão pulmonar aguda induzida por ácido oleico
Eduardo Gaio, César Augusto de Melo e Silva, Flávio Brito, Marco Aurélio Pereira Firmino, Rodrigo Storck, Eduardo Freitas
Abstract
Objective: To evaluate the stability of hemodynamic, respiratory and gas exchange variables in an animal model of oleic acid-induced acute lung injury. Methods: This was an experimental study involving 10 mongrel dogs. The variables were measured at baseline, as well as at 30, 60, 90 and 120 min after the administration of oleic acid. In order to analyze repeated measurements, linear and quadratic effects were tested. Mixed linear models with diversified variance and covariance structures were used, depending on the variable studied. Results: We found that mean arterial blood pressure stabilized at 30 min, as did heart rate, pulmonary arterial pressure and pulmonary capillary pressure at 60 min. Respiratory rate, tidal volume, minute volume and respiratory work stabilized at 30 min. Regarding gas exchange variables, PaO2, PaO2/FiO2 ratio and pulmonary shunt fraction stabilized at 30 min. The remaining variables maintained a continuous rise or fall. Conclusions: This oleic acid-induced acute lung injury model is stable for some of the variables tested, although stabilization occurs at different times. The respiratory and gas exchange variables stabilized at 30 min, whereas the hemodynamic variables stabilized at 60 min.
Keywords: Respiratory distress syndrome, adult; Models, animal; Statistical analysis.
Resumo
Objetivo: Avaliar a estabilidade das variáveis hemodinâmicas, da mecânica respiratória e de troca gasosa do modelo animal de lesão pulmonar aguda induzida por ácido oleico. Métodos: Trata-se de um estudo experimental no qual foram utilizados 10 cães de raça indeterminada. As variáveis foram aferidas inicialmente e em 30, 60, 90 e 120 min após a administração do ácido oleico. Para analisar as medidas repetidas, foram testados efeitos lineares e quadráticos e foram utilizados ajustes de modelos lineares mistos com estruturas de variâncias e covariâncias diversificadas, dependendo da variável analisada. Resultados: Observamos estabilidade da pressão arterial média aos 30 min, assim como da frequência cardíaca, da pressão arterial pulmonar e da pressão de capilar pulmonar aos 60 min. Frequência respiratória, volume corrente, volume minuto e trabalho respiratório estabilizaram aos 30 min. Quanto às variáveis de troca gasosa, PaO2, relação PaO2/FiO2 e fração de shunt pulmonar estabilizaram-se aos 30 min. As demais variáveis mantiveram-se em ascensão ou queda contínuas. Conclusões: O modelo de lesão pulmonar aguda induzida por ácido oleico é estável para algumas das variáveis testadas; porém, a estabilização se dá em momentos diferentes. As variáveis da mecânica respiratória e de troca gasosa estabilizaram em 30 min, e as hemodinâmicas, em 60 min.
Descritores: Síndrome do desconforto respiratório do adulto; Modelos animais; Análise estatística.
*Study carried out in the Laboratory of Respiratory Physiology, University of Brasília, Brasília, Brazil.
Correspondence to: Eduardo Gaio. SQN 311, Bloco D, apto. 102, Asa Norte, CEP 70757-040, Brasília, DF, Brasil. Tel 55 61 3307-3224. E-mail: eduardogaio@unb.br
Financial support: None.
Submitted: 9 December 2008. Accepted, after review: 22 April 2009.
Introduction
Acute lung injury (ALI) is a common entity, the evolution of which is occasionally rapid and usually severe. Its incidence varies by age bracket and has increased in recent years.(1) Invariably, individuals with ALI require intensive care and mechanical ventilation. The study of the
of time on the evolution of those variables is not the most appropriate.(16) On the basis of this understanding, we studied, in function of time, the evolution of variables related to the hemodynamic and mechanical properties of the respiratory system, as well as that of gas exchange variables, in a model of OA-induced ALI. In addition, we tested the stability of those variables.
Methods
Preparation of the animals
This was an experimental study involving 10 male mongrel dogs, each weighing over 18 kg. The study was approved by the Animal Research Ethics Committee of the University of Brasília. The animals were initially sedated with i.v. thionembutal (30 mg/kg), were placed on the surgical table and were intubated with an 8.5-gauge orotracheal cannula. Two types of vascular access were installed in the right inguinal region: a venous access, for the admi-nistration of sedation and analgesia, and an arterial access, for the collection of blood for blood gas analysis and for the monitoring of mean arterial pressure (MAP). Venous access opening pressure, so that titration of
mecha-nical ventilation parameters is necessary.(2) Due to the complexity of its pathophysiology and to interactions in other systems, especially the cardiovascular system, ALI is the object of study in various fields of medical science. The animal models most commonly used in order to induce ALI are as follows: bronchoalveolar lavage with saline solution; intraperitoneal administration of paraquat; ischemia and reperfusion; and adminis-tration of oleic acid (OA) to the nervous system.(3) Administration of OA to the nervous system was initially used as an animal model of pulmonary embolism.(4) Subsequently, the OA-induced inflammatory injury was evaluated,(5) this inflammatory injury being similar to that natu-rally found in lung injury.(6) Venous infusion of OA causes capillary endothelial injury,(7) has little effect on the relaxation/ contraction properties of the endothelium,(8) respects gravity-dependent areas(9) and is dose-dependent.(10) Gas exchange is known to worsen, although there is controversy regarding how long it takes the physiological variables to stabilize after OA administration. (11-14) Depending on the dose used, it is possible
to keep the animal alive for up to seven days, although the evolution of the biological varia-bles is debatable.(15) In addition, the statistical methodology used in demonstrating the effects
Table 1 - Means of hemodynamic, respiratory and gas exchange variables during the experiment.
Variable t0 t1 t2 t3 t4
HR, bpm 142.4 ± 20.4 128.4 ± 15.4 151.6 ± 22.5 152.6 ± 22.4 157.0 ± 21.5 MAP, mmHg 125.5 ± 16.9 108.9 ± 14.2 96.9 ± 16.0 104.3 ± 7.3 102.0 ± 14.0 PAP, cmH2O 15.8 ± 5.5 15.8 ± 4.1 15.6 ± 5.1 13.9 ± 4.4 15.0 ± 5.5 PCP, cmH2O 5.2 ± 2.1 4.0 ± 1.9 3.3 ± 2.4 3.1 ± 1.1 3.1 ± 2.0
CI, L•min−1•m2 8.25 ± 2.74 7.7 ± 2.1 7.2 ± 2.5 6.5 ± 2.8 6.2 ± 2.8
airway opening pressure. Another differential pressure transducer (same model) was connected to the esophageal cannula in order to measure esophageal pressure. The signals were filtered and amplified using a polygraph (model 7C; Grass Instruments) and subsequently sent to a biological signal conditioning module & 12-bit analog/digital converter (EMG System do Brasil, São José dos Campos, Brazil). The signals were registered and stored in a database created using the Windaq/Pro software (DATAQ Instruments, Akron, OH, USA), which was also used for the electronic integration of the flow signal in order to obtain the volume curve. The variables calcu-lated were tidal volume (VT), respiratory rate (RR), minute volume (MV, calculated as MV = VT × RR), respiratory work (W = area of the pressure-volume curve) and respiratory work per minute (calculated as W/min = W × RR). Arterial and mixed venous blood samples were collected for blood gas analysis and measurement of pulmo-nary shunt fraction, which is calculated on the basis of the systemic blood flow (Qs)/Qt ratio. The gas exchange variables measured were PaO2, mixed venous oxygen pressure (PvO2), PaCO2, mixed venous carbon dioxide pressure (PvCO2), mixed venous oxygen saturation (SvO2) and pH. The variables calculated were as follows: bicarbonate; oxygen saturation (SaO2); oxygen delivery (DO2), which was calculated using the following formula: DO2 = (SaO2 × 1.36 × hemo-globin + PaO2 × 0.0039) × CI; oxygen uptake (VO2), which was calculated using the following was maintained using 0.9% saline solution to
prevent clots. Continuous infusions of mida-zolam (0.5 μg/kg/min) and fentanyl (5.0 μg/ kg/min) were used for sedation and analgesia, those being the only continuous infusions used during the experiment. The right jugular was dissected so that a pulmonary artery catheter (model 131HF7; Edwards Lifesciences, Irvine, CA, USA) could be introduced. The location of the catheter was confirmed by the pulmonary artery pressure tracings seen on a multipara-metric monitor of biological signals (model DX 2010; Dixtal, Manaus, Brazil). Using this instrument, we collected mixed venous blood samples and measured Qt, pulmonary artery pressure (PAP), pulmonary capillary pressure (PCP) and heart rate (HR). The variables calcu-lated were the cardiac index (CI, calcucalcu-lated as CI = Qt/m2) and pulmonary vascular resistance
index (PVRI, calculated as PVRI = [PAP − PCP] ×
80/CI). The mechanical properties of the respi-ratory system and its components—lungs and rib cage—were evaluated using a Fleisch no. 0 pneumotachograph (Godart-Statham, Bilthoven, Holland) with a lateral outlet connected to the orotracheal cannula. We also used a differen-tial pressure transducer (model PT5A; Grass Instruments, Quincy, MA, USA), which was connected to the outlets of the pneumota-chograph in order to measure airflow, and a differential pressure transducer (model P23 Db; Gould-Stathan, Oxnard, CA, USA), which was connected to a lateral outlet in order to measure
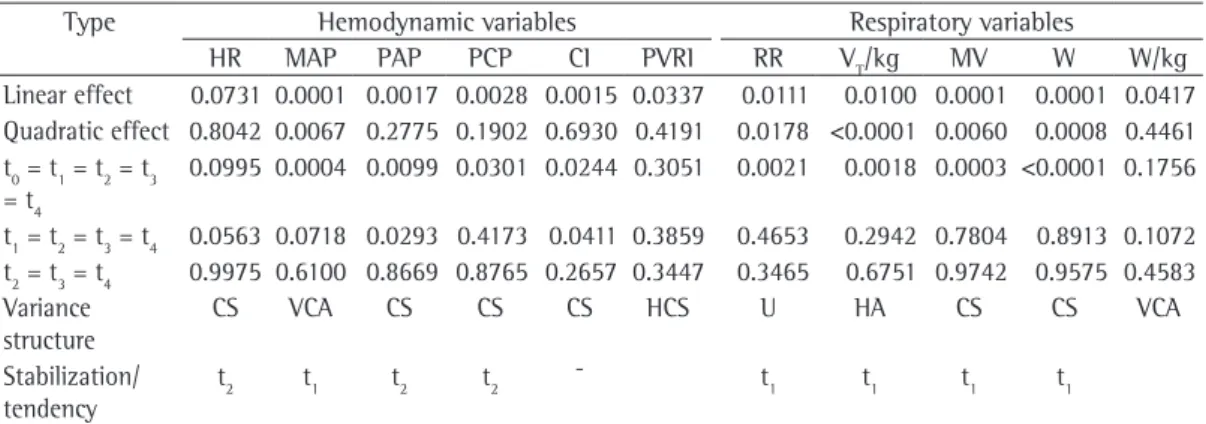
Table 2 - Values of p for the linear and quadratic effects tested, as well as variance structures, for hemodynamic and respiratory variables.
Type Hemodynamic variables Respiratory variables
HR MAP PAP PCP CI PVRI RR VT/kg MV W W/kg
Linear effect 0.0731 0.0001 0.0017 0.0028 0.0015 0.0337 0.0111 0.0100 0.0001 0.0001 0.0417 Quadratic effect 0.8042 0.0067 0.2775 0.1902 0.6930 0.4191 0.0178 <0.0001 0.0060 0.0008 0.4461 t0 = t1 = t2 = t3
= t4
0.0995 0.0004 0.0099 0.0301 0.0244 0.3051 0.0021 0.0018 0.0003 <0.0001 0.1756
t1 = t2 = t3 = t4 0.0563 0.0718 0.0293 0.4173 0.0411 0.3859 0.4653 0.2942 0.7804 0.8913 0.1072 t2 = t3 = t4 0.9975 0.6100 0.8669 0.8765 0.2657 0.3447 0.3465 0.6751 0.9742 0.9575 0.4583 Variance
structure
CS VCA CS CS CS HCS U HA CS CS VCA
Stabilization/ tendency
t2 t1 t2 t2 ¯ t1 t1 t1 t1
HR: heart rate; MAP: mean arterial pressure; PAP: pulmonary artery pressure; PCP: pulmonary capillary pressure; CI: cardiac index; PVRI: pulmonary vascular resistance index; RR: respiratory rate; VT/kg: tidal volume per body mass; MV: minute volume; W: respiratory work; W/kg: respiratory work per minute; t0: baseline; t1: 30 min; t2: 60 min; t3: 90 min; t4:
constant over time. In parallel, the hypotheses of stabilization after t1 and t2 were tested. Mixed linear models with diversified variance and cova-riance structures were used, depending on the variable studied. The effect of time was evalu-ated using the generalized minimum squares method. For stabilization to occur at t1, three conditions should be satisfied: the means at t0, t1, t2, t3 and t4 must not be equal; the mean at t0 must be different from the means at the other time points; and the means at t1, t2, t3 and t4 must not be different. For stabilization to occur at t2, another three conditions should be met: the means at t0, t1, t2, t3 and t4 must not be equal; the means at t0 and t1 must be different from the means at t2, t3 and t4; and the means at t2, t3 and t4 must not be different from one another. In order to reduce the alpha error, we chose to previously define the hypo-theses and not to test all time points in relation to one another. The variables were evaluated for normal distribution using the Shapiro-Wilk test. formula: VO2 = ([SaO2 − SvO2] × 1.36 × hemo
-globin + [PaO2 − PvO2] × 0.0039) × IC; oxygen extraction ratio (O2ER), which was calculated using the following formula: O2ER = VO2/DO2; PaO2/FiO2 ratio; and Qs/Qt.
Experimental protocol
After the values had stabilized, the variables described above were measured, and this was considered the baseline, designated time point 0 (t0). The dogs were maintained on spontaneous ventilation throughout the experiment, FiO2 being 0.21. Five minutes after those variables were measured, ALI was induced by administra-tion of OA (0.15 mg/kg for 10 min) through the proximal port of the pulmonary artery catheter. Hemodynamic, gas exchange and respiratory variables were assessed again at 30, 60, 90 and 120 min (t1, t2, t3 and t4, respectively) after the administration of OA. After the last variables had been assessed, the dogs were euthanized with a solution of KCl.
Statistical methods
The results were presented as mean ± SD. The null hypothesis was that the means of hemody-namic, respiratory and gas exchange variables were similar at t0, t1, t2, t3 and t4. The possibility that the means of the variables at t0 were diffe-rent from those at the other time points and that the latter were similar to one another was the most plausible, which would signify stabi-lity after t1 or t2. The methodology used had a repeated measure design. In order to determine whether a polynomial, a linear or a quadratic function reasonably fit the data, an analysis of linear or quadratic tendency was performed. As a result, if the data fit only the linear effect, the mean of the variable would increase or decrease over time, and there would therefore be no stabilization. If solely the quadratic effect fit the data, the mean of the variable would increase or decrease up to a certain time point and would subsequently decrease or increase from that point onward. Therefore, there would be no stabilization. If the linear effect and the quadratic effect were present, the mean of the variable would markedly increase or decrease and, from a certain time point onward, could indicate stabilization. If none of the effects fit the data, the mean of the variable would remain
Time (min)
*not statistically significant
Figure 1 - Oxygen index over time.
Shu
n
t
fra
cti
on
(
%
)
Time (min) *not statistically significant
or a tendency toward stabilization occurred, are shown in Table 2.
Regarding respiratory variables, a significant p value was observed for RR, VT (mL/kg body weight), MV and W in the analysis of linear and quadratic effects. All of those variables stabi-lized at t1. Only W/min increased indefinitely. The findings regarding these variables are shown in Table 2.
After the administration of OA, PaO2, SaO2, PaO2/FiO2 (Figure 1) and Qs/Qt (Figure 2) changed immediately, stabilizing at t1. The
alveolar-arterial oxygen gradient (P[A-a]O2) stabilized at t2. During the experiment, VO2 did not change, whereas O2ER and pH increased. In addition, PaCO2 and bicarbonate decreased. None of the altered parameters stabilized. Since DO2 did not present a normal distribution, it was transformed into a neperian logarithm. There was a continuous decline in DO2, without stabili-zation. The effects tested, as well as the variance and covariance structures of these variables, are shown in Table 3.
Discussion
For decades, intravenous OA has been admi-nistered in order to mimic pulmonary embolism in animal models,(4) and, since the 1970s, it has been administered in models of ALI.(5) One group of authors(17) conducted a study involving 22 dogs, who were kept alive for seven days in order to evaluate the various stages of the pathophysiology of ALI. That study revealed that The level of statistical significance was set at
5% for all analyses. The SAS software (Statistical Analysis System, Cary, NC, USA) was used for all analyses described.
Results
Ten male mongrel dogs, with a mean weight of 26.7 ± 4.5 kg, were used. All of the animals survived until the end of the experiment. The values observed at the respective time points are presented in Table 1. For all variables, linear and quadratic effects were tested. For those variables that fit these effects, we tested the hypotheses that their means did not differ at t1, t2, t3 and t4 or at t2, t3 and t4, which would signify stability at t1 or at t2, respectively. All variables, with the exception of DO2, showed parametric distribu-tion by the Shapiro-Wilk test.
Regarding hemodynamic variables, the analysis of linear and quadratic effects revealed that these effects were present for MAP, which stabilized at t1. For HR, PAP and PCP, although no significance was found in the analysis of linear and quadratic effects, the values obtained at t2, t3 and t4 (p = 0.9975, p = 0.8669 and p = 0.8765, respectively) were remarkably close, which suggests stabilization from t2 onward. We observed that the CI and PVRI did not stabilize. The p values for linear and quadratic effects and for the comparison of the time points for each of the hemodynamic variables studied, as well as the types of variance and covariance structure found and the time point at which stabilization
Table 3 - Values of p for the linear and quadratic effects tested, as well as variance structures, for gas exchange variables.
Gas exchange variables
PaO2 SaO2 P(A-a) O2
PaO2/ FiO2
Qs/Qt lnDO2 VO2 VO2/ DO2
pH PaCO2 HCO3−
Linear effect <0.0001 0.0083 0.0001 <0.0001 0.0229 0.0001 0.6907 0.0038 0.8213 0.0213 0.0038 Quadratic
effect
0.0007 0.0248 0.0451 0.0007 0.0139 0.3939 0.2528 0.5011 0.0055 0.2542 0.7119
t0 = t1 = t2 = t3 = t4
<0.0001 0.0182 <0.0001 <0.0001 0.0001 0.0012 0.7497 0.0197 0.0158 0.0008 0.0022
t1 = t2 = t3 = t4 0.4813 0.1578 0.0077 0.4813 0.5646 0.0083 0.5841 0.2242 0.1034 0.0009 0.0002 t2 = t3 = t4 0.4299 0.1186 0.0991 0.4300 0.6177 0.0283 0.3860 0.1823 0.4760 0.0773 0.0030 Variance
structure
CS U HCS CS U HCS U HCS CS U U
Stabilization/ tendency
30’ 30’ 60’ 30’ 30’ ¯ constant ¯ ¯
SaO2: arterial oxygen saturation; P(A-a)O2: alveolar-arterial oxygen gradient; PaO2/FiO2: oxygen index; Qs/Qt: pulmonary shunt fraction; lnDO2: neperian logarithm of oxygen delivery; VO2: oxygen uptake; O2ER: oxygen extraction ratio; HCO3
−:
VT decreased. This determined the decrease in PaCO2 and the nonstabilization of pH. We were unable to measure respiratory system compliance or resistance due to the high RRs observed. However, W decreased in each respi-ratory effort due to the significant decrease in VT, although W/min increased throughout the experiment, suggesting a constant increase in compliance or airflow resistance and, therefore, in pulmonary impedance. When OA is adminis-tered, pulmonary compliance can increase up to three times in relation to its baseline value.(22) It is also known that there is an increase in airway resistance, measured by using various methods, due to the accumulation of secretion.(23) One group of authors(24) measured the wet-to-dry weight ratio in pigs and observed that this ratio increased significantly in the group that received OA, compared with the control group, which suggests worsening of compliance. Using forced oscillation, the authors of another study(25) demonstrated an increase in airway opening pressure, although without stabilization for up to 140 min. The principal events responsible for the increase in compliance are the accumulation of liquid in the alveolar and interstitial space and the increase in surface tension. Since Qs/ Qt seems to correlate with the severity of the lesion, the extravasation of intra-alveolar fluid tends to decrease during the experiment. With a 0.09 mL/kg dose of OA, shunt values are higher than 40%.(26) Using 0.08 mL/kg, other authors(12) registered shunt values of up to 35%. Those authors also demonstrated the decrease in and the stabilization of PaO2 in the first 30 min, this condition persisting for 4 h. Another group of authors(27) found lower, basal fractions of Qs/Qt than those found in our study, approximately 15-20%. The dose used in the present study (0.15 mL/kg) explains the high Qs/Qt levels found. The 0.08 mL/kg dose of OA reduced the PaO2/FiO2 ratio from 451 to 139.(8)
Recent studies have relied on the poten-tial stability of the OA-induced ALI model.(28,29) All of the studies that assessed the stability of this animal model used ANOVA with repeated measures as the statistical methodology. There are two traditional methodologies for the study of longitudinal variables: univariate ANOVA with repeated measures and multivariate ANOVA with repeated measures. Unfortunately, these traditional methodologies are limited because, Qs/Qt and P(A-a)O2 returned to values close to
respiratory variables stabilize early, whereas hemodynamic variables stabilize later.
References
1. Rubenfeld GD, Caldwell E, Peabody E, Weaver J, Martin DP, Neff M, et al. Incidence and outcomes of acute lung injury. N Engl J Med. 2005;353(16):1685-93.
2. Jedliska B, Mellström A, Jönsson K, Hartmann
M. Influence of positive end-expiratory pressure ventilation on peripheral tissue perfusion evaluated by measurements of tissue gases and pH. An experimental study in pigs with oleic acid lung injury. Eur Surg Res. 2000;32(4):228-35.
3. Matute-Bello G, Frevert CW, Martin TR. Animal models of acute lung injury. Am J Physiol Lung Cell Mol Physiol. 2008;295(3):L379-99.
4. Ashbaugh DG, Uzawa T. Respiratory and hemodynamic changes after injection of free fatty acids. J Surg Res. 1968;8(9):417-23.
5. King EG, Wagner WW Jr, Ashbaugh DG, Latham LP, Halsey DR. Alterations in pulmonary microanatomy after fat embolism. In vivo observations via thoracic window of the oleic acid-embolized canine lung. Chest. 1971;59(5):524-30.
6. Schuster DP. ARDS: clinical lessons from the oleic acid model of acute lung injury. Am J Respir Crit Care Med. 1994;149(1):245-60.
7. Beilman G. Pathogenesis of oleic acid-induced lung injury in the rat: distribution of oleic acid during injury and early endothelial cell changes. Lipids. 1995;30(9):817-23.
8. Kafi SA, Scillia P, Mélot C, Gevenois PA, Pagnamenta A, Naeije R. Abnormal pulmonary vascular tone in canine oleic acid lung injury. Crit Care Med. 2002;30(7):1565-9.
9. Suga K, Ogasaware N, Matsunaga N, Sasai K. Perfusion characteristics of oleic acid--injured canine lung on Gd-DTPA--enhanced dynamic magnetic resonance imaging. Invest Radiol. 2001;36(7):386-400.
10. Julien M, Hoeffel JM, Flick MR. Oleic acid lung injury in sheep. J Appl Physiol. 1986;60(2):433-40.
11. Hofman WF, Ehrhart IC, Granger WM, Miller DA. Sequential cardiopulmonary changes after oleic-acid injury in dogs. Crit Care Med. 1985;13(1):22-7. 12. Sum-Ping ST, Symreng T, Jebson P, Kamal GD. Stable
and reproducible porcine model of acute lung injury induced by oleic acid. Crit Care Med. 1991;19(3):405-8. 13. Davidson KG, Bersten AD, Barr HA, Dowling KD,
Nicholas TE, Doyle IR. Lung function, permeability, and surfactant composition in oleic acid-induced acute lung injury in rats. Am J Physiol Lung Cell Mol Physiol. 2000;279(6):L1091-102.
14. McGuigan RM, Mullenix P, Norlund LL, Ward D, Walts M, Azarow K. Acute lung injury using oleic acid in the laboratory rat: establishment of a working model and evidence against free radicals in the acute phase. Curr Surg. 2003;60(4):412-7.
15. Luce JM, Huang TW, Robertson HT, Colley PS, Gronka R, Nessly ML, et al. The effects of prophylactic expiratory positive airway pressure on the resolution of oleic acid-induced lung injury in dogs. Ann Surg. 1983;197(3):327-36.
16. Grotjohan HP, van der Heijde RM, Wagenvoort CA, Wagenvoort N, Versprille A. Pulmonary vasoconstriction
a priori, they make assumptions that are false more often than not. Univariate analysis assumes that the variance and covariance structure of the events measured over time is symmetrical, which might not be true when the variances tend to increase over time and the correlations tend to decrease as the time intervals increase. The other alternative—multivariate analysis for repeated measures—only includes subjects with complete data, not allowing for potential losses during the study. In addition, these procedures estimate the tendencies of the group over time and pay little attention to individual changes. For these and other reasons, mixed models employing covariance have become popular as useful and powerful tools for the study of longitudinal data. In one interesting study,(30) the researchers compared procedures for the analysis of repe-ated measures, highlighting the importance of the use of mixed linear models in a two-stage approach. In the first stage, the covariance structure is estimated. In the second stage, the estimate of covariance is replaced in the linear mixed model by the evaluation of the effect of time on the variable studied. In our study, we observed covariance structures that were symmetrical, heterogeneous, autoregressive and unstructured. The mixed linear model described a relationship among the values obtained for a certain variable at five time points as a function of their mean, of the inter-animal effect and of the intra-animal effect.
We are sure that, by increasing the number of animals, extending the study period and shor-tening the intervals between measurements of variables, we would gain a better understanding of the evolution and stability of hemodynamic, respiratory and gas exchange variables in OA-induced ALI. Forced oscillometry can assess respiratory mechanics in spontaneous ventilation more accurately, since, when the RR is high, it is not possible to perform end-inspiratory airway occlusion. The other techniques for measuring compliance and airflow resistance would require maneuvers that could change hemodynamic parameters, which would not be desirable in this case.
24. Darien BJ, Saban MR, Hart AP, MacWilliams PS, Clayton MK, Kruse-Elliott KT. Morphometric analysis of oleic acid-induced permeability pulmonary edema: correlation with gravimetric lung water. Shock. 1997;8(1):61-7. 25. Räsänen J, Gavriely N. Detection of porcine oleic
acid-induced acute lung injury using pulmonary acoustics. J Appl Physiol. 2002;93(1):51-7.
26. Leeman M, Closset J, Vachiéry JL, Lejeune P, Mélot C, Naeije R. Sinoaortic deafferentation reduces intrapulmonary shunt in dogs with oleic acid lung injury. J Appl Physiol. 1989;67(2):833-8.
27. Nunes N, Martins SE, Santos PS, Rezende ML. Effects of desflurane, sevoflurane and isoflurane on pulmonary shunt in dogs during spontaneous ventilation. Arq Bras Med Zootec. 2003;55(2):173-177.
28. Nakazawa K, Yokoyama K, Yamakawa N, Makita K. Effect of positive end-expiratory pressure on inflammatory response in oleic acid-induced lung injury and whole-lung lavage-induced lung injury. J Anesth. 2007;21(1):47-54.
29. Claesson J, Lehtipalo S, Bergstrand U, Arnerlöv C, Winsö
O. Negative mesenteric effects of lung recruitment maneuvers in oleic acid lung injury are transient and short lasting. Crit Care Med. 2007;35(1):230-8. 30. Littell RC, Henry PR, Ammerman CB. Statistical analysis
of repeated measures data using SAS procedures. J Anim Sci. 1998;76(4):1216-31.
in oleic acid induced lung injury. A morphometric study. Int J Exp Pathol. 1993;74(4):347-55.
17. Schoene RB, Robertson HT, Thorning DR, Springmeyer SC, Hlastala MP, Cheney FW. Pathophysiological patterns of resolution from acute oleic acid lung injury in the dog. J Appl Physiol. 1984;56(2):472-81. 18. Shioya S, Christman R, Ailion DC, Cutillo AG, Goodrich
KC, Morris AH. In vivo Hahn spin-echo decay (Hahn-T2) observation of regional changes in the time course of oleic acid lung injury. J Magn Reson Imaging. 2000;11(2):215-22.
19. Motohiro A, Furukawa T, Yasumoto K, Inokuchi K. Mechanisms involved in acute lung edema induced in dogs by oleic acid. Eur Surg Res. 1986;18(1):50-7. 20. Schuster DP, Perez JE, Trulock EP, Williamson JR, Biello
DR, Kenzora JL, et al. Cardiac dysfunction during acute lung injury induced by oleic acid in dogs. Am Rev Respir Dis. 1986;133(4):519-25.
21. Maarek JM, Grimbert F. Segmental pulmonary vascular resistances during oleic acid lung injury in rabbits. Respir Physiol. 1994;98(2):179-91.
22. Scharf SM, Ingram RH Jr. Effects of decreasing lung compliance with oleic acid on the cardiovascular response to PEEP. Am J Physiol. 1977;233(6):H635-41. 23. Mishima M, Balassy Z, Bates JH. Temporal response
of lung impedance after i.v. oleic acid in dogs. Respir Physiol. 1996;103(2):177-85.
About the authors
Eduardo Gaio
Professor. Department of Clinical Medicine, University of Brasília, Brasília, Brazil.
César Augusto de Melo e Silva
Head of the Department of Physical Therapy, University Hospital of Brasília, Brasília, Brazil.
Flávio Brito
Physician. Hospital de Base of the Federal District of Brasília, Brasília, Brazil.
Marco Aurélio Pereira Firmino
Resident. University Hospital of Brasília, Brasília, Brazil.
Rodrigo Storck
Physical Therapist. University Hospital of Brasília, Brasília, Brazil.
Eduardo Freitas