Authors
Jessyca Sousa de Brito 1 Natália Alvarenga Borges 1 Carla Juliana Ribeiro Dolenga 2
José Carlos Carraro-Eduardo 1
Lia Sumie Nakao 2 Denise Mafra 1
1 Universidade Federal
Fluminense.
2 Universidade Federal do
Paraná.
Submitted on: 03/16/2016. Approved on: 06/13/2016.
Correspondence to:
Jessyca Sousa de Brito. Universidade Federal Fluminense.
Rua República Dominicana, Quadra 49, Lote 11, Itaipu, Niterói, Rio de Janeiro, Brazil. CEP: 24342-780
E-mail: jessyca__sousa@ hotmail.com
Coordenação de Aperfeiçoamento de Pessoal de Nível Superior (CAPES), Conselho Nacional de Pesquisa (CNPq) e Fundação de Amparo à Pesquisa do Estado do Rio de Janeiro (FAPERJ).
Is there a relationship between tryptophan dietary intake
and plasma levels of indoxyl sulfate in chronic kidney disease
patients on hemodialysis?
Há relação entre ingestão alimentar de triptofano e níveis plasmáticos
de indoxil sulfato em pacientes renais crônicos em hemodiálise?
Introdução: A microbiota intestinal está envolvida na geração de toxinas urêmicas presentes nos pacientes com doença re-nal crônica (DRC) em hemodiálise (HD) como indoxil sulfato (IS), formado a partir da fermentação do aminoácido triptofano. Objetivo: Avaliar a ingestão de triptofano alimentar pelos pacientes renais crônicos em HD e sua possível relação com os níveis plasmáticos de IS. Métodos: Participaram do estudo 46 pacientes com DRC em pro-grama regular de HD (56,5% homens; 52,7 ± 10,3 anos; 63 (32,2-118,2) meses em HD; IMC 25,6 ± 4,9kg/m2). A ingestão de tripto-fano foi avaliada por meio do recordatório alimentar de 24 (R-24h) realizado em três diferentes dias. Exames bioquímicos de ro-tina, bem como a avaliação antropométrica foram avaliados. Os níveis plasmáticos de IS foram determinados por cromatografia lí-quida de alto desempenho (HPLC) com de-tecção fluorescente e as concentrações plas-máticas de interleucina-6 (IL-6) pelo método imunoenzimático (ELISA, Enzyme Linked Immunosorbent Assay). Resultados: A in-gestão média de triptofano estava dentro do recomendado, já os níveis plasmáticos de IS (35,0 ± 11,9mg/L) estavam elevados, porém de acordo com os valores da EUTox para indivíduos urêmicos. Não houve correlação entre a ingestão de triptofano e os níveis plas-máticos de IS. Contudo, houve correlação positiva entre ingestão de proteína e tripto-fano e variáveis que avaliam massa magra e, além disso, os níveis IS foram positivamente associados com os de IL-6 (r = 0,6: p = 0,01). Conclusão: O presente estudo sugere que a ingestão alimentar de triptofano pode não ser um fator determinante dos níveis de IS. No entanto, sugere que o intestino pode ter importante papel na inflamação sistêmica presente nos pacientes com DRC.
R
ESUMOPalavras-chave: diálise renal; falência re-nal crônica; triptofano.
Introduction: Gut microbiota is involved in generation of uremic toxins in chronic kidney disease (CKD) patients on hemo-dialysis (HD), like indoxyl sulfate (IS) that is originated from tryptophan amino acid fermentation. Objective: To evalu-ate the tryptophan intake by chronic re-nal failure patients on HD and its pos-sible relationship with IS plasma levels. Methods: Participated of the study 46 patients with CKD on HD regular pro-gram (56.5% men; 52.7 ± 10.3 years; 63 (32.2-118.2) months on HD; BMI 25.6 ± 4.9 kg/m2). The tryptophan intake was evaluated by a 24-hours dietary recall (R-24h) performed on 3 different days. Routine biochemical tests and anthropo-metric measurements were evaluated. IS plasma levels were determined by High Performance Liquid Chromatography (HPLC) with fluorescent detection and the interleukin-6 (IL-6) plasma levels by immunoenzymatic method (ELISA, Enzyme Linked Immunosorbent Assay). Results: The average of tryptophan in-take was according to recommendation, but IS plasma levels (35.0 ± 11.9 mg/L) were elevated, however according to the EUTox values for uremic individuals. There was no correlation between the tryptophan intake and IS plasma levels. However, there was positive correlation between protein intake and tryptophan and variables used to evaluate lean body mass, and moreover, IS levels were posi-tively associated with IL-6 (r = 0.6: p = 0.01). Conclusion: The present study sug-gests that tryptophan dietary intake may not be a determinant factor to IS levels. However, it suggests that gut microbiota may play an important role in systemic inflammation in patients with CKD.
A
BSTRACTKeywords: kidney failure, chronic; renal dialysis; tryptophan.
I
NTRODUCTIONPatients on hemodialysis (HD) accumulate risk factors for cardiovascular disease (CVD) and, in fact, cardiovascular death rates are higher in this population.1,2 In addition to traditional risk factors
(obesity, hypertension, diabetes, dyslipidemia, etc.) and the conditions typically seen in individuals with kidney disease (hypervolemia, anemia, altered calcium-phosphorus metabolism, etc.), these patients also have a high prevalence of emerging risk factors (high levels of homocysteine and lipoprotein a, oxidative stress, and inflammation).1,3
Studies published in the 1990s discussed the emergence of a new risk factor possibly related to inflammation and atherosclerosis: gut microbiota imbalance.4-8
Gut bacteria have different metabolic roles and promote the conversion of nutrients into a wide array of components, both beneficial and harmful to human health.9 Thus, imbalances in
the composition of the gut microbiota (dysbiosis) may lead to the production of greater amounts of uremic toxins.
Patients with CKD are affected by changes in gut microbiota, characterized by the growth of bacterial species that increase the production of toxic gases, uremic toxins, amines, ammonia, and elevate the concentrations of pathogen-associated molecular patterns (PAMPs) such as lipopolysaccharides (LPS).
Furthermore, dysbiosis compromises intestinal barrier function, making it more permeable to toxic elements.10,11 Increased intestinal barrier patency may
allow for greater influxes of urea from blood into the bowel lumen, favoring the growth of certain bacteria to the detriment of others.12
Patients with CKD are often advised to follow diets low in fermentable fibers due to the fact that these foods also serve as sources of potassium. The ensuing change in the supply of prebiotic substrates may contribute to dysbiosis in CKD.13
In addition, these patients are constantly exposed to factors such as malnutrition, edema, emotional stress (caused by the disease and psychological or pharmacological factors), constipation, and uremia, which further compromise the integrity of the intestinal barrier. This combination of factors makes these patients susceptible to increased absorption of
inflammation characterized by elevated levels of inflammatory cytokines, such as interleukins (IL) and tumor necrosis factor α (TNF-α).14
Several uremic toxins may be produced by the gut microbiota from the fermentation of nutrients reaching the intestines. For example, the synthesis of indoxyl sulfate (IS) is initiated by enterobacteria converting amino acid tryptophan to indole, which is then absorbed by the gastrointestinal tract; in the liver, hydroxylation and sulfation processes produce IS. Patients with CKD are known for having elevated serum IS levels, and such increase appears to be directly related to the progression of the disease.15
During dialysis the levels of these toxins increase, since dialysis cannot efficiently remove them.16 IS
seems to promote the progression of CKD because of its pro-fibrotic effects on glomeruli,17,18 and for
its role in the induction of endothelial dysfunction, vascular19 smooth muscle cell proliferation, and
atherosclerosis;20 it also appears to be associated with
bone disease in individuals with CKD.19,21
Tryptophan is often present in one’s diet. Intake levels of this amino acid may be related to the determination of IS serum levels, as metabolites derived from tryptophan such as IS result from the metabolism of dietary tryptophan by gut bacteria.
Considering that this uremic toxin has been related to increased risk of cardiovascular disease in patients with CKD, and that cardiovascular disease is the main cause of death of individuals with CKD, this study aimed to assess tryptophan intake levels in patients with CKD on HD and the possible correlations with IS serum levels. Additionally, the possible correlations between food intake, anthropometric parameters, and inflammatory marker interleukin-6 (IL-6) were assessed.
M
ATERIALSANDMETHODSPATIENTS
This cross-sectional study enrolled 46 male and female patients with CKD prescribed regular HD seen at the Vida Kidney Care Clinic in Rio de Janeiro, Brazil. The participants gave written consent to joining the study after being informed that their biological materials would be used in the study. Study participants had to be aged between 18 and 74 years and use an arteriovenous fistula (AVF) for vascular access.
levels were higher than 250 ml/min; dialysate flow was set at 500 ml/min; the dialysis solution was buffered with bicarbonate. Patients with autoimmune or infectious disease; cancer; AIDS; pregnant women; patients on catabolic drugs; individuals taking prebiotic, probiotic or symbiotic supplements; and patients treated with antibiotics three months before the start of the study were excluded. Demographic, clinical and routine biochemical data were obtained from patient charts, interviews, and blood tests.
ETHICS
The study design was approved by the Research Ethics Committee of the School of Medicine and the Antonio Pedro University Hospital and was assigned permit no. 083/11.
FOOD INTAKE ANALYSIS
The daily energy intake of macronutrients and tryptophan was estimated from a 24-hour dietary recall (24HR) carried out in three different days - one on a day of dialysis, one on a day the patient was off dialysis, and one weekend day. Mean intake levels were calculated with the aid of dietary assessment software NutWin®-UNIFESP. The daily intake of
energy, protein, and tryptophan was normalized for patient bodyweight. The nutrient composition of the foods not included in the database of the analytical software was obtained from the Brazilian Food Composition Chart.22
NUTRITIONAL STATUS ASSESSMENT
Nutritional status was assessed by means of the following anthropometric parameters: bodyweight; height; arm circumference; waist circumference; and skinfold thickness. The measurements were performed after HD sessions with the aid of a Lange Skinfold Caliper (Cambridge Scientific Industries Inc.). The patients were categorized in accordance with the criteria of the World Health Organization (WHO) for body mass index (BMI), calculated using the formula weight over the squared height.23,24
The corrected arm muscle area (CAMA) adjusted for bone was calculated to assess muscle mass. Fat tissue was estimated through body fat percentage (BFP) calculations. The thicknesses of the biceps, triceps, subscapular, and suprailiac skinfolds were
measured and summated to estimate body density (BD) with the Durnin and Womersely equations.25
BD values were used to infer total body fat from the Siri equation.26 The BFP reference values proposed
by Lohman27 were adopted in this study. The patients’
body fat distribution profiles were defined based on waist circumference (WC) measurements and the cutoff points suggested by the WHO.28
BLOOD COLLECTION
Blood samples were taken in the morning, with patients fasting for 12 hours. Blood was collected in tubes with ethylenediaminetetraacetic acid (EDTA) as an anticoagulant (1 mg/mL). The samples were then centrifuged at 2500 rpm for 10 minutes at 4 °C to separate the plasma portion. Plasma was then placed in 1.5 ml polypropylene Eppendorf tubes, and stored at - 80° C for further analysis.
DETERMINATION OF SERUM IL-6 AND INDOXYL SULFATE LEVELS
Enzyme Linked Immunosorbent Assay (ELISA) kit Boster Immunoleader (Boster Biological Technology Co. Ltd.) was used to measure serum IL-6 levels.
The blood samples were processed as described above before total IS levels (free and protein-bound fractions) were measured.29 The samples were
briefly diluted in water and heated to 95°C for 30 minutes. Then they were cooled down (10 min on ice) and ultrafiltrated (Amicon Ultra 30 kDa - Millipore, Billerica, MA). The ultrafiltrate (10uL) was analyzed.
The serum levels of toxin IS were determined by high performance liquid chromatography (HPLC) - Shimadzu Prominence - with a pump (LC-20AD Shimadzu) controlled by software program LC Solution and a fluorescence detector (RF-20A Shimadzu), and a manual injector (7125 Rheodyne).
TABLE 1 GENERALCHARACTERISTICSAND
ANTHROPOMETRICMEASUREMENTSOFPATIENTS WITHCHRONICKIDNEYDISEASEONHD
Parameter Patients (n = 46)
Age (years) 52.8 ± 10.3
Time on HD (months) 63 (32.2 - 118.2)
BMI (kg/m2) 25.6 ± 4.9
CAMA (cm2) 42.2 ± 11.2
FFM (Kg) 48.8 ± 11.4
BFP 29.4 ± 7.9
WC (cm) 93.0 ± 13.6
HD: hemodialysis; BMI: body mass index, CAMA: corrected arm muscle area; BFP: body fat percentage; WC: waist circumference; FFM: fat-free mass.
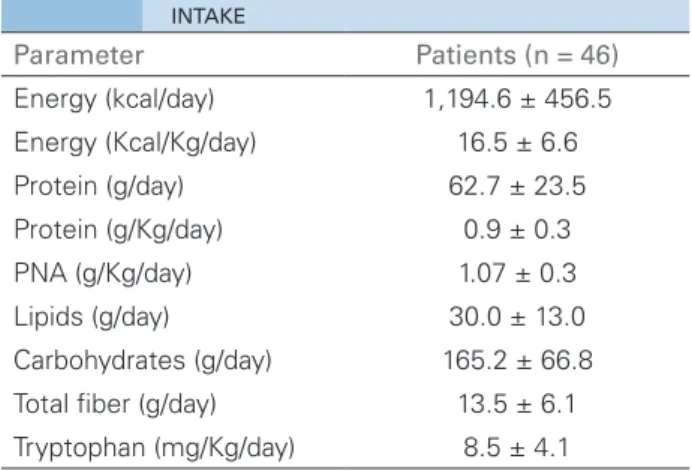
TABLE 2 ENERGY, MACRONUTRIENT, ANDTRYPTOPHAN
INTAKE
Parameter Patients (n = 46)
Energy (kcal/day) 1,194.6 ± 456.5 Energy (Kcal/Kg/day) 16.5 ± 6.6
Protein (g/day) 62.7 ± 23.5
Protein (g/Kg/day) 0.9 ± 0.3
PNA (g/Kg/day) 1.07 ± 0.3
Lipids (g/day) 30.0 ± 13.0 Carbohydrates (g/day) 165.2 ± 66.8
Total fiber (g/day) 13.5 ± 6.1
Tryptophan (mg/Kg/day) 8.5 ± 4.1 curves were built for each set of processed samples.
Calibration samples were prepared with serum from healthy donors and processed with the studied samples.
Measurements were validated in terms of the following parameters: precision, accuracy, calibration curve, residual effect, calibration sample effect, selectivity, and stability, according to the guidelines of ANVISA Resolution RDC 27/2012. The relative retention of IS was assessed by the ratio between the mean and normal levels of indoxyl sulfate as defined by the European Uremic Toxin Work Group (EUTox; 0.6 mg/L).
STATISTICALANALYSIS
The Kolmogorov-Smirnov test was used to assess the distribution of the variables; the results ensuing from the analysis were expressed in the form of mean values ± SD (standard deviation), median values (interquartile range), or percent values whenever appropriate. Pearson’s correlation coefficient or Spearman’s rank correlation coefficient was used to assess the correlations between variables. A confidence interval of 95% was adopted and p-values < 0.05 were deemed statistically significant. Statistical analyses were performed on SPSS (19.0).
R
ESULTSTable 1 shows the patients’ general characteristics and anthropometric parameters. Forty-six individuals on dialysis for a mean of 63 (32.2-118.2) months were included in the study; 26 were males. The main cause of CKD was hypertensive nephrosclerosis (68.9%).
Mean macronutrient and tryptophan intakes are shown in Table 2. All patients had energy intake levels below the recommended weight maintenance daily values (30-35 kcal/kg). None of the patients was able to reach the protein intake levels recommended for individuals on HD (1.2-1.4 g/kg/day). Interestingly, the mean intake of tryptophan was 8.5 mg/kg/day, a level similar to the Dietary Reference Intake (DRI) of 8 mg/kg/day.
Table 3 shows the serum levels of routine biochemical parameters, IL-6, and IS. The mean IS serum level observed in our group of patients was consistent with the levels seen in uremic subjects described by the EUToX. The relative retention of IS in the patients in our study was equivalent to 58.4 times the normal retention levels.
Anthropometric measurements revealed that the majority of the patients (57.1%) had normal-range BMIs (18.5 - 24.9 kg/m2), while 28.6%
were overweight (25 - 29.9 kg/m2) and 14.3%
were obese (≥ 30 kg/m2). According to the BMI,
none of the patients was malnourished (< 18.5 kg/m2).
TABLE 3 BIOCHEMICALPARAMETERSOFPATIENTSON
HD
Parameter Patients (n = 46)
Pre-HD urea (mg/dL) 148.8 ± 65.9
Creatinine (mg/dL) 10.4 ± 3.3
Albumin (g/dL) 4.2 ± 0.3
Hematocrit (%) 34.9 ± 3.6
Hemoglobin (g/dL) 11.5 ± 1.3
IL-6 (pg/ml) 38.2 (21.3 - 57.1)
IS (mg/L) 35 ± 11.9
HD: hemodialysis; IL-6: interleukin-6; IS: indoxyl sulfate.
No correlation was found between IS levels and tryptophan intake. However, the levels of the uremic toxin correlated positively with IL-6 serum levels (r = 0.6; p = 0.011). A positive association was also observed between protein intake and indices used to assess lean mass, such as CAMA (r = 0.521; p = 0.008) and fat-free mass (FFM; r = 0.492; p = 0.017). The same was seen for tryptophan intake in relation to these variables (tryptophan vs. CAMA: r = 0.558, p = 0.004; tryptophan vs. FFM: r = 0.470; p = 0.008).
D
ISCUSSIONSince tryptophan is metabolized by gut bacteria into a substrate for the synthesis of uremic toxin indoxyl sulfate, the present study aimed to verify whether the intake of this amino acid by patients with CKD on HD was correlated with total IS serum levels. The observed results failed to reveal such correlation. However, the IS levels were positively associated with levels of inflammatory marker IL-6, and that protein and tryptophan intake were positively correlated with lean mass parameters.
Despite the low levels of food intake reported by the patients, mean tryptophan intake lay within the range recommended in the Dietary Reference Intakes (DRI). Food intake was estimated from 24-hour dietary recalls - a fast, low-cost, easy-to-apply method nonetheless dependent on respondent memory and cooperation, also known for lacking accuracy at recording the exact amounts of food the patients ingested.
However, in the absence of simple and accessible biomarkers to determine food intake, assessment methods obtained by self-report have been widely
used to evaluate energy intake in clinical and epidemiological trials. Thus, the 24HR was applied in three different occasions with the purpose of increasing accuracy.
Despite the patients’ low levels of protein intake, tryptophan intake was found to be within the recommended thresholds. This occurred because the main dietary sources of tryptophan were high biological value proteins (such as meat and dairy products).
Tryptophan intake is unquestionably involved in the production of IS in the gut, since it is a substrate required for the formation of indoxyl sulfate; nonetheless, this study demonstrated that tryptophan intake does not alter the circulating levels of IS, thus reinforcing the idea that gut bacteria play a dominant role in the production of IS and other toxic solutes. In addition to nutrition, individuals with CKD have several associated conditions that might interfere with these variables.14
Protein and tryptophan intake levels correlated positively with indicators of lean body mass in patients with CKD, demonstrating the importance of protein intake, and high biological value protein in particular, in maintaining the nutritional status of individuals exposed to various catabolic factors.30
The correlation observed between IS and IL-6 serum levels suggests that the gastrointestinal tract, as it produces toxic metabolites such as IS, may contribute to the onset of chronic inflammation frequently found in patients with CKD.31
Thus, our results suggest that nutritional management practices designed to modulate IS serum levels in patients with CKD should not be based on the reduction of food sources of tryptophan, as such an approach does not appear to affect IS serum levels and may jeopardize the nutritional status of these individuals.
A
CKNOWLEDGEMENTSCouncil of Technological and Scientific Development (CNPq); and the Research Support Foundation of the State of Rio de Janeiro (FAPERJ) for their financial support.
R
EFERENCES1. Bayés B, Pastor MC, Bonal J, Foraster A, Romero R. Oxidative stress, inflammation and cardiovascular mortality in haemodialysis-role of seniority and intravenous ferrotherapy: analysis at 4 years of follow-up. Nephrol Dial Transplant 2006;21:984-90. DOI:http://dx.doi. org/10.1093/ndt/gfi294
2. Baurmeister U, Vienken J, Ward RA. Should dialysis modalities be designed to remove specific uremic toxins? Semin Dial 2009;22:454-7.
3. Stenvinkel P. Inflammation as a target for improving health in chronic kidney disease. F1000 Med Rep 2010;2:88. DOI:http://dx.doi.org/10.3410/M2-88
4. Bammens B, Evenepoel P, Verbeke K, Vanrenterghem Y. Impairment of small intestinal protein assimilation in patients with end-stage renal disease: extending the malnutrition-inflammation-atherosclerosis concept. Am J Clin Nutr 2004;80:1536-43. PMID: 15585765
5. Bammens B, Evenepoel P, Keuleers H, Verbeke K, Vanrenterghem Y. Free serum concentrations of the protein-bound retention solute p-cresol predict mortality in hemodialysis patients. Kidney Int 2006;69:1081-7. PMID: 16421516 DOI: http://dx.doi.org/10.1038/sj.ki.5000115 6. Schepers E, Meert N, Glorieux G, Goeman J, Van der
Eycken J, Vanholder R. P-cresylsulphate, the main in vivo
metabolite of p-cresol, activates leucocyte free radical production. Nephrol Dial Transplant 2007;22:592-6. DOI: http://dx.doi.org/10.1093/ndt/gfl584
7. Meijers BK, Bammens B, De Moor B, Verbeke K, Vanrenterghem Y, Evenepoel P. Free p-cresol is associated with cardiovascular disease in hemodialysis patients. Kidney Int 2008;73:1174-80. DOI: http://dx.doi.org/10.1038/ki.2008.31
8. Musso G, Gambino R, Cassader M. Interactions between gut microbiota and host metabolism predisposing to obesity and diabetes. Annu Rev Med 2011;62:361-80. DOI: http:// dx.doi.org/10.1146/annurev-med-012510-175505
9. Blaut M, Clavel T. Metabolic diversity of the intestinal microbiota: implications for health and disease. J Nutr 2007;137:751S-5S.
10. Vaziri ND. CKD impairs barrier function and alters microbial flora of the intestine: a major link to inflammation and uremic toxicity. Curr Opin Nephrol Hypertens 2012;21:587-92. DOI: http://dx.doi.org/10.1097/MNH.0b013e328358c8d5 11. Wong J, Piceno YM, DeSantis TZ, Pahl M, Andersen
GL, Vaziri ND. Expansion of urease- and uricase-containing, indole- and p-cresol-forming and contraction of short-chain fatty acid-producing intestinal bacteria in ESRD. Am J Nephrol 2014;39:230-7. DOI:http://dx.doi. org/10.1159/000360010
12. Hauser AB, Stinghen AE, Gonçalves SM, Bucharles S, Pecoits-Filho R. Gut feeling on endotoxemia: causes and consequences in chronic kidney disease. Nephron Clin Pract 2011;118:c165-72. DOI: http://dx.doi.org/10.1159/000321438
13. Lau WL, Kalantar-Zadeh K, Vaziri ND. The Gut as a Source of Inflammation in Chronic Kidney Disease. Nephron 2015;130:92-8. DOI:http://dx.doi.org/10.1159/000381990
14. Mafra D, Fouque D. Gut microbiota and inflammation in chronic kidney disease patients. Clin Kidney J 2015;8:332-4. DOI:http://dx.doi.org/10.1093/ckj/sfv026
15. Schulman G. A nexus of progression of chronic kidney disease: charcoal, tryptophan and profibrotic cytokines. Blood Purif 2006;24:143-8. DOI: http://dx.doi. org/10.1159/000089451
16. Deltombe O, Van Biesen W, Glorieux G, Massy Z, Dhondt A, Eloot S. Exploring Protein Binding of Uremic Toxins in Patients with Different Stages of Chronic Kidney Disease and during Hemodialysis. Toxins (Basel) 2015;7:3933-46. DOI:http://dx.doi.org/10.3390/toxins7103933
17. Motojima M, Hosokawa A, Yamato H, Muraki T, Yoshioka T. Uremic toxins of organic anions up-regulate PAI-1 expression by induction of NF-kappaB and free radical in proximal tubular cells. Kidney Int 2003;63:1671-80. PMID: 12675842 DOI: http://dx.doi.org/10.1046/j.1523-1755.2003.00906.x 18. Dou L, Bertrand E, Cerini C, Faure V, Sampol J, Vanholder
R, et al. The uremic solutes p-cresol and indoxyl sulfate inhibit endothelial proliferation and wound repair. Kidney Int 2004;65:442-51. DOI: http://dx.doi.org/10.1111/ j.1523-1755.2004.00399.x
19. Adijiang A, Goto S, Uramoto S, Nishijima F, Niwa T. Indoxyl sulphate promotes aortic calcification with expression of osteoblast-specific proteins in hypertensive rats. Nephrol Dial Transplantat 2008;23:1892-901. DOI: http://dx.doi. org/10.1093/ndt/gfm861
20. Taki K, Takayama F, Niwa T. Beneficial effects of Bifidobacteria in a gastroresistant seamless capsule on hyperhomocysteinemia in hemodialysis patients. J Ren Nutr 2005;15:77-80. DOI: http://dx.doi.org/10.1053/j.jrn.2004.09.028
21. Nii-Kono T, Iwasaki Y, Uchida M, Fujieda A, Hosokawa A, Motojima M, et al. Indoxyl sulfate induces skeletal resistance to parathyroid hormone in cultured osteoblastic cells. Kidney Int 2007;71:738-43. PMID: 17264878 DOI: http://dx.doi.org/10.1038/sj.ki.5002097
22. TACO. Tabela Brasileira de Composição de Alimentos. 4a ed. Campinas: Universidade Estadual de Campinas; 2011. 161 p. 23. Organização Mundial da Saúde, 1995. In: Cuppari L. Guias
de medicina ambulatorial e hospitalar da Unifesp/EPM - Nutrição clínica no adulto. São Paulo: Manole; 2005. p. 92. 24. Organização Mundial da Saúde, 1997. In: Cuppari L. Guias de medicina ambulatorial e hospitalar da Unifesp/EPM - Nutrição clínica no adulto. São Paulo: Manole; 2005. p. 92. 25. Kamimura MA, Baxmann A, Sampaio LR, Cuppari L.
Avaliação nutricional. In: Cuppari L. Guias de medicina ambulatorial e hospitalar da Unifesp/EPM - Nutrição clínica no adulto. São Paulo: Manole; 2005. p. 89-127.
26. Siri WE. Body composition from fluid space and density. In: Brozek J, Hanschel A, eds. Techniques for measuring body composition. Washington: National Academy of Sciences-National Research Council; 1961. p. 223-4.
27. Lohman TG, Roche AF, Martorell R. Anthropometric standardization reference manual: Abridged edition. Champaign: Human Kinetics Books; 1991. 90 p.
28. World Health Organization. Obesity: preventing and managing the global epidemic: report of a WHO Consultation. WHO Technical Report Series 894. Geneva: World Health Organization; 2000. 252 p.
30. Burrowes JD, Larive B, Cockram DB, Dwyer J, Kusek JW, McLeroy S, et al.; Hemodialysis (HEMO) Study Group. Effects of dietary intake, appetite, and eating habits on dialysis and non-dialysis treatment days in hemonon-dialysis patients: cross sectional results from the HEMO study. J Ren Nutr 2003;13:191-8. DOI: http://dx.doi.org/10.1016/S1051-2276(03)00069-4