De novo
Transcriptome Assembly of
Common Wild Rice (
Oryza rufipogon
Griff.)
and Discovery of Drought-Response Genes in
Root Tissue Based on Transcriptomic Data
Xin-jie Tian1☯, Yan Long2☯, Jiao Wang2☯, Jing-wen Zhang2, Yan-yan Wang2, Wei-min Li2, Yu-fa Peng3, Qian-hua Yuan1*, Xin-wu Pei2*
1College of Agriculture, Hainan Key Laboratory for Sustainable Utilization of Tropical Bioresources, Hainan University, Haikou, 570228, China,2Institute of Biotechnology, Chinese Academy of Agricultural Sciences, Beijing, 100081, China,3Institute of Plant Protection, Chinese Academy of Agricultural Sciences, Beijing, 100094, China
☯These authors contributed equally to this work.
*[email protected](X-wP);[email protected](Q-hY)
Abstract
Background
The perennialO.rufipogon(common wild rice), which is considered to be the ancestor of Asian cultivated rice species, contains many useful genetic resources, including drought resistance genes. However, few studies have identified the drought resistance and tissue-specific genes in common wild rice.
Results
In this study, transcriptome sequencing libraries were constructed, including drought-treated roots (DR) and control leaves (CL) and roots (CR). Using Illumina sequencing tech-nology, we generated 16.75 million bases of high-quality sequence data for common wild rice and conducted de novo assembly and annotation of genes without prior genome infor-mation. These reads were assembled into 119,332 unigenes with an average length of 715 bp. A total of 88,813 distinct sequences (74.42% of unigenes) significantly matched known genes in the NCBI NT database. Differentially expressed gene (DEG) analysis showed that 3617 genes were up-regulated and 4171 genes were down-regulated in the CR library com-pared with the CL library. Among the DEGs, 535 genes were expressed in roots but not in shoots. A similar comparison between the DR and CR libraries showed that 1393 genes were up-regulated and 315 genes were down-regulated in the DR library compared with the CR library. Finally, 37 genes that were specifically expressed in roots were screened after comparing the DEGs identified in the above-described analyses.
a11111
OPEN ACCESS
Citation:Tian X-j, Long Y, Wang J, Zhang J-w, Wang Y-y, Li W-m, et al. (2015)De novoTranscriptome Assembly of Common Wild Rice (Oryza rufipogon
Griff.) and Discovery of Drought-Response Genes in Root Tissue Based on Transcriptomic Data. PLoS ONE 10(7): e0131455. doi:10.1371/journal. pone.0131455
Editor:Debasis Chakrabarty, CSIR-National Botanical Research Institute, INDIA
Received:January 21, 2015
Accepted:June 2, 2015
Published:July 2, 2015
Copyright:© 2015 Tian et al. This is an open access article distributed under the terms of theCreative Commons Attribution License, which permits unrestricted use, distribution, and reproduction in any medium, provided the original author and source are credited.
Data Availability Statement:All relevant data are within the paper and its Supporting Information files.
Funding:This work was supported by grants from the National Special Program of Transgenic Research (Nos. 2014ZX08011-001).
Competing Interests:The authors have declared
Conclusion
This study provides a transcriptome sequence resource for common wild rice plants and establishes a digital gene expression profile of wild rice plants under drought conditions using the assembled transcriptome data as a reference. Several tissue-specific and drought-stress-related candidate genes were identified, representing a fully characterized transcriptome and providing a valuable resource for genetic and genomic studies in plants.
Introduction
Drought is one of the most common abiotic stresses that negatively influence plant growth, biomass production and crop yield [1]. Plants will activate a series of complicated regulatory mechanisms to deal with the unfavorable environment when experiencing drought [2–5]. For example, the regulation of abscisic acid (ABA) and other related transcription factors will work at the molecular and physiological and biochemical level [6–7]. On the other hand, at tissue and cellular level, plants respond to drought environment onset with morphological and cellu-lar changes such as plasma membrane transform, growth retardation, stomatal closure, leaf wax increase, and the accumulation of osmoprotectants [8–12]. During the phenotypic and cell changes process, many genes that regulate metabolism at the physiological and biochemical level are highly expressed to enhance drought resistance [13–15]. Among these genes, several tissue-specific genes can induce morphological changes to address drought conditions. For example,DRO1, a deep-root gene, can induce rice roots to stretch into the deeper, wetter levels of soil to counteract the arid environment at the surface [16]. Overexpression ofOsNAC5
enlarges root diameter in rice plants, leading to enhanced drought tolerance [17], andOsGL1-6
is involved in the accumulation of leaf cuticular wax and directly impacts drought resistance in rice [18]. With progress in molecular biology techniques, increasing numbers of genes related to drought have been isolated and identified.
As an important constituent part for plant, root systems have important biological roles in plants’life cycle. It could anchor the plant, absorb water, inorganic salts and other nutrients, transferring hormones [19]. In recent years, more and more researchers focus on root system researches, including the growth and development of plant roots under drought stress [20]. When plants meet drought stress, responses occur in two different levels. At the morphological level, deep roots can absorb more water and nutrients; and at the molecular level, drought response genes in roots start to express as roots are among the primary sites for stress signal perception [21]. In previous reports, the responses of rice cultivar roots to drought, potassium stress, essential nutrients, structure, heavy metals and plant development have been analyzed on the transcriptomic level [22–26]. In addition, the second generation sequencing technology has been applied to identify stress-inducible transcripts in rice [27,28].
As the ancestor of cultivated rice, common wild rice which undergo a long history of artifi-cial selection has a wide variety of excellent valuable mutated genes which have great potential value for rice breeding [29]. These plants grow in shallow water, small lakes and slow-flowing streams of eutrophication, and they possess the characters of disease and insect resistance and stress tolerance (resisting drought, high salt and low temperature), especially the developed ratoon systems.
[30–32]. In addition, thePROG1gene, which is involved in rice domestication [33], and the
SH4andqSH1genes, which control rice seed shattering [34], have been isolated. Certain genetic resources involved in drought resistance in common wild rice have been analyzed, including 12 drought-tolerance-related QTLs that were identified using introgression lines with the common wild rice Dongxiang accession as a donor [35]. However, the roots and tis-sue-specific gene expression in common wild rice has not been reported.
In the present study, common wild rice from the Gaozhou area of Guangdong province in China was used as material for studying root and drought resistance genes. The transcriptomes from different tissues of control and drought-treated common wild rice were sequenced using the Illumina paired-end sequencing technology, the sequencing data were assembled and annotated, and differentially expressed genes (DEGs) were identified. The research is essential and helpful to understand the transcript of the mechanism of different organizations drought in common wild rice, and it will be very useful for gene annotation and discovery and for geno-mic and transcriptogeno-mic assembly in common wild rice.
Materials and Methods
Plant Growth Conditions and Drought Stress Treatment
Common wild rice seeds were collected from Guangzhou Province in China. It was approved by supervision department of Guangdong wild rice protection. The seeds were sowed in Petri dishes at 35°C and then the plants were transferred to pots with water-culture after germina-tion in a growth chamber. The seedlings were grown in four pots (30seedlings/pot) represent-ing two treatments. The composition of the nutrient solution was as described by the
International Rice Research Institute [36]. The plants were cultured under the following condi-tions: 50–70% relative humidity under short-day (8 h light/16 h dark) conditions at 30°C in the light and at 25°C at night.
After the seedlings grew for three weeks, one treatment was performed on the seedling sets using 15% PEG-6000 nutrient solution as the drought treatment for 24 h with the symptoms of wilting, and the second set of seedlings was used as an untreated control. Then, the root and shoot tissues of both control and treated seedlings were harvested and stored at−80°C in prep-aration for further assays.
RNA Extraction and Transcriptome Sequencing
PCR amplification. After cluster generation, the sequencing libraries were sequenced by Illu-mina HiSeq 2000 platform.
Data Filtering and De Novo Assembly
Raw sequence data generated from Illumina HiSeq 2000 platform were treated with following steps. First, remove adapters that were added for reverse transcription and sequencing, then sequences containing too many unknown bases (>10%) and low-quality bases (>50% of the
bases with a quality score5) were removed. After obtaining clean data for each of the six tran-scriptome libraries, the clean data were then mixed and assembly was done by using the Trinity software. The parameters were with min_kmer cov set to 2 by default and all other parameters set to the default settings [37]. All of the raw data was submitted to the database with the code Bioproject: SUX1023710 and BioSample: SRS933410.
Unigene Annotation and Functional Classification
For unigene functional annotation, all the assembled unique gene sequences were searched against the NR (http://www.ncbi.nlm.nih.gov/), PFAM (HMMER 3.0 package, hmmscan) Swiss-Prot (http://www.expasy.ch/sprot/), KEGG (http://www.genome.jp/kegg/) and Eukary-otic orthologous groups (KOG) (http://www.ncbi.nlm.nih.gov/cog/) databases using BLASTx algorithms and against the NT database using the BLASTn algorithms, with a threshold of E<1.0E-5. KOG contradistinction algorithms with a threshold of E<1.0E-3 were used to
deter-mine the top 10 unigene alignment results. For the NR and PFAM annotations, the Blast2GO program was used to conduct GO annotation of unigenes, and the WEGO software was used to construct GO functional classification [38,39].
DGE Library Preparation, Sequencing and Mapping Analysis
Total RNAs from six samples, including shoot (CL) and root (CR) tissues of control plants and root tissue of the treated group (DR), two replicates each, were used for DGE library sequenc-ing. For each sample, three micrograms of RNA was used for the DGE library construction. The process of the DGE sequencing library construction was same as those of the transcrip-tome sequencing libraries.
After getting the raw sequence data and performing the data-processing steps, the clean reads were then mapped to the assembly transcriptome reference sequences using the RSEM software [40]. Mismatches of no more than 2 bases were allowed in the alignment, and read counts for each gene were obtained from the mapping results.
Identification of Differentially Expressed Unigenes
For calculating the gene expression level, the FPKM method was used [41], then the DEGs were screened by comparing the gene expression levels. The DESeq R package (1.10.1) [42] was used to analyze the DEGs between the two conditions. In order to control the false discov-ery rate, the resulting P values were adjusted using the Benjamini and Hochberg’s approach. In this study, genes with an adjusted P-value<0.05 for CR vs CL with 1.5 times changes of gene
expression and an adjusted P-value<0.1 for DR vs CR with 1.5 times changes of gene
expres-sion were used for identifying the DEGs.
Quantitative Real-Time PCR Analysis
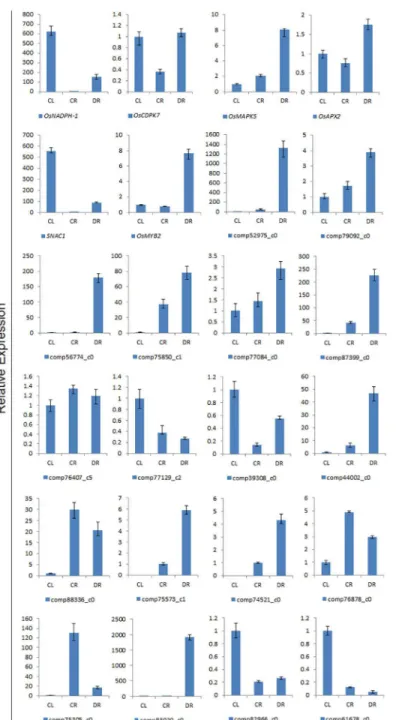
was implemented using the SYBR premix Ex Taq kit (TaKaRa, Dalian, China) on an ABI 7500 Real-Time System (Applied Biosystems). The relative expression value was calculated using the 2-ΔΔCtmethod [43], with actin (Os03g0718100) as an internal control. The six known drought response genes, includingOsMYB2,SNAC1,OsNADPH-1,OsMAPK5 and OsAPX2were also choosed for qRT-PCR analysis. In addition to these 18 unigenes, another four drought-induced unigenes were selected for expression analysis after different times of drought treatment. The gene-specific primers used in the qRT-PCR analysis are listed inS1 Table. The RNA pools used in the qRT-PCR analyses were extracted from three independent samples that were different from those used for RNA-seq. All reactions were performed using one biological sample and three technical replicates.
Development and Detection of EST-SSR Markers
Besides screening DEG information, microsatellites distribution was also detected in the assemblied transcriptomes. The MISA software (http://pgrc.ipk-gatersleben.de/misa/misa. html) was used to identify microsatellites. EST-SSRs were considered to contain motifs consist-ing of one to six nucleotides.
Primers for each SSR were designed using Primer3 software (http://primer3.ut.ee).
Results
Illumina Paired-End Sequencing and De Novo Assembly
Six cDNA libraries were generated from the seedling stage (shoot and root of control, root-treated) of common wild rice using Illumina deep sequencing. After removing adapters and fil-tering the low-quality sequences, 6.42 million, 5.74 million, and 4.59 million clean 100-bp reads were generated for the control shoot (CL1, CL2), control root (CR1, CR2), and drought-treated root (DR1, DR2) libraries, respectively (Table 1). All of the high-quality reads from these six libraries were mixed to do transcriptome assembly by using the Trinity software [37]. Based on the overlapping information provided by the high-quality assembly, 201,352 tran-scripts, with a mean length of 1189 bp and an N50 of 2159 bp, were generated. After extracting the longest transcript for each gene to serve as the unigene, 119,332 unigenes were obtained. The average length was 715 bp, and approximately 38.88% of the unigenes were at least 500 bp long (Table 2,S1 Fig).
Functional Annotation and Classification of the Unigenes
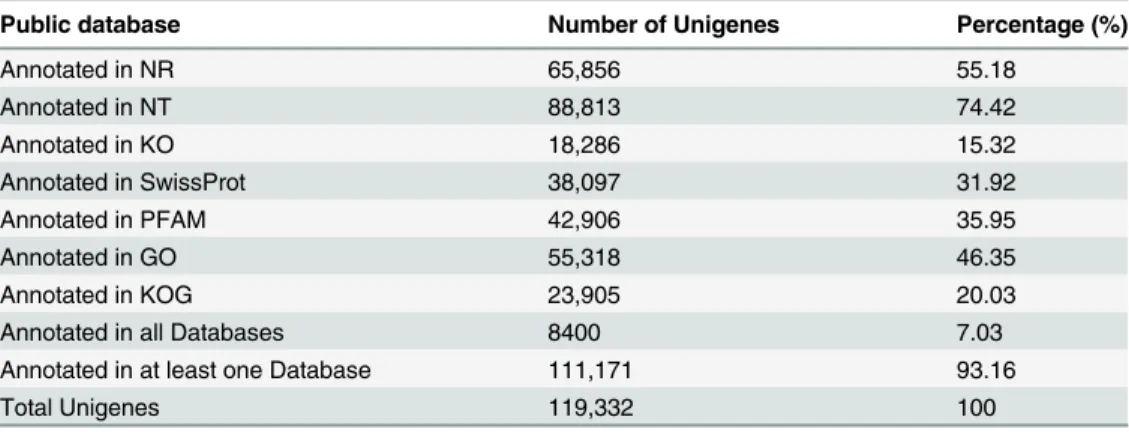
After getting the sequence of assembled unigenes, the sequences were searched against the SwissProt protein and NCBI non-redundant (NR) databases using the BLAST 2.2.28+ program (with E-value threshold of 1E-5). Of the 119,332 unique sequences, 111,171 unigenes (93.16%) had at least one significant match to an existing gene model. A total of 88,813 distinct
Table 1. Summary of data output quality of the various libraries.
Library Raw Reads Clean reads Error(%) Q20(%) GC(%)
CL1 36,316,581 33,680,504 0.05 95.00 53.45
CL2 32,904,668 30,527,534 0.05 95.01 53.84
CR1 33,161,644 30,846,212 0.04 95.34 51.95
CR2 28,544,583 26,630,389 0.04 95.31 51.90
DR1 25,417,458 23,716,321 0.04 95.37 52.16
DR2 26,938,151 25,164,179 0.04 95.38 52.20
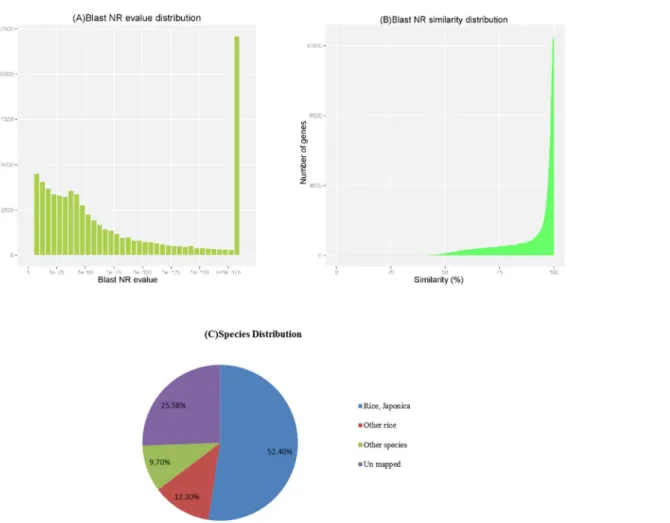
sequences (74.42% of the unigenes) significantly matched known genes in the NT database (Table 3). Of the matched unigenes, approximately 18.87% (12424/65856) matched the NR database with an E value smaller than 1E-175 (Fig 1A), and approximately 71.71% (47226/ 65856) shared more than 90% similarity with an established sequence (Fig 1B). The majority of sequences (64.76%) were homologous to genes ofOryza sativa, and of those, 52.4% of the uni-genes were best matched to sequences fromOryza sativaJaponica, followed by 12.3% from otherOryza sativaspecies and 9.7% from other species (Fig 1C). In the absence of matching to the NT database of 25.58% genes in 2572 genes have higher expression level, and 8161 genes were not matched to any database(S2 Table).
Functional Classification by GO and KOG
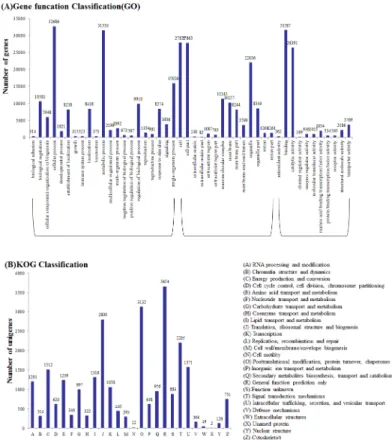
Gene Ontology (GO) analysis was performed based on the NR annotation. Among the 65,856 annotated unigenes, 55,318 sequences were assigned to 56 GO functional groups terms (Table 2,S3 Table). Among the three main categories the biological process category was the most (147,154), following with the cellular components category (124,519) and molecular function category (69,458) (Fig 2A). Within the biological processes category, related to meta-bolic processes (21.44%) and cellular processes (22.21%) were the most enriched. Meanwhile, genes encoding binding proteins (45.42%) and proteins related to catalytic activity (37.99%) were enriched in the molecular function category. In the cellular components category, cell (22.38%), cell part (22.38%) and organelle (17.70%) were the largest proportion represented GO terms.
For KOG classifications, 23,905 sequences were assigned among the 65,856 NR annotated unigenes (Table 2). These sequences were assigned to 25 KOG categories, the cluster for gen-eral function prediction was the largest group (3654, 15.29%), others followed by posttransla-tional modification (3132, 13.10%), translation (2800, 11.71%), signal transduction (2205, 9.22%), intracellular trafficking and secretion (1571, 6.57%), and energy production and con-version (1512, 6.33%) (Fig 2B).
Table 2. Summary of the common wild rice transcriptome.
Category Number Total number Mean length (bp) N50 (bp) Total nucleotides
200-500bp 500-1kb 1k-2kb >2kb
Transcripts 84,613 39,012 38,705 39,022 201,352 1,189 2,159 239,341,036
Unigenes 72,936 24,321 13,563 8,512 119,332 715 1,147 85,352,510
doi:10.1371/journal.pone.0131455.t002
Table 3. Summary of functional annotation of the assembled unigenes.
Public database Number of Unigenes Percentage (%)
Annotated in NR 65,856 55.18
Annotated in NT 88,813 74.42
Annotated in KO 18,286 15.32
Annotated in SwissProt 38,097 31.92
Annotated in PFAM 42,906 35.95
Annotated in GO 55,318 46.35
Annotated in KOG 23,905 20.03
Annotated in all Databases 8400 7.03
Annotated in at least one Database 111,171 93.16
Total Unigenes 119,332 100
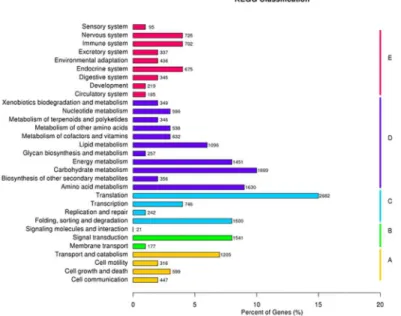
Functional Classification by KEGG Pathway
Kyoto Encyclopedia of Genes and Genomes (KEGG) analysis with a cutoff of E<1E-5 was
used to further understanding of the transcriptome data. Of the 119,332 unigenes, 18,286 (13.96%) with significant matches from the database were assigned to 5 main categories, including 254 KEGG pathways (Table 2,S4 Table). As shown inFig 3, among the 5 main cate-gories, metabolism was the biggest category (9120, 49.87%), followed by genetic information (5170, 28.27%), organismal systems (3720, 20.34%), cellular processes (2567, 14.04%) and envi-ronmental information processing (1739, 9.51%) (Fig 3).
Differentially Expressed Gene (DEG) Analysis among the Three
Libraries
To find the drought-induced genes in root, DEG analysis of the three transcriptome libraries was performed. First, comparing the CR and CL libraries showed that 3617 genes were up-reg-ulated, and 4171 genes were down-regulated (Fig 4A,S5 Table). Among all DEGs, 535 were expressed in roots but not expressed in shoots (S5 Table).
According to the analysis of the differentially expressed genes between the roots (CR) and shoots (CL) shown inFig 4A, Gene Ontology (GO) analysis on DEGs was performed based on Fig 1. Characteristics of the BLAST matches of the transcriptome unigenes.(A) E-value and (B) Similarity distribution of the top BLAST hits for each unigene in the NR database, with a cut-off E-value of 1.0E-5. (C) Species distribution of the BLAST hits for each unigene in the NT database.
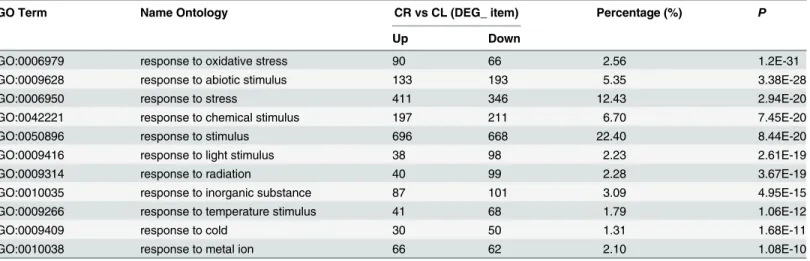
the NR annotation. Among the 7788 DEGs, 4262 were assigned to 60 GO terms (S2A Fig), and of these genes, 2062 of the 3617 up-regulated genes and 2200 of the 4171 down-regulated genes were assigned to at least one of the GO terms(molecular function, cellular component, or bio-logical process). Some GO terms, such as carbohydrate metabolic process, response to oxida-tive stress were enriched in both sets of transcripts from the two tissues. The results showed that there must be some same biological process for root activities and leaf photosynthesis. However, some significant differences were found between the two sets of enriched GO terms. In particular, GO terms related to photosynthesis and organelles were highly enriched in DEGs for roots and shoots, respectively, which also showed the expression of specific genes in differ-ent tissues. For the biological process category, 11 GO terms were found to be involved in responses to various stimuli (Table 4); response to stimulus was the most common (1364, 22.40%), followed by response to stress (757, 12.43%), response to chemical stimulus (408, 6.70%), response to abiotic stimulus (326, 5.35%), response to oxidative stress (156, 2.56%) and response to temperature stimulus (109, 1.79%) (Table 4).
To demonstrate the degree of enrichment of the response-related genes, the 11 GO terms were analyzed by the TopGO analysis. This analysis found that degree of response to abiotic stimuli was enriched the most, followed by the response to oxidative stress (S2B Fig). Among the up-regulated genes in the CR library, the strongest up-regulation occurred for the responses to stress, response to abiotic and response to oxidative stress (S2 Fig). These results showed that gene expression responses were different in different tissues; that is, genes in common Fig 2. Functional classification of the assembled unigenes.(A) Comparison of Gene Ontology (GO) classifications of common wild rice. Unigene numbers assigned to the same GO terms are indicated above the bars; the x-axis indicates the subcategories, and the y-axis indicates the number of genes in a category. (B) Histogram of the Eukaryotic Orthologous Groups (KOG) classification.
wild rice show specificity of expression. Meanwhile, the DR and CR libraries were also com-pared, which showed the up-regulation of 1393 genes and the down-regulation of 315 genes in the DR library compared with the CR library (Fig 4B,S6 Table).
Transcription factors (TFs) is a group of protein molecule that specifically bind to the 5'-end upstream sequence of targeted gene to ensure genes’expression under specific temporal and spatial condition. On the other hand, transcription factors are associated with the Fig 3. Pathway assignment based on Kyoto Encyclopedia of Genes and Genomes (KEGG) analysis. Classification based on the (A) cellular processes categories, (B) environmental information processing categories, (C) genetic information processing categories, (D) metabolism categories, (E) the organismal systems categories.
doi:10.1371/journal.pone.0131455.g003
Fig 4. Three digital gene expression (DGE) libraries of the common wild rice.(A) DEGs obtained by comparing the CR and CL libraries. (B) DEGs obtained by comparing the CR and DR libraries. (C) DEGs identified from the up-regulated genes in A compared with DEGs in B.
regulation of plant drought stress responses. For example, DREB transcription factor is a dehy-dration-responsive elements binding protein which has important regulatory roles during drought, salt and cold stress responses in plants.
TFs analysis was performed based on the Swiss-Prot annotation. The present study found that the differentially expressed TF genes of belonged to a diverse range of TF families (Table 5). Numerous transcription factors showed differential expression between the CR and CL libraries, including 40MYBgenes, 31AP2/ERFgenes, 4HSFgenes, 5NACgenes, and 21
WRKYgenes, etc. The comparison between the DR and CR libraries showed that 4MYBgenes, 19Znfgenes and 2DREBgene were up-regulated in roots after drought stress.
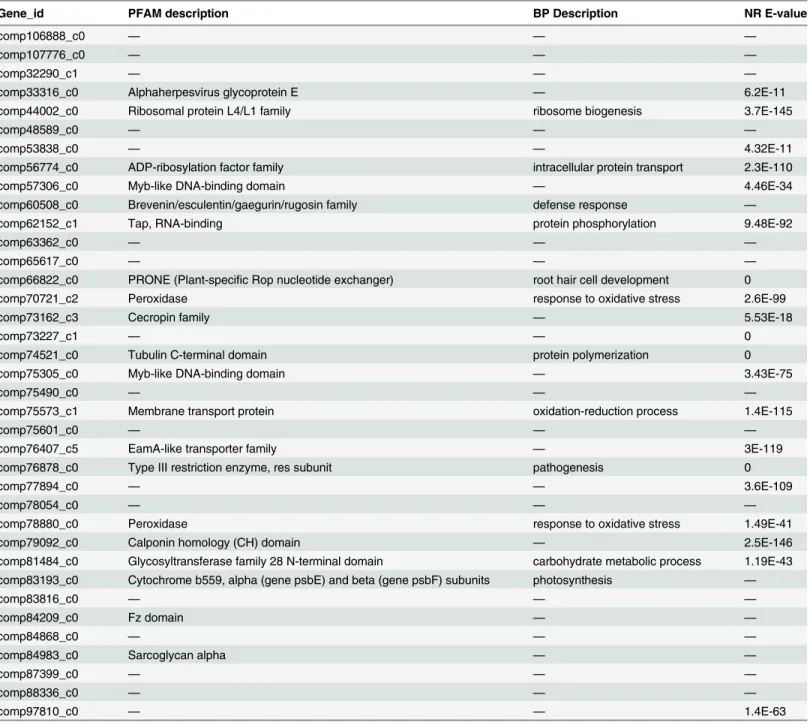
Finally, the 3617 genes showing higher expression in the CR than CL library were compared with the 1708 genes showing differential expression between the DR and CR libraries. Thirty-seven genes were identified in both comparisons (Fig 4C,Table 6). That mean these genes were drought-induced and expressed specifically in root tissue. Of these 37 genes, 17 could not be matched to any genes in the database, that mean maybe these 17 genes were might be specific Table 4. GO terms for the response to abiotic stimuli related to differentially expressed genes.
GO Term Name Ontology CR vs CL (DEG_ item) Percentage (%) P
Up Down
GO:0006979 response to oxidative stress 90 66 2.56 1.2E-31
GO:0009628 response to abiotic stimulus 133 193 5.35 3.38E-28
GO:0006950 response to stress 411 346 12.43 2.94E-20
GO:0042221 response to chemical stimulus 197 211 6.70 7.45E-20
GO:0050896 response to stimulus 696 668 22.40 8.44E-20
GO:0009416 response to light stimulus 38 98 2.23 2.61E-19
GO:0009314 response to radiation 40 99 2.28 3.67E-19
GO:0010035 response to inorganic substance 87 101 3.09 4.95E-15
GO:0009266 response to temperature stimulus 41 68 1.79 1.06E-12
GO:0009409 response to cold 30 50 1.31 1.68E-11
GO:0010038 response to metal ion 66 62 2.10 1.08E-10
doi:10.1371/journal.pone.0131455.t004
Table 5. Distribution of differentially expressed transcription factor families.
TF family DR vs CR CR vs CL
Up-regulated Down-regulated Up-regulated Down-regulated
MYB 4 3 19 21
AP2/ERF 1 0 17 14
Znf (WRKY) 0 0 15 6
Znf (RING-finger) 2 2 20 16
Znf 19 5 104 103
NAC 0 2 4 1
bZIP 7 1 21 15
HSF 0 0 2 2
Aux/IAA 1 0 3 3
CBF 1 0 18 1
DREB 2 0 1 3
Each transcription factor contains known DNA-binding domains defined by the Pfam database.
to the response to drought stress in common wild rice. Besides different types of transcriptional factors, some other types of genes have been discovered in this study, such as peroxidases. In this study 76 peroxidases related genes were found (S5 Table). Among the 76 genes, 48 genes were up-regulated in roots and 28 genes were up-regulated in leaves, meanwhile, 12 and 2 genes were found not expressing in leaves and roots, respectively. And 6 peroxidases genes were found in the DEGs between DR and CR (S6 Table).
Table 6. The thirty-seven differentially expressed genes identified from the three libraries.
Gene_id PFAM description BP Description NR E-value
comp106888_c0 — — —
comp107776_c0 — — —
comp32290_c1 — — —
comp33316_c0 Alphaherpesvirus glycoprotein E — 6.2E-11
comp44002_c0 Ribosomal protein L4/L1 family ribosome biogenesis 3.7E-145
comp48589_c0 — — —
comp53838_c0 — — 4.32E-11
comp56774_c0 ADP-ribosylation factor family intracellular protein transport 2.3E-110
comp57306_c0 Myb-like DNA-binding domain — 4.46E-34
comp60508_c0 Brevenin/esculentin/gaegurin/rugosin family defense response —
comp62152_c1 Tap, RNA-binding protein phosphorylation 9.48E-92
comp63362_c0 — — —
comp65617_c0 — — —
comp66822_c0 PRONE (Plant-specific Rop nucleotide exchanger) root hair cell development 0
comp70721_c2 Peroxidase response to oxidative stress 2.6E-99
comp73162_c3 Cecropin family — 5.53E-18
comp73227_c1 — — 0
comp74521_c0 Tubulin C-terminal domain protein polymerization 0
comp75305_c0 Myb-like DNA-binding domain — 3.43E-75
comp75490_c0 — — —
comp75573_c1 Membrane transport protein oxidation-reduction process 1.4E-115
comp75601_c0 — — —
comp76407_c5 EamA-like transporter family — 3E-119
comp76878_c0 Type III restriction enzyme, res subunit pathogenesis 0
comp77894_c0 — — 3.6E-109
comp78054_c0 — — —
comp78880_c0 Peroxidase response to oxidative stress 1.49E-41
comp79092_c0 Calponin homology (CH) domain — 2.5E-146
comp81484_c0 Glycosyltransferase family 28 N-terminal domain carbohydrate metabolic process 1.19E-43 comp83193_c0 Cytochrome b559, alpha (gene psbE) and beta (gene psbF) subunits photosynthesis —
comp83816_c0 — — —
comp84209_c0 Fz domain — —
comp84868_c0 — — —
comp84983_c0 Sarcoglycan alpha — —
comp87399_c0 — — —
comp88336_c0 — — —
comp97810_c0 — — 1.4E-63
—, no hits in the specific database
Verification of the Expression of Selected Differentially Regulated Genes
by Quantitative Real-Time PCR
To confirm the gene expression data, 18 up or down-regulated unigenes were randomly chosen from the three libraries for qRT-PCR analysis. Among the 18 genes, 10 genes belonged to the 37 selected DEGs. For most of the 18 genes, their expression patterns in the real-time PCR analysis were similar to those predicted except comp77129_c2 and comp39308_c0 by the tran-scriptome sequencing data, for example the comp75573_c1 and comp74521_c0 genes were not expressed in shoots (Fig 5). The expression level of six known drought response genes signifi-cantly increased after drought stress. These results were consistent with that of previous researches.
Next, we tested the expression patterns of four of the 37 differentially expression genes to testing the expression pattern in response to drought stress (15% PEG-6000) in root tissues. The transcription sequencing results showed that two of these four genes, comp83816_c0 and comp60508_c0, gene were up regulated by drought, and the other two genes, comp78054_c0 and comp88336_c0, were down-regulated by drought. In the qRT-PCR experiment, the tran-scription levels of the comp83816_c0 and comp60508_c0 genes gradually increased in response to drought stress at 1 to 2 days and then decreased at 3 days. The transcript level of the
comp88336_c0 gene gradually decreased in response to drought stress on days 1 to 3, and the level of comp88336_c0 quickly decreased in response to drought stress (Fig 6).
Microsatellite Distribution Analysis and EST-SSR Marker Development
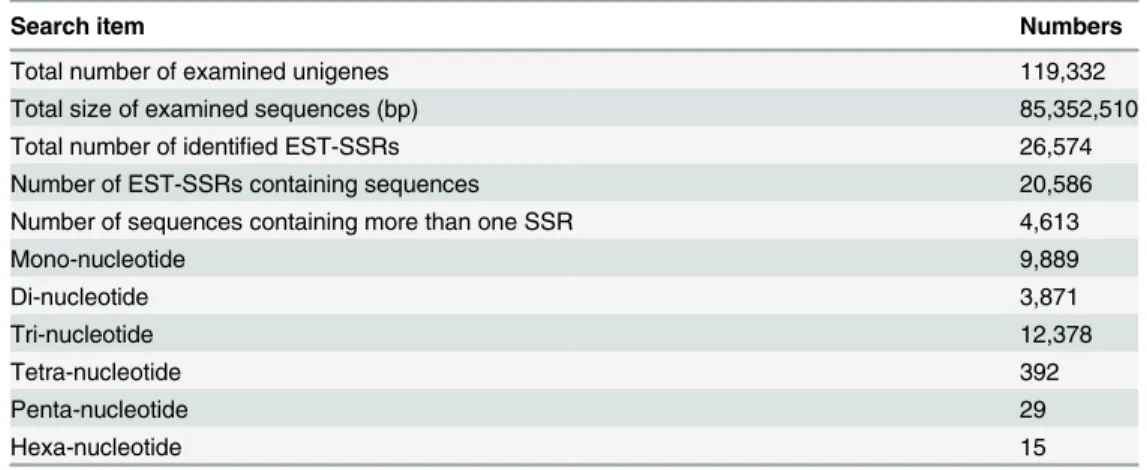
In order to analyze the microsatellites distribution in the common wild rice genome, the 119,332 unigenes generated in this study were used to mine potential microsatellites that were defined as mono- to hexanucleotide motifs with a minimum of three repetitions. A total of 26,574 potential simple sequence repeats (SSRs) were identified in 20,586 unigenes. Of these 20,586 unigenes, 15,973 and 4613 unigenes contained one or more than one SSR, respectively (Table 7). The number of potential EST-SSRs per unigene varied from 1 to 9, with an average of 1.29. For the motif types, the Tri-nucleotide type was the most one. Using the SSR-contain-ing sequences, 12,324 SSR sites were designed EST-SSR primers with the Primer Premier 3.0 software. Information about these EST-SSR primers is shown inS7 Table. In the 12,324 SSR sites, about 2220 unigenes which had SSR sites were differentially express between CR and CL, while only 145 DEGs found between DR and CR.
Discussion
As one of the important component in wild rice, common wild rice is a very useful resource which has many useful genes could be used for cultivated rice improvement. Many genes asso-ciated with important agronomic traits, such as domestication, disease resistance, and insect resistance, have been identified [30,33,34,44–46]. In previous studies researchers used com-mon wild rice and cultivated rice to do hybridization and got many inbred lines to increase the drought resistance [35]. While until now there is little information about the drought-related genes resources in common wild rice. In the current study, we used next-generation sequencing technologies to analyze the transcriptomic changes that occur in common wild rice during drought stress to identify the genes that are induced in roots under this condition. As expected, we identified many known genes, including transcription factors, and some possible new genes to be involved in the drought-response pathway in common wild rice.
than the number of genes in found in cultivated Japonica rice. One possible reason for this dif-ference in gene number is the high heterozygosity of common wild rice [47,48]. The N50 length of the unigenes was 1147 bp, and the average length was 715 bp; these results were comparable to other recently published plant transcriptomic analyses, such as that forReaumuria soongor-ica(N50 = 1109 bp, average length = 677 bp) [49]. More than half of the unigenes identified in this study (65856, 55.18%) were successfully assigned to annotated genes by BLAST against Fig 5. Confirmation of the transcriptomic profiles of selected genes by qRT-PCR.The x-axis shows the three samples; the expression level of CL was used as a control. The y-axis shows the relative quantitative expression level of each unigene.
public databases. Among the unigenes, a BLAST against the nt database showed that 62,572 (52.40%) had significant homology to functional genes encoding specific proteins inOryza sativaJaponica. As expected, most of the genes (64.7%) were matched to cultivated rice, indi-cating that the genome of cultivated rice is highly similar to that of common wild rice. How-ever, other than the matched genes, no genes could be matched to any database, indicating that common wild rice contains some new and nonconserved genes. After unigene assembly, the DEGs were screened using comparative analyses of the CL, CR and DR libraries. When com-paring the CL and CR libraries, 366 DEGs were found to be only expressed in leaves, and 535 were only expressed in roots, indicating that these genes were tissue-specific. This result was consistent with results in previous studies. Some tissue specific gene, such as root-specific gene
OsEXPA8and cell-wall invertase genes of rice at flowering have been identified [50,51]. Fur-thermore, the gene expression patterns of different organs of rice shoots under the drought and high-salinity stress have also been revealed [52]. Many of the tissue-specific genes identified in this study were associated with abiotic stresses, including water, cold, and heat stress (S8
Fig 6. Expression characters of four selected unigenes in the roots of PEG-treated plants at 0 h, 24 h, 48 h and 72 h.The relative expression value was calculated using the 2-ΔΔCtmethod and 0 h as a control
sample.
doi:10.1371/journal.pone.0131455.g006
Table 7. Summary of the EST-SSRs that were identified in the transcriptome data.
Search item Numbers
Total number of examined unigenes 119,332
Total size of examined sequences (bp) 85,352,510
Total number of identified EST-SSRs 26,574
Number of EST-SSRs containing sequences 20,586
Number of sequences containing more than one SSR 4,613
Mono-nucleotide 9,889
Di-nucleotide 3,871
Tri-nucleotide 12,378
Tetra-nucleotide 392
Penta-nucleotide 29
Hexa-nucleotide 15
Table), suggesting that common wild rice tissue has a unique strategy for managing environ-mental stress.
Previous researches have shown that gene expression altering when plants exposed to drought stress. To discover more drought-related genes that are specifically expressed in roots, we enlarged the threshold value to P-value<0.1. After performing DEG analysis, 37 possible
drought-related and tissue-specific genes were identified, including some known transcrip-tional factors, such as the MYB genes [53].
After analyzing the DEG information, we selected six drought related genes, including one perpxidases gene to do real-time PCR to check the expression character during the drought treatment (Fig 6). The differentially expressed genes between CR and CL showed that this type of gene has the character of tissue specific in plants, and the differentially expressed genes between DR and CR showed that the increasing expression level of perpxidases genes could enhance the peroxisome level in cells to protect the cells in plants.
Among the 37 DEGs regulated by drought stress in common wild rice, over 50% had no homologs in the NCBI database, indicating that some of these genes may represent new drought-related transcripts that have not been reported in plants and that these genes may be useful resources for the genetic improvement of crops.
Roots and leaves are important tissues which could percept the drought stress information. In this study, we didn’t analyze the sequence data from drought treated leaves as we want to extract the important information from roots, and the gene information from drought leaves will be further analyzed in the future.
Supporting Information
S1 Fig. Transcripts and unigenes of assembly length distributions the proportion.The lengths of the interval assembly transcripts/unigenes are plotted on the horizontal axis, and the lengths of each assembled transcript are plotted on the vertical axis.
(TIF)
S2 Fig. Gene Ontology enrichment and topGO analysis of the differentially expressed uni-genes (CR vs CL).(A) Gene Ontology (GO) categorization of the DEGs. (B) DAG graph of the topGO analysis for the DEGs. (C) DAG graph of the topGO analysis for the DEGs that are up-regulated by drought. Each cycle or square represents one GO term. The more dark colour showed that the gene enrichment density was higher.
(TIF)
S1 Table. Summary of Gene-specific primers used in the qPCR analysis are listed and expression levels in the library.
(XLSX)
S2 Table. Blast file for gene annotation. (XLS)
S3 Table. Summary of GO classification of assembled unigenes. (XLSX)
S4 Table. Summary of KEGG classification of assembled unigenes. (XLSX)
S6 Table. Summary of annotation of differentially expressed genes(DRvsCR). (XLSX)
S7 Table. EST-SSR primers and the contained unigene information. (XLSX)
S8 Table. Summary of Response to stress related genes of differentially expressed. (XLSX)
Author Contributions
Conceived and designed the experiments: QHY XWP YFP. Performed the experiments: XJT YL. Analyzed the data: JW XJT LY WML. Contributed reagents/materials/analysis tools: JWZ YYW. Wrote the paper: XJT YL.
References
1. Minh-Thu PT, Hwang DJ, Jeon JS, Nahm BH, Kim YK (2013) Transcriptome analysis of leaf and root of rice seedling to acute dehydration. Rice 6: 38. doi:10.1186/1939-8433-6-38PMID:24341907 2. Friedel S, Usadel B, von Wiren N, Sreenivasulu N (2012) Reverse engineering: a key component of
systems biology to unravel global abiotic stress cross-talk. Front Plant Sci 3: 294. doi:10.3389/fpls. 2012.00294PMID:23293646
3. Shinozaki K, Yamaguchi-Shinozaki K (2007) Gene networks involved in drought stress response and tolerance. J Exp Bot 58: 221–227. PMID:17075077
4. Hadiarto T, Tran LS (2011) Progress studies of drought-responsive genes in rice. Plant Cell Rep 30: 297–310. doi:10.1007/s00299-010-0956-zPMID:21132431
5. Cramer GR, Urano K, Delrot S, Pezzotti M, Shinozaki K (2011) Effects of abiotic stress on plants: a sys-tems biology perspective. BMC Plant Biol 11: 163. doi:10.1186/1471-2229-11-163PMID:22094046 6. Santos AP, Serra T, Figueiredo DD, Barros P, Lourenco T, Chander S, et al. (2011) Transcription
regu-lation of abiotic stress responses in rice: a combined action of transcription factors and epigenetic mechanisms. OMICS 15: 839–857. doi:10.1089/omi.2011.0095PMID:22136664
7. Busk PK, Pages M (1998) Regulation of abscisic acid-induced transcription. Plant Mol Biol 37: 425–
435. PMID:9617810
8. Guo L, Wang ZY, Lin H, Cui WE, Chen J, Liu M, et al. (2006) Expression and functional analysis of the rice plasma-membrane intrinsic protein gene family. Cell Res 16: 277–286. PMID:16541126
9. Nakashima K, Tran LS, Van Nguyen D, Fujita M, Maruyama K, Todaka D, et al. (2007) Functional anal-ysis of a NAC-type transcription factor OsNAC6 involved in abiotic and biotic stress-responsive gene expression in rice. Plant J 51: 617–630. PMID:17587305
10. Lovisolo C, Perrone I, Hartung W, Schubert A (2008) An abscisic acid-related reduced transpiration promotes gradual embolism repair when grapevines are rehydrated after drought. New Phytol 180: 642–651. doi:10.1111/j.1469-8137.2008.02592.xPMID:18700860
11. Islam MA, Du H, Ning J, Ye H, Xiong L (2009) Characterization of Glossy1-homologous genes in rice involved in leaf wax accumulation and drought resistance. Plant Mol Biol 70: 443–456. doi:10.1007/
s11103-009-9483-0PMID:19322663
12. Yamada M, Morishita H, Urano K, Shiozaki N, Yamaguchi-Shinozaki K, Shinozaki K, et al. (2005) Effects of free proline accumulation in petunias under drought stress. J Exp Bot 56: 1975–1981. PMID:
15928013
13. Kim H, Lee K, Hwang H, Bhatnagar N, Kim DY, Yoon IS, et al. (2014) Overexpression ofPYL5in rice enhances drought tolerance, inhibits growth, and modulates gene expression. J Exp Bot 65: 453–464.
doi:10.1093/jxb/ert397PMID:24474809
14. Guo C, Ge X, Ma H (2013) The riceOsDILgene plays a role in drought tolerance at vegetative and reproductive stages. Plant Mol Biol 82: 239–253. doi:10.1007/s11103-013-0057-9PMID:23686450
15. Liu AL, Zou J, Liu CF, Zhou XY, Zhang XW, Luo GY, et al. (2013) Over-expression ofOsHsfA7 enhanced salt and drought tolerance in transgenic rice. BMB Rep 46: 31–36. PMID:23351381
16. Uga Y, Sugimoto K, Ogawa S, Rane J, Ishitani M, Hara N, et al. (2013) Control of root system architec-ture byDEEPER ROOTING 1increases rice yield under drought conditions. Nat Genet 45: 1097–1102.
17. Jeong JS, Kim YS, Redillas MC, Jang G, Jung H, Bang SW, et al. (2013)OsNAC5overexpression enlarges root diameter in rice plants leading to enhanced drought tolerance and increased grain yield in the field. Plant Biotechnol J 11: 101–114. doi:10.1111/pbi.12011PMID:23094910
18. Zhou L, Ni E, Yang J, Zhou H, Liang H, Li J, et al. (2013) RiceOsGL1-6is involved in leaf cuticular wax accumulation and drought resistance. PLoS One 8: e65139. doi:10.1371/journal.pone.0065139 PMID:23741473
19. Zhai R, Feng Y, Wang H, Zhan X, Shen X, Wu W, et al. (2013) Transcriptome analysis of rice root heter-osis by RNA-Seq. BMC Genomics 14: 19. doi:10.1186/1471-2164-14-19PMID:23324257
20. Henry A, Gowda VRP, Torres RO, McNally KL, Serraj R (2011) Variation in root system architecture and drought response in rice (Oryza sativa): Phenotyping of the OryzaSNP panel in rainfed lowland fields. Field Crops Research 120: 205–214.
21. Rabello AR, Guimaraes CM, Rangel PH, Da SF, Seixas D, Souza E, et al. (2008) Identification of drought-responsive genes in roots of upland rice (Oryza sativaL). BMC Genomics 9: 485. doi:10.1186/ 1471-2164-9-485PMID:18922162
22. Moumeni A, Satoh K, Kondoh H, Asano T, Hosaka A, Venuprasad R, et al. (2011) Comparative analy-sis of root transcriptome profiles of two pairs of drought-tolerant and susceptible rice near-isogenic lines under different drought stress. BMC Plant Biol 11: 174. doi:10.1186/1471-2229-11-174PMID: 22136218
23. Ma TL, Wu WH, Wang Y (2012) Transcriptome analysis of rice root responses to potassium deficiency. BMC Plant Biol 12: 161. doi:10.1186/1471-2229-12-161PMID:22963580
24. Takehisa H, Sato Y, Antonio BA, Nagamura Y (2013) Global transcriptome profile of rice root in response to essential macronutrient deficiency. Plant Signal Behav 8: e24409. doi:10.4161/psb. 24409PMID:23603969
25. Dubey S, Shri M, Misra P, Lakhwani D, Bag SK, Asif MH, et al. (2014) Heavy metals induce oxidative stress and genome-wide modulation in transcriptome of rice root. Funct Integr Genomics. 14(2):401–
417. doi:10.1007/s10142-014-0361-8PMID:24553786
26. Takehisa H, Sato Y, Igarashi M, Abiko T, Antonio BA, Kamatsuki K, et al. (2012) Genome-wide tran-scriptome dissection of the rice root system: implications for developmental and physiological functions. Plant J 69: 126–140. doi:10.1111/j.1365-313X.2011.04777.xPMID:21895812
27. Mizuno H, Kawahara Y, Sakai H, Kanamori H, Wakimoto H, Yamagata H, et al. (2010) Massive parallel sequencing of mRNA in identification of unannotated salinity stress-inducible transcripts in rice (Oryza sativaL.). BMC Genomics 11: 683. doi:10.1186/1471-2164-11-683PMID:21122150
28. Jo K, Kwon HB, Kim S (2014) Time-series RNA-seq analysis package (TRAP) and its application to the analysis of rice,Oryza sativaL. ssp. Japonica, upon drought stress. Methods 67: 364–372. doi:10.
1016/j.ymeth.2014.02.001PMID:24518221
29. Tanksley SD, Mccouch SR (1997) Seed banks and molecular maps: unlocking genetic potential from the wild[J]. Science 277(5329): 1063–1066. PMID:9262467
30. Ishii T, Brar DS, Multani DS, Khush GS (1994) Molecular tagging of genes for brown planthopper resis-tance and earliness introgressed fromOryzaaustraliensis into cultivated rice,O.sativa. Genome 37: 217–221. PMID:18470071
31. Liu FX, Sun CQ, Tan LB, Fu YC, Li DJ, Wang XK(2003) Identification and mapping of quantitative trait loci controlling cold-tolerance of Chinese common wild rice (O.rufipogonGriff.) at booting to flowering stages. Chinese Science Bulletin 48(19):2068–2071.
32. Li DJ, Sun CQ, Fu YC, Li C, Zhu ZF, Chen L, et al. (2002) Identification and mapping of genes for improving yield from Chinese common wild rice(O.rufipogonGriff.) using advanced backcross QTL analysis. Chinese Science Bulletin 18: 1533–1537.
33. Tan L, Li X, Liu F, Sun X, Li C, Zhu Z, et al. (2008) Control of a key transition from prostrate to erect growth in rice domestication. Nat Genet 40: 1360–1364. doi:10.1038/ng.197PMID:18820699
34. Zhou Y, Lu D, Li C, Luo J, Zhu BF, Zhu J, et al. (2012) Genetic control of seed shattering in rice by the APETALA2 transcription factorSHATTERING ABORTION1[C][W][OA]. Plant Cell 24: 1034–1048. doi:10.
1105/tpc.111.094383PMID:22408071
35. Zhang X, Zhou S, Fu Y, Su Z, Wang X, Sun C (2006) Identification of a drought tolerant introgression line derived from Dongxiang common wild rice (O.rufipogonGriff.). Plant Mol Biol 62: 247–259. PMID:
16845479
36. Yoshida S, Forno D, Cook J, Gomez K (1976) Laboratory manual for physiological studies of rice: Manila: International Rice Research Institute. 61–67 p.
37. Grabherr MG, Haas BJ, Yassour M, Levin JZ, Thompson DA, Amit I, et al. (2011) Full-length transcrip-tome assembly from RNA-Seq data without a reference genome. Nat Biotechnol 29: 644–652. doi:10.
38. Gotz S, Garcia-Gomez JM, Terol J, Williams TD, Nagaraj SH, Nueda MJ, et al. (2008) High-throughput functional annotation and data mining with the Blast2GO suite. Nucleic Acids Res 36: 3420–3435. doi:
10.1093/nar/gkn176PMID:18445632
39. Ye J, Fang L, Zheng H, Zhang Y, Chen J, Zhang Z, et al. (2006) WEGO: a web tool for plotting GO annotations. Nucleic Acids Res 34: W293–W297. PMID:16845012
40. Li B, Dewey CN (2011) RSEM: accurate transcript quantification from RNA-Seq data with or without a reference genome. BMC Bioinformatics 12: 323. doi:10.1186/1471-2105-12-323PMID:21816040 41. Mortazavi A, Williams BA, McCue K, Schaeffer L, Wold B (2008) Mapping and quantifying mammalian
transcriptomes by RNA-Seq. Nat Methods 5: 621–628. doi:10.1038/nmeth.1226PMID:18516045
42. Anders S, Huber W (2010) Differential expression analysis for sequence count data. Genome Biol 11: R106. doi:10.1186/gb-2010-11-10-r106PMID:20979621
43. Quail MA, Kozarewa I, Smith F, Scally A, Stephens PJ, Durbin R, et al. (2008) A large genome center's improvements to the Illumina sequencing system. Nat Methods 5: 1005–1010. doi:10.1038/nmeth.
1270PMID:19034268
44. Song WY, Wang GL, Chen LL, Kim HS, Pi LY, Holsten T, et al. (1995) A receptor kinase-like protein encoded by the rice disease resistance gene,Xa21. Science 270: 1804–1806. PMID:8525370
45. Jeung JU, Kim BR, Cho YC, Han SS, Moon HP, Lee YT, et al. (2007) A novel gene,Pi40(t), linked to the DNA markers derived from NBS-LRR motifs confers broad spectrum of blast resistance in rice. Theor Appl Genet 115: 1163–1177. PMID:17909744
46. Xiao Jinhua, Grandillo Silvana, Sang Nag Ahn, McCouch SR (1996) Genes from wild rice improve yield. Nature: 223–224.
47. Zhang QJ, Zhu T, Xia EH, Shi C, Liu YL, Zhang Y, et al. (2014) Rapid diversification of fiveOryzaAA genomes associated with rice adaptation. Proc Natl Acad Sci U S A doi:10.1073/pnas.1418307111 48. Wang F, Yuan QH, Shi L, Qian Q, Liu WG, Kuang BG, et al. (2006) A large-scale field study of trans-gene flow from cultivated rice (Oryza sativa) to common wild rice (O.rufipogon) and barnyard grass (Echinochloa crusgalli). Plant Biotechnol J 4: 667–676. PMID:17309736
49. Shi Y, Yan X, Zhao P, Yin H, Zhao X, Xiao H, et al. (2013) Transcriptomic analysis of a tertiary relict plant, extreme xerophyte Reaumuria soongorica to identify genes related to drought adaptation. PLoS One 8: e63993. doi:10.1371/journal.pone.0063993PMID:23717523
50. Ji XM, Raveendran M, Oane R, Ismail A, Lafitte R, Bruskiewich R, et al. (2005) Tissue-specific expres-sion and drought responsiveness of cell-wall invertase genes of rice at flowering. Plant Mol Biol 59: 945–964. PMID:16307368
51. Ma N, Wang Y, Qiu S, Kang Z, Che S, Wang G, et al. (2013) Overexpression ofOsEXPA8, a root-spe-cific gene, improves rice growth and root system architecture by facilitating cell extension. PLoS One 8: e75997. doi:10.1371/journal.pone.0075997PMID:24124527
52. Zhou J, Wang X, Jiao Y, Qin Y, Liu X, He K, et al. (2007) Global genome expression analysis of rice in response to drought and high-salinity stresses in shoot, flag leaf, and panicle. Plant Mol Biol 63: 591–
608. PMID:17225073