_____________________________
*)Corresponding author: atrnik@ukf.sk
doi: 10.2298/SOS1301003T
UDK 622.785;621.315.612
Investigation of Sintering in Electroceramics by
Thermodilatometry
A. Trník
1,2,*), J. Morav
č
íková
1, M. Keppert
2, I. Medve
ď
1,2 1Department of Physics, Constantine the Philosopher University, A. Hlinku 1, 949 74 Nitra, Slovakia
2
Department of Materials Engineering and Chemistry, Czech Technical University, Thákurova 7, 16629 Prague, Czech Republic
Abstract:
Solid-state sintering was investigated in electroceramic samples using thermodilatometric measurements. The samples were studied in the isothermal regime at the temperatures 500, 600, 700, 800, 900, 1000 and 1050 °C. The relative expansion was measured for a period of 8 h. At a given temperature a dominant diffusion mechanism for the sintering process was determined, and the corresponding porosity together with the pore size distribution was also measured.
Keywords: Sintering, Electroceramics, Thermodilatometry, Lattice diffusion, Grain
boundaries diffusion
1. Introduction
Understanding of thermal behavior of ceramics, e.g., the densification and sintering process, the reaction kinetics, phase transitions, glaze development, can provide insights into its firing processes and the influence of additives and raw materials. Thermodilatometric analysis (TDA) is a very suitable and commonly used method for investigation of such processes in ceramics. In this paper we used the TDA to investigate one of these thermal processes, namely, sintering.
Sintering is a high-temperature technological process that transforms individual ceramic particles into a compact polycrystalline body. This process is widely used to fabricate bulk ceramic components [1, 2]. The driving force of the sintering process is an excess of the free energy associated with the large free surface of an agglomerate of fine powder particles. During solid-state sintering powder particles are welded to their neighbors, junctions between them are gradually increased with time, and the internal free surface of the powder compact is decreased [2, 3]. Sintering is accompanied by the vanishing of the porosity, which is connected with shrinkage of the sample measurable by dilatometer.
Sintering processes can be divided into two types: solid-state sintering and liquid-phase sintering. For traditional kaolin-based ceramics, solid state sintering occurs when the powder compact is densified wholly in a solid state at the sintering temperature 600 - 1000 °C, while liquid phase sintering occurs when a liquid phase is present in the powder compact during sintering at temperatures higher than 1050 °C [1, 2].
the fact that, up to 650 °C, the sintering runs simultaneously with dehydroxylation. The latter is the phase transformation of kaolinite crystal into metakaolinite, starting at ∼450 °C. The thermal expansion terminates at the temperature ~900 °C, when the collapse of the metakaolinite lattice accompanied by rapid shrinkage appears. Identically, there is a steep increase of some mechanical properties (modulus of elasticity, mechanical strength) as the response to a faster solid state sintering and on the new structure rather than the defect and microporous metakaolinite [4]. This is due to improving the contacts between crystals as a consequence of the solid state sintering [2, 5].
From the microscopic point of view, one may interpret shrinkage results using the standard two-spherical-particle model of initial stages of sintering introduced in [6]. There are only two possible sintering mechanisms that can contribute to the shrinkage: lattice (volume) diffusion of atoms from grain boundaries and grain boundary diffusion of atoms from grain boundaries. Their dependencies on time are given as [1]
3 / 1 2 / 1
,
B
t
l
l
t
A
l
l
gb lat−
=
⎟
⎠
⎞
⎜
⎝
⎛ Δ
−
=
⎟
⎠
⎞
⎜
⎝
⎛ Δ
, (1)
respectively, with 3 / 1 4 2 / 1 3 4 3 , ⎟ ⎠ ⎞ ⎜ ⎝ ⎛ Ω = ⎟ ⎠ ⎞ ⎜ ⎝ ⎛ Ω = kTa D B kTa D
A l
γ
s bδ
bγ
s , (2)where Dl and Db is the lattice and grain boundary diffusivity, respectively, δb is the grain
boundary diffusion thickness, γs is the specific surface energy, Ω is the atomic (molecular)
volume, k is the Boltzmann constant, T is the thermodynamic temperature, and a is the particle (grain) radius.
The aim of the article is to observe the sintering with the help of the TDA during isothermal heating at different temperatures and to employ the standard two-spherical-particle model of initial stages of sintering to fit our experimental data.
2. Sample and measurement method
Green electroceramic samples were made from a mixture of kaolin (35.5 wt. %), Al2O3 (35 wt. %), and feldspar (29.5 wt. %). The mixture was ground and sieved on a 100
mesh/mm2 sieve and then a plastic material was prepared from this mixture. The cylindrical samples ∅12×50 mm were made with a laboratory extruder.
Since solid-state sintering and dehydroxylation run simultaneously between ∼600 °C and ∼650 °C, the samples were preheated at 490 °C for 44 h to reach a complete transformation of kaolinite into metakaolinite. This temperature is inside the dehydroxylation region but under the solid-state sintering region. The fact that dehydroxylation was completed in the preheated samples was tested by thermogravimetry. No changes of weight were observed above 400 °C. After 44 h the samples lost 5.1 % of their weight, which corresponds to an amount of constituent water in the green mixture.
Preheated samples were studied by thermodilatometry in the isothermal regime at the temperatures 500, 600, 700, 800, 900, 1000 and 1050 °C. The value of the highest temperature (1050 °C) ensures no creation of the liquid phase in the samples.
heating. The relative expansion of the sample was measured during 8 h. The measurements were repeated with fresh samples to confirm measured results.
The total porosity was calculated with the help of experimentally determined bulk density and matrix density. The bulk density was obtained by means of size and weight measurements of cylindrical samples. The matrix density was measured by the helium pycnometry (Pycnomatic ATC, Porotec). The pore size distribution was measured by the mercury intrusion porosimetry (Pascal 140+440, Thermo). This method detects only pores smaller than 100 m in diameter. Hence, the porosity measured by the mercury porosimetry is lower than the total porosity.
3. Results and discussion
The results of thermodilatometry during the linear heating are depicted in Fig. 1. It is generally accepted that dehydroxylation in the green ceramic sample begins at the temperature 420 – 450 °C [8]. This process is accompanied by a sample contraction above 500 °C, which is a consequence of the transform of kaolinite into metakaolinite. In the case of pure kaolinite, the contraction continues up to 1050 °C [9]. The thermodilatometric curve of the green sample shows the contraction only up to 800 °C. The main reason of the expansion above 800 °C is that pure kaolin is not used, but 65 wt.% of the sample are expanding constituents (alumina and feldspar). In fact, the thermodilatometric curve is a sum of three curves, for feldspars, kaolin and alumina. At 850 – 950 °C metakaolinite is replaced by a spinel phase [10]. The spinel phase then transforms into mullite above 1075 °C [11, 12]. Note that above ∼950 °C contraction of the sample occurs until 1050 °C (see Fig.1).
Fig. 1 shows also the thermodilatometric curve of a sample which was thermally treated during 44 h at 490 °C (the black curve). As thermogravimetry confirmed, the sample does not contain constituent water. So, the contraction starting above 600 °C cannot be attributed to dehydroxylation. Rather, we attribute it to solid-state sintering. Similarly as for the green sample, two competing mechanisms take place. One of them is solid-state sintering, which leads to the contraction, and the other is thermal expansion of metakaolinite, feldspar, and alumina. The steep contraction starting above ∼950 °C is again due to collapse of the dehydroxylated phyllosilicate structure [13, 14].
Fig. 2 depicts thermodilatometric curve from the room temperature to a given temperature of the isothermal heating at 1050 °C. Section 0-S responds to the linear heating (as shown in Fig. 1) with the heating rate 20 °C/min. The isothermal heating (section S-E) started afterwards, at ∼52 min.
Fig. 2. Thermodilatometric curve for 1050 °C.
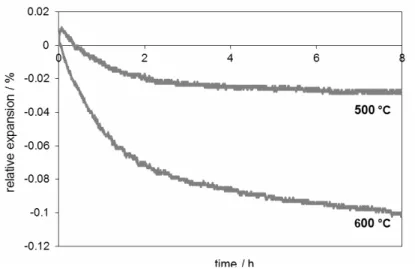
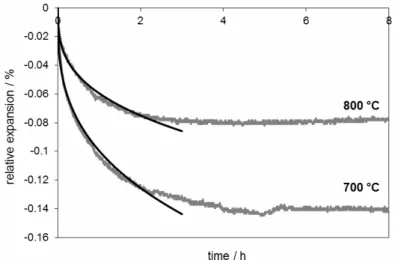
The results of thermodilatometry in the isothermal regime are presented in Figs. 3-5. The time t = 0 corresponds to the point S in Fig. 2. The results of thermodilatometric curves for isothermal heating at 500 – 800 °C (see Figs. 3 and 4) show that the rule “the higher the temperature, the bigger the final contraction” need not obeyed. The result of sintering of the sample fired at 800 °C is too small because of the expansion of the ceramic components (alumina and feldspar). Nevertheless, the results of fired samples at 900, 1000, and 1050 °C show that the rule is valid in this temperature range. For temperatures higher than 1000 °C the contraction continued all the time and reached 2.5 %.
Fig. 3. Thermodilatometric curves for isothermal heatings at 500 °C, 600 °C.
ν
t C l
l − = ⎟ ⎠ ⎞ ⎜ ⎝ ⎛ Δ
(4)
to estimate the power > 0 that best fits the experimental data on shrinkage to see whether is close to 1/2 (lattice diffusion) or 1/3 (grain boundary diffusion). This will allow us to conclude which of the two sintering mechanisms causing shrinkage is dominant or whether both mechanisms are significant and must be considered together.
Tab. I The values of the parameters from Eq. (4) obtained from the fitting procedure. C / 10-6 s
-Value Standard error Value Standard error R
2
500 °C 0.562 0.004 1.133 0.044 0.9959
600 °C 0.523 0.005 5.743 0.238 0.9974
700 °C 0.296 0.002 83.51 1.612 0.9990
800 °C 0.300 0.003 47.46 1.112 0.9986
900 °C 0.508 0.004 11.36 0.415 0.9984
1000 °C 0.319 0.001 264.9 1.759 0.9999
1050 °C 0.531 0.001 136.3 1.780 0.9996
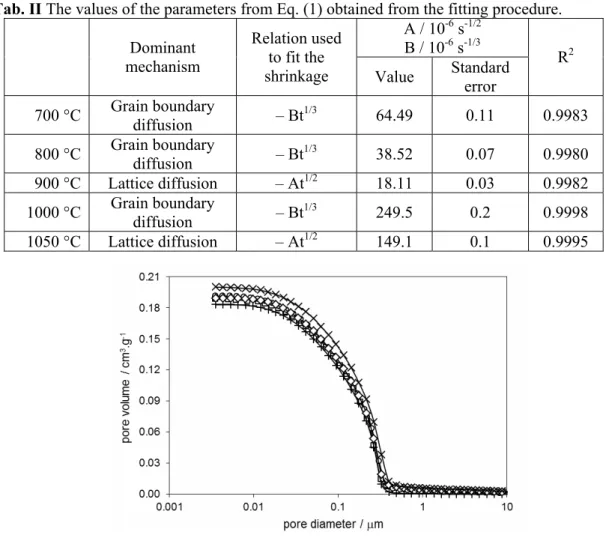
The results are given in Table I. One may observe that the power is either close to 1/2 (for the temperatures 500 °C, 600 °C, 900 °C, and 1050 °C) or to 1/3 (for the temperatures 700 °C, 800 °C, and 1000 °C). Thus, it follows that one of the sintering mechanisms is always dominant as far as shrinkage is concerned, while the other mechanism is insignificant. Therefore, when fitting the shrinkage experimental data by applying the relations from Eq. (1), it is sufficient to consider only the dominant mechanism and use only the corresponding relation.
Fig. 4. Thermodilatometric curves for isothermal heatings at 700 °C, 800 °C and the corresponding theoretical fits.
parameter A or B is close to the value of the parameter C given for that temperature in Table I.
Fig. 5. Thermodilatometric curves for isothermal heatings at 900 °C, 1000 °C, 1050 °C and the corresponding theoretical fits.
Thus, at lower temperatures grain boundary diffusion is prevailing, while at higher temperatures lattice diffusion dominates. For 500 °C and 600 °C it is questionable whether solid-state sintering already occurs at these two temperatures, and hence the results from Table I, indicating that lattice diffusion is the sintering mechanism, could be impaired. Moreover, the collapse of the dehydroxylated phyllosilicate structure at ~950 °C [13, 14] necessarily influences the sintering process so that grain boundary diffusion need not be the correct sintering mechanism for 1000 °C, as Tables I and II show. Therefore, interpretation of the results is rather complex due to the fact that the studied material contains several components that behave differently in dependence on the temperature, thus causing different overall effects on the sample as a whole.
Fig. 6. Bulk and matrix density and porosity of the samples. ( – bulk density, ◊– matrix density, Δ – porosity)
1050 °C, the decrease in the porosity being 1.5 %.
Tab. II The values of the parameters from Eq. (1) obtained from the fitting procedure. A / 10-6 s-1/2
B / 10-6 s-1/3 Dominant
mechanism
Relation used to fit the
shrinkage Value Standard error
R2
700 °C Grain boundary
diffusion – Bt
1/3 64.49 0.11 0.9983
800 °C Grain boundary
diffusion – Bt
1/3
38.52 0.07 0.9980
900 °C Lattice diffusion – At1/2 18.11 0.03 0.9982
1000 °C Grain boundary
diffusion – Bt
1/3 249.5 0.2 0.9998
1050 °C Lattice diffusion – At1/2 149.1 0.1 0.9995
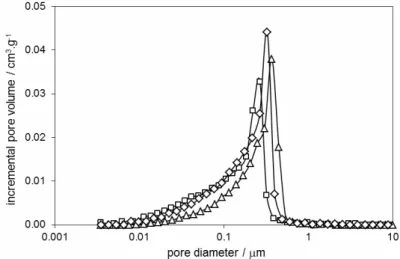
Fig. 7. Pore size distribution of the fired samples at different temperature ( – the sample fired at 500 °C, + – the sample fired at 600 °C, ◊ – the sample fired at 700 °C, o – the sample
fired at 800 °C, × – the sample fired at 900 °C).
Fig. 8. Pore size distribution (Frequency curves corresponding to Fig. 7) of the fired samples at different temperature ( – the sample fired at 500 °C, + – the sample fired at 600 °C, ◊ –
Fig. 9. Pore size distribution of the fired samples at different temperature ( – the sample fired at 500 °C, ◊ – the sample fired at 1000 °C, Δ – the sample fired at 1050 °C).
Fig. 10. Pore size distribution (Frequency curves corresponding to Fig. 9) of the fired samples at different temperature ( – the sample fired at 500 °C, ◊ – the sample fired at 1000 °C,
Δ – the sample fired at 1050 °C).
Fig.s 7 – 10 show the results on the pore size distribution for all samples. In Figs. 7 and 8 the samples are fired at 500 °C – 900 °C. It is clear that the pore size practically does not change with the temperature. The results of pore size distribution for the samples fired at 500 °C, 1000 °C and 1050 °C are shown in Figs. 9 and 10. Comparing the obtained results, we conclude that pore size increases with the temperature above 900 °C, which is in agreement with the results in [15].
4. Conclusions
mainly at the lower temperatures. It is an outcome of the complexity of the tested material and processes occurring in it. For the temperatures 500 °C – 800 °C only a small contraction (0.15 – 0.20 %) was observed and after 4 h the samples became stabilized. For temperatures higher than 1000 °C contraction continued all the time and reached 2.5 %.
Using our experimental data, we found that a different sintering mechanism is dominant (as far as shrinkage is concerned) for different temperatures. For 700 °C and 800 °C the dominant mechanism is grain boundary diffusion of atoms from grain boundaries (the shrinkage vs. time curve behaves as t1/3), while for 900 °C and 1050 °C it is lattice (volume) diffusion of atoms from grain boundaries (the shrinkage vs. time curve behaves as t1/2).
Finally, we found out that the porosity increased up to 900 °C and then it rapidly decreased. The pore size remained almost unchanged up to 900 °C and it slightly increased afterwards.
Acknowledgements
This work was supported by the grants VEGA 1/0646/12, financed by the Ministry of Education of Slovakia. The authors also gratefully acknowledge the financial support of the Czech Science Foundation, Project No. P105/12/G059. Authors wish to thank the ceramic plant PPC Čab for providing samples.
5. References
1. S.L. Kang, Sintering: Densification, grain growth and microstructure, Elsevier Oxford, 2005.
2. K. Traore, T.S. Kabre, P. Blanchart, Ceramics International, 27 (2001) 875.
3. E.A. Olevsky, A. Maximenko, O. Biest, International journal of mechanical sciences, 44 (2002) 755.
4. I. Štubňa, A. Trník, L. Vozár, Ceramics International, 35 (2009) 1181.
5. K. Winkelmann, O. Gobel, A.P. Nikkila, P. Vuorinen, T. Mantyla, E. Zschech, Metall, 48 (1994) 382.
6. W.D. Kingery, M. Berg, J. Appl. Phys., 26 (1955) 1205.
7. I. Štubňa, A. Vážanová, G. Varga, D. Hrubý, in: “Proc. Conf. Research and Teaching of Physics on the Context of University Education”, SPU Nitra, Nitra 2007, p. 69-74. 8. I. Štubňa, A. Trník, Ceramics – Silikáty, 51 (2007) 102-105.
9. G. Varga, A. Trník, in: “Proc. VII. Scientific conference of PhD students and young researchers”, Constantine the Philosopher University, Nitra, 2006, p. 612-616.
10.Y.F. Liu, X.Q. Liu, et al., Ceramics International, 28 (2002) 479. 11.C.Y. CHen, W.H. Tuan, Ceramics International, 27 (2001) 795.
12.G.W. Brindley, M. Nakahira, J. of the Amer. Ceramic Soc., 42 (1959) 314.
13.I. Štubňa, A. Trník, R. Podoba, R. Sokolář, P. Bačík, Journal of the Ceramic Society of Japan, 120 (2012) 351-354.
14.A. Trník, I. Štubňa, G. Varga, P. Bačík, R. Podoba, Journal of the Ceramic Society of Japan, 119 (2011) 645-649.
15.S.J. Li, N. Li, Science of Sintering, 37 (2005) 173-180.
Са р а: ањ а а ањ а ј
а ј . У а а
8 h. На а а а а ј ђ а
а а ања, а а ђ а а а.
К учн р чи: ањ , а а, а ја, ја