Structural and electrical study of CaCu
3Ti
4O
12(CCTO) obtained
in a new ceramic procedure
A. F. L. AlmeidaÆP. B. A. FechineÆM. P. F. Grac¸aÆ
M. A. ValenteÆA. S. B. Sombra
Received: 20 December 2007 / Accepted: 21 February 2008 / Published online: 20 March 2008 ÓSpringer Science+Business Media, LLC 2008
Abstract In this study, the CaCu3Ti4O12(CCTO) ceramic phase was synthesized by microwave heating in a much shorter time compared with conventional ceramic methods. The results indicate that the microwave processing is a promising method for preparing CCTO ceramics. CCTO was prepared using a domestic microwave oven operated at 2.45 GHz with 800 W. The XRD, infrared and Raman scattering spectroscopy was used in the structural studies of the samples. After few minutes of microwaves irradiation the formation of CCTO was confirmed by the X-ray powder diffraction. Electrical measurements was performed and shows that the dielectric permittivity of the samples are in the order of 106.
1 Introduction
Microwave processing is a self-heating procedure that occurs through the absorption of electromagnetic energy. Since the microwave energy is directly absorbed by the sample, uniform and rapid heating can be achieved within a short period of time, and at temperatures lower than that required for furnace heating. Recently, there has been
growing interest in the use of the microwave heating for synthesis of inorganic compounds such as fast syntheses of chalcogenides [1,2], oxide superconductors [3,4], carbides [5], nitrides [6–8], complex oxides [9–12], silicides [13, 14], apatite [15], glasses [16], etc. For the syntheses of inorganic materials using microwave heating, the experi-mental conditions must be controlled strictly because a slight excess of microwave power or irradiation time might cause product melting or decomposition [17,18].
One of the instruments to radiate microwave power is a domestic microwave oven normally used for cooking. Domestic microwave ovens are inexpensive and conve-nient, and they require much shorter energy to operate. Therefore, microwave processing using a domestic oven is presumed to be a very economical synthetic method that can be expected to produce various inexpensive ceramic powders with homogeneous micro-structures and fine grain size. Consequently, sintering of ceramics using micro-waves has been found to be advantageous in terms of reduction in particle size, sintering temperature, and firing time [19]. These parameters are reported to have significant effects on the characteristics of ceramics for commercial applications.
High dielectric permittivity have been found on the oxide CaCu3Ti4O12 [20–22] (CCTO) which show a dielectric permittivity at 1 kHz of about 10.000 that is nearly constant from room temperature to 300°C. Oxides with the perovskite structure are well stabilised by their high dielectric constants (K) which lead these class of materials to a big number of technological applications [23]. However this behaviour is generally associated to ferroelectric or relaxor properties. In these cases the highest value of the K is obtained during a phase transition (as a function of temperature) presented by the material. The existence of the transition temperature event is generally a A. F. L. AlmeidaM. P. F. Grac¸aM. A. Valente
Departamento de Fı´sica, Universidade do Aveiro, Aveiro 3800-193, Portugal
A. F. L. AlmeidaP. B. A. FechineA. S. B. Sombra (&) Laborato´rio de Telecomunicac¸o˜es e Cieˆncia e Engenharia dos Materiais—(LOCEM), Departamento de Fı´sica, Universidade Federal do Ceara´, Caixa Postal 6030, CEP 60455-760 Fortaleza, Ceara, Brasil
problem when we are talking about applications of these materials. The reported results for CCTO shows that theK
is high but with small dependence on the temperature [22]. Indeed, no ferroelectric transition has been found for any ACu3Ti4O12 composition. Nonetheless, CCTO has an exceptionally high dielectric permittivity approaching 105 at low frequencies. This very high dielectric permittivity is nearly temperature independent over a large temperature range including room temperature. Furthermore, it remains unclear whether this unusual property of CCTO is intrinsic or extrinsic or some combination of both factors [24]. But, the dielectric properties of CCTO ceramics are very sen-sitive to processing.
The structure of CCTO was previously determined from neutron powder diffraction data [25]. It belong to space groupIm3 (No. 204) (point groupTh).
Such material is very promising for capacitor applica-tions and certainly for microelectronics, microwave devices (cell mobile phones for example), where the small size of the devices are crucial. HighK ceramics make it possible to noticeably miniaturize passive microwave devices. Their size can typically be reduced in comparing with classical resonators and filters by a factor of 1/pffiffiffiffiK
(relative permittivity). Recently, was carried a study of the dielectric properties [26] and of dielectric relaxation in low temperature [27] of the thick films of composite BaTiO3 (BTO)–CCTO and a study of the dielectric [28] and optic [29] properties of CCTO substrate for devices of micro-waves and antennas.
The conventional solid-state reaction of ceramic prepa-ration and microwave heating method are powerful technique to obtain powders with controlled microstructure. Recently we propose the use of mechanical alloying to produce CCTO [30]. The mechanical alloying is proving to be a powerful technique to obtain any quantity of powder with controlled microstructure [31].
Here, we describe microwave processing with a domestic microwave oven to prepare CCTO ceramics materials, from elementary powders. The advantage of this procedure remains on the fact that melting is not necessary, the powders are nanocrystalline [32]. It can also be easily shaped (injected, compacted, etc) into any geometry or used in others procedures of film preparation. The production, and the study of the properties of the CCTO ceramics is important in view of possible applications as bulk devices like microwave resonators and oscillators and thin films.
In this work we report the synthesis of CCTO ceramic obtained from a microwave processing with a domestic microwave oven and CCTO ceramic using the conven-tional solid-state reaction (calcinations+sintering) of ceramic preparation. The CCTO obtained by the irradiation microwave and by the conventional solid-state reaction are studied by x-ray powder diffraction, infrared and Raman
scattering spectroscopy. Dielectric permittivity measure-ments were carried out as a function of frequency.
2 Experimental methods
2.1 Sample preparation
Calcium hydroxide Ca(OH)2(Fluka, 96% with 4% of the CaCO3), titanium oxide (TiO2) (Aldrich, 99%) and copper (II) oxide CuO (Aldrich, 99%) were used in the CCTO preparation. The material was ground on a Fritsch Pul-verisette 5 planetary mill with the proportionality of Ca(OH)2–3CuO–4TiO2. Milling was performed in agate vials and balls under air. Mechanical alloying was per-formed for 30 min of milling. In this case the milling was used only to give a good homogeneity of the powder. However we already showed in the literature that for 100 h of milling the complete production of CCTO is possible [27]. CCTO ceramics materials was synthesized by a microwave heating procedure, for 10, 15 and 30 min.
The CCTO was also prepared by the conventional solid-state reaction using the same starting materials. The mate-rials were weighed according to the stoichiometric ratios and mixed thoroughly in an agate morthar. The mixed powder was submitted to calcination at 900 °C for 12 h. All samples were sintered in air at 1,050°C for 24 h [30]. See Table1.
Microwave synthesis was conducted using an oven operated at 2.45 GHz with 800 W. the sample powder had been placed inside of a crucible that was inside of another crucible with graphite. The graphite was used to absorb microwave energy and transfer the heat to the sample powder in order to reach the sintering temperature.
2.2 X-ray diffraction
The X-ray diffraction (XRD) patterns were obtained at room temperature (300 K) by step scanning using pow-dered samples. We used five seconds for each step of counting time, with a Cu-Ka tube at 40 kV and 25 mA using the geometry of Bragg–Brentano. The output data extracted from Rietveld refinement [33] is used to calculate the particle size. The analysis of the crystallite size (Lc) of the CCTO phase has been done for all samples using the Scherrer’s equation [34],
Lc¼
kk
bcosh ð1Þ
group of CCTO. We have used the LaB6 (SRM 660— National Institute of Standard Technology) powder standard pattern to determine the instrumental width and afterward to calculate the crystallite size via Eq.1. Theb
parameter has to be correct using the following equation:
b¼ ffiffiffiffiffiffiffiffiffiffiffiffiffiffiffiffiffiffiffiffiffiffiffiw2 expw2inst q
ð2Þ where wexp, winst are the experimental and instrumental width, respectively, obtained from LaB6powder standard pattern using the following expression:
winst ¼
ffiffiffiffiffiffiffiffiffiffiffiffiffiffiffiffiffiffiffiffiffiffiffiffiffiffiffiffiffiffiffiffiffiffiffiffiffiffiffiffiffiffiffiffiffi
Utan2hþVtanhþW p
whereU,VandWwere obtained from output file extracted from Rietveld refinement parameters of LaB6sample. The crystallite size for the ceramic obtained by microwave synthesis was also obtained, assuming coefficient k=1
(considering nearly spherical shape).
2.3 Infrared spectroscopy
The infrared spectra (FT-IR) was measured using circular pellets, made from the mixture of KBr (potassium bromate) and powder of each sample, in a ratio of KBr/sample powder near 100. This mixture was pressed with 6 ton for 15 min and all the pellets obtained present a thickness of 1.5 mm, approximately. The infrared spectra (FT-IR) were recorded in the 400–4,000 cm-1
range with a Mattson 7000 (FTIR) spectrometer.
2.4 Raman spectroscopy
The Raman spectroscopy, of the powder samples, was carried out in a T64000, Jobin Yvon SPEX spectrometer using an Ar back-scattering geometry, between 100 and 2,000 cm-1
.
2.5 Dielectric measurements
Silver paint was coated on both surfaces of the sintered disks with a parallel-plate capacitor arrangement and the
dielectric permittivity (K) and loss (D) was measured using an impedance analyzer HP4194A in the frequency range of 100 Hz from to 1 MHz in the room temperature. The K
value was calculated from Cp and the sample’s thickness and the area of the electrodes.
Table 1 Samples obtained by the irradiation microwave and conventional solid-state reaction, C—calcination at 900°C during 12 h and S—sintering at 1,050°C for 24 h
Sample Procedure Thicknesse(mm) Electrode diameter/(cm)
10 min Synthesized by 10 min of irradiation microwave – –
15 min Synthesized by 15 min of irradiation microwave – –
30 min Synthesized by 30 min of irradiation microwave – –
S10 min Synthesized by 10 min of irradiation microwave and sintering (S) 2.56 0.76
S15 min Synthesized by 15 min of irradiation microwave and sintering (S) 2.78 0.77
S30 min Synthesized by 30 min of irradiation microwave and sintering (S) 2.80 0.75
CS-CCTO Conventional solid-state reaction (calcinations (C)+sintering (S)) 2.12 3.60
20 25 30 35 40 45 50 55 60
Intensity (a. u.)
2θ (degree)
CCTO CS-CCTO
10min 30min
15min
3 Results and discussion
3.1 X-ray diffraction
Figure1 shows the XRD of samples obtained using dif-ferent times (in minutes) of the samples treated in the microwave oven and the sample prepared by the con-ventional solid-state reaction compared with the peaks of crystalline CCTO obtained from Ref. [35]. The diffrac-tion patterns confirm a good crystallinity of the different phases. As can be observed in Fig.1 the XRD of the samples indicates that the peak at 34.2°associated to the CCTO phase is present. We can notice by the diffraction patterns that there is a presence of the other phases. The Rietveld refinement was done to found out these phases (see Table2). The phases TiO2, CuO, CaTiO3and Cu2O were identified during the formation of CCTO by the microwave route. The sample prepared by the conven-tional solid-state reaction (CS-CCTO) still presents the phase TiO2. The sample prepared during 15 min present CCTO in higher quantities (90.24%) and the sample 30 min present smaller quantities (63.79%) of the CCTO as the dominant phase. The sample 20 min was rejected because did not represent well, the intermediate situation between 15 and 30 min. These results indicate the heat-ing time dependence of the prepared material. We believe that there is an optimum time to obtain CCTO in higher concentration. The approximately crystallite size (Lc) of the CCTO samples are presented in Table2. We can notice that the crystallite size decreases with the increase of the exposition time to the microwave irradiation. The values for the crystallite sizes are 83.20, 78.93 and 75.08 nm for the samples prepared during 10, 15 and 30 min respectively. All these values of the crystallite sizes suggest that the synthesis of the CCTO ceramic, obtained from the microwave processing with a domestic microwave oven, produces a nanocrystalline CCTO phase.
In Fig.2 we have the XRD of the sample obtained by the irradiation microwave at time of the 15 min and sub-mitted to sintering (S15 min) compared with the sample
prepared by the conventional solid-state reaction (CS-CCTO) and the CCTO obtained from the literature [35]. The values presented in Table2 show an increase of the crystallite size of the sample 15 min submitted to sintering. In the S15 min sample only the phases CCTO and CuO had been identified and the concentration of phase CCTO was 97.52%. This sample presents good crystallinity without the presence of phases Cu2O, TiO2and CaTiO3that existed before the sintering.
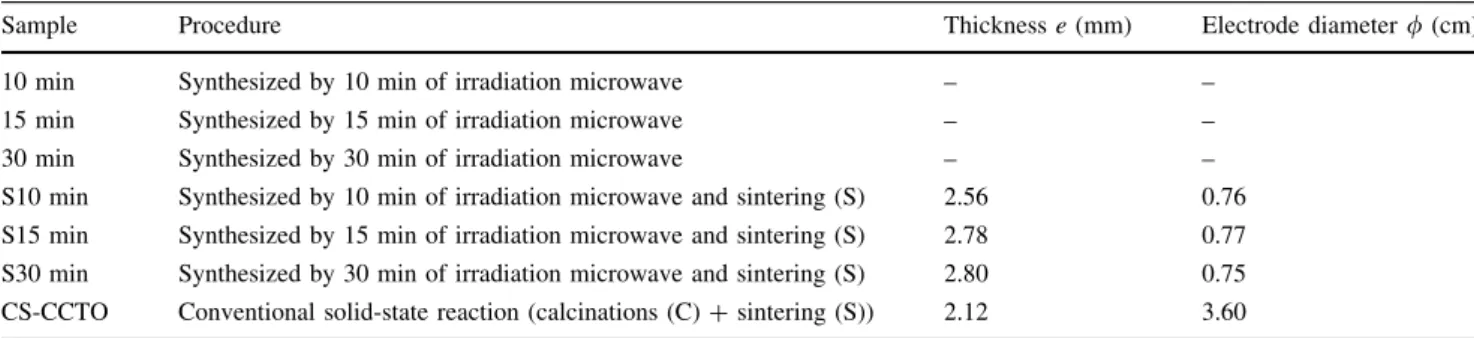
Table 2 Approximately composition of the different phases after microwave exposure, crystalline sizes (LC) and the weighted pattern R-factor (Rwp) extracted from Rietveld refinement [33]
Samples (min) Phase composition (%) LCof the CCTO (nm) Rwp (%)
CCTO TiO2 CuO CaTiO3 Cu2O
10 84.96 5.52 4.91 3.42 1.19 83.20 8.13
15 90.24 3.91 4.27 0.19 1.39 78.93 7.91
30 63.79 15.58 1.83 7.92 10.88 75.08 9.69
S15 97.52 – 2.48 – – 131.96 9.38
20 25 30 35 40 45 50 55 60
Intensity (a. u.)
2θ (degree)
CCTO CS-CCTO S15min
Fig. 2 XRD of the sample obtained by the microwave irradiation at time of the 15 min and submitted to sintering compared with the sample prepared by the conventional solid-state reaction and refer-ence of the CaCu3Ti4O12-CCTO obtained from the literature (vertical bars ICDD-JCPDS card 75–2188 [35]).d—TiO
3.2 Infrared spectroscopy
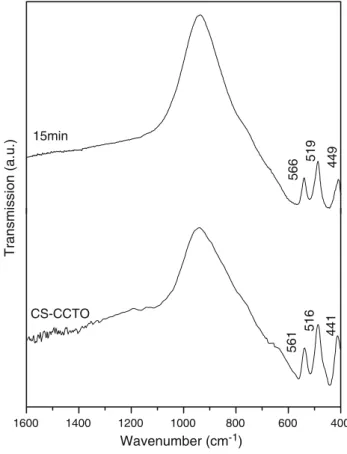
In Fig.3we have the IR spectra of the sample prepared by the conventional solid-state reaction, CS-CCTO, compared with the IR of the samples obtained by the microwave irradiation at times of the 10, 15 and 30 min. One can notice that the CS-CCTO phase present resonance absorptions at 561, 516 and 441 cm-1
. Several authors have assigned [26,30, 36, 37] this region of absorptions with the titanium ion. These bands were associated to
mTi-O= 653–550 cm
-1
and mTi-O-Ti= 495–436 cm
-1 . One can notice that the absorptions detected for the sample synthesized for 15 min, 566, 519 and 449 cm-1
, are in good agreement with the absorptions of the phase CS-CCTO (561, 516 and 441 cm-1
). The absorptions for the samples prepared during 10 min e 30 min presents a small displacement in relation the absorptions of the CS-CCTO, perhaps due to the presence of other phases, as indicated by the XRD.
In Fig.4we have the IR of the samples prepared by the conventional solid-state reaction compared with the IR of the sample obtained by the irradiation microwave at time
of the 15 min and submitted to sintering. One can notice the presence of the resonance absorptions at 559, 516 and 444 cm-1
for sample S15 min in good agreement with the absorptions of sample CS-CCTO.
3.3 Raman spectroscopy
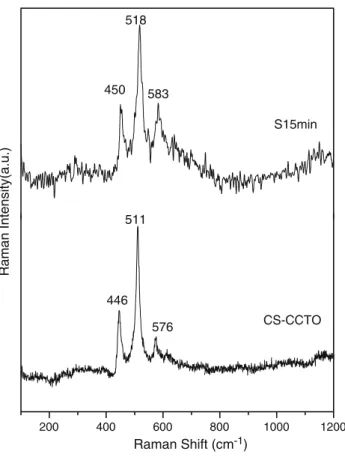
In Fig.5 one has the Raman spectra of the samples obtained by the microwave irradiation at times of the 10, 15 and 30 min, together with the sample prepared by the conventional solid-state reaction. For all the samples the three main peaks at 446, 511 and 576 cm-1
are easily identified. Assignment of the Raman spectral features to the crystalline CCTO has been reported previously [26,30, 36–38]. Scattering peaks at 445, 513 and 572 cm-1
were observed [30]. In [37] the Raman lines at 445 and 513 cm-1 were associated with the Ag symmectry (TiO6) rotation-like) and 575 cm-1
of Fg symmetry (O-Ti-O) anti-stretching). According to the literature [39] all the modes associated to titanium oxide (anatase phase) showed very intense bands at 720, 638, 515, 395, 196 and 143 cm-1
. They correspond to the Raman active normal modes of representations A1g,2B1g,3Egof the space group D4h19. The
1600 1400 1200 1000 800 600 400
441
516
561
CS-CCTO
457
520
10min
Wavenumber (cm-1)
577
15min
Transmission (a.u.)
519
449
566
30min
452
522
576
Fig. 3 Comparison of the IR of the samples obtained by the microwave irradiation at times of the 10, 15 and 30 min with the sample prepared by the conventional solid-state reaction
1600 1400 1200 1000 800 600 400
516 441
561
Wavenumber (cm-1) CS-CCTO
15min
449
519
566
Transmission (a.u.)
modes 610, 215 and 144 cm-1
of the sample 30 min can be the dislocated modes of this phase because of the presence of the phases CaTiO3, CuO, Cu2O and TiO2 as demon-strated the results of the Rietveld refinement. These results are in good agreement with the results of XRD and IR.
In Fig.6 we have a more detailed study of the Raman spectra of the sample obtained by the microwave irradia-tion, during 15 min, followed to a sintering procedure with the sample prepared by the conventional solid-state reac-tion. The active modes, 450, 517 and 581 cm-1
of the sample S15 min are in good agreement with the modes of the sample prepared by the conventional solid-state reac-tion (446, 511 and 576 cm-1
).
3.4 Dielectric permittivity measurements
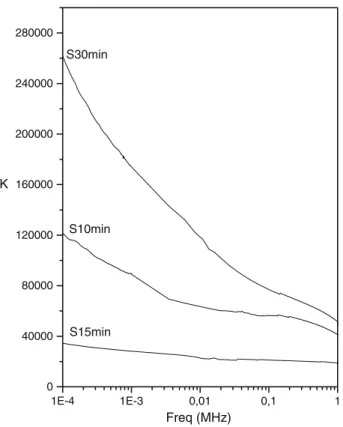
In Fig.7 one has the dielectric permittivity (K) measure-ments of the samples S10, S15 and S30 min, synthesized by 10, 15 and 30 min, respectively, of irradiation micro-wave and after sintering. The thickness of the bulks are 2.56, 2.78 and 2.80 mm, respectively. The applied elec-trode diameter is around 0.76 cm for all the bulks. One can notice that, the S30 min sample presents a higherKin the
range of frequencies under study. At 1 kHz the value is around 170.000 for the S30 min sample compared to 89.000 for the S10 min sample. However for the S15 min sample one has an unexpected result. The dielectric per-mittivity is lower for all the frequencies under study. At 1 kHz the value of theKis around 28.000. Which is still very big compared to the literature [20–24, 26–30]. For 30 min sample and for S15 min sample there is a tendency do decrease ofK with the increase of the frequency from 100 Hz to 1 MHz. This behavior is less accentuated for the S15 min sample. Guillemet-Fritsch et al. [40] observed values greater than 105in samples contend phases, CuO, CaTiO3, whose presence this contributing for increase of the dielectric permittivity. The high ‘‘apparent’’ permit-tivity is therefore probably associated with an internal barrier layer capacitor: the bulk of the grains would behave like other semiconducting perovskites while the grain boundaries and/or the shell would be insulating layers. Hence, for the same sample thickness, the grain size and the nature of the grain boundary are likely to have an impact on the final electrical properties. At the same time that the existence of CaTiO3 could be considered as responsible at the same time of an increase in the value of
200 400 600 800 1000 1200
CS-CCTO
446 576
573 443
10min
Raman Shift (cm-1) 511
512
15min
Raman Intensity (a.u.)
512
578 446
215 144
443 513
577 610
30min
Fig. 5 Comparison of the Raman spectra of the samples obtained by the microwave irradiation at times of the 10, 15 and 30 min with the sample prepared by the conventional solid-state reaction
200 400 600 800 1000 1200
576 511
446
CS-CCTO S15min
Raman Shift (cm-1) 583
518
450
Raman Intensity(a.u.)
the insulating layer permittivity and of a modification of the conductivity of the grains [40–42].
In Fig.8one has the dielectric loss for these samples. At 1 kHz the loss is higher for the S30 min sample (0.31). When one increase the microwave irradiation exposure times in the samples, there is an increase of the loss. It decreases for the S10 min (0.21) and is the lowest for the S15 min sample (0.12). The decrease the microwave irra-diation exposure times in the samples lead to a tendency of decrease of the other phases and decrease the loss with frequency which is observed for the S10 and S15 min samples in the range of studied frequencies (see Fig.8). Although many researches indicate the correlation between the synthetic route which this particular material is made and its microstructure dependent dielectric property [43– 47], however the true reasons are still not not clear.
4 Conclusions
In conclusion, the use of microwave energy result in the formation of single phase CCTO in just 15 min. These materials are very promising for capacitor applications and certainly for microelectronics, microwave devices (cell mobile phones for example), where the decrease of the size of the devices are crucial.
Microwave sintering of CCTO reached in a much shorter time compared to conventional solid-state reaction The material, can be compacted and transformed in bulk ceramic samples or used in others procedures of film preparation. This microwave method presents the advan-tage that melting is not necessary and the powder obtained is nanocrystalline. The microwave method is found to be simple, fast and quite general for the preparation of tech-nologically important electroceramics.
Acknowledgements CELESTICA, FINEP, CAPES, CNPq (Brazi-liam agencies) and FCT—Fundac¸a˜o para Cieˆncia e Tecnologia (Portuguese agencie—SFRH/BPD/20904/2004). UIFSCOSD, Physics Department, University of Aveiro, Portugal. Laborato´rio de raios-X, Departamento de Fı´sica, Universidade Federal do Ceara´, Brasil, with support of CNPq-AT (Eulivana Assunc¸a˜o Livalter) and the U.S. Air Force Office of Scientific Research (AFOSR) (FA9550-06-1-0543).
References
1. A.G. Whittaker, D.M.P. Mingos, J .Chem. Soc. Dalton Trans.18, 2751 (1992)
2. A.G. Whittaker, D.M.P. Mingos, J. Chem. Soc. Dalton Trans.12, 2073 (1995)
3. D.R. Baghurst, A.M. Chippindale, D.M.P. Mingos, Nature33224, 311 (1988)
1E-4 1E-3 0,01 0,1 1
0 40000 80000 120000 160000 200000 240000 280000
K
Freq (MHz) S30min
S10min
S15min
Fig. 7 The dielectric constants (K) of CCTO at room temperature. The samples were obtained by the microwave irradiation at times of the 10, 15 and 30 min and sintered in at 1,050°C for 24 h
1E-4 1E-3 0,01 0,1 1
0,0 0,1 0,2 0,3 0,4 0,5 0,6 0,7
D
Freq (MHz) S30min
S10min
S15min
4. M. Kato, K. Sakakibara, Y. Koike, Jpn. J. Appl. Phys.36, L1291 (1997)
5. P.D. Ramesh, B. Vaidhyanathan, M. Ganguli, K.J. Rao, J. Mater. Res.2, 3025 (1994)
6. P.D. Ramesh, K.J. Rao, J. Adv. Mater.7, 717 (1995)
7. J.D. Houmes, H.C. zur Loye, J. Solid State Chem.130, 266 (1997) 8. B. Vaidhyanathan, K.J. Rao, J. Chem. Mater.9, 1196 (1997) 9. D.R. Baghurst, A.M. Chippindale, D.M.P .Mingos, Nature.
332(24), 311 (1988)
10. H.W. Yan, X.J. Huang, Z.H. Lu, H. Huang, R.J. Xue, L.Q. Chen, J. Power Sources68, 530 (1997)
11. P.S. Whiteld, I.J. Davidson, J. Electrochem. Soc.147(12), 4476 (2000)
12. T. Kimura, H. Takizawa, K. Uheda, T. Endo, M. Shimada, J. Mater. Synth. Process.9, 57 (2001)
13. B. Vaidhyanathan, K.J. Rao, J. Mater. Res.12(12), 3225 (1997) 14. J.R. Jokisaari, S. Bhaduri, S.B. Bhaduri, Mater. Sci. Eng. A323,
478 (2002)
15. B. Vaidhyanathan, K.J. Rao, J. Solid State Chem.132, 349 (1997) 16. B. Vaidhyanathan, M. Ganguli, K.J. Rao, J. Solid State Chem.
113, 448 (1994)
17. M. Higuchi, K. Katayama, Y. Azuma, M. Yukawa, M. Suhara, J. Power Sources5303, 1 (2003)
18. M. Gasgnier, J. Ostorero, A. Petit, J. Alloys Compd.275, 41 (1998) 19. B. Swain, Adv. Mater. Process.134, 76 (1989)
20. M.A. Subramanian, D. Li, N. Duran, B.A. Reisner, A.W. Sleight, J. Sol. State Chem.151, 323 (2000)
21. A.P. Ramirez, M.A. Subramanian, M. Gardel, G. Blumberg, D. Li, T. Vogt, S.M. Shapiro, Solid State Commun.115, 217 (2000) 22. M.A. Subramanian, A.W. Sleight, Solid State Sci.4, 347 (2002) 23. N. Setter, E.L. Colla,Ferroelectric Ceramics(Birkhauser Verlag,
Berlin, 1993)
24. M.A. Subramanian, A.W. Sleight, Solid State Sci.4, 347 (2002) 25. B. Bochu, M.N. Deschizeaux, J.C. Joubert, J. Solid State Chem.
29, 291 (1979)
26. A.F.L. Almeida, P.B.A. Fechine, J.C. Go´es, M.A. Valente, M.A.R. Miranda, A.S.B. Sombra, Mat. Sci. Eng B. 111, 113 (2004)
27. P.B.A. Fechine, A.F.L. Almeida, J.C. Go´es, J.M. Sasaki, R. Jimenez, J. Mendiola, A.S.B. Sombra, Mater. Chem. Phys. 96, 402 (2006)
28. L.C. Kretly, A.F.L. Almeida, P.B.A. Fechine, R.S. de Oliveira, A.S.B. Sombra, J. Mat. Sci.15, 657 (2004)
29. A.F.L. Almeida, R.E.S. Oliveira, J.M. Sasaki, A.S.B. Sombra, L.C. Kretly, Micr. Opt. Technol. Lett.39, 145 (2003)
30. A.F.L. Almeida, R.S. de Oliveira, J.C. Go´es, J.M. Sasaki, J.M. Filho, A.S.B. Sombra, Mat. Sci. Eng. B.96, 275 (2002) 31. R.S. de Figueiredo A. Messai A.C. Hernandes A.S.B. Sombra
J. Mat. Sci. Lett.17, 449 (1998)
32. H. Gleiter, Nanostruc. Mater.1, 1 (1992); J. Appl. Crystallogr. 24, 79 (1991)
33. H.M. Rietveld, Acta Crystallogr.22, 151 (1967)
34. L.V. Aza´roff,Elements of X-ray Crystallography. (McGraw-Hill, New York, 1968)
35. Joint committee on Powder Diffraction Standard (JCPDS), International Centre for Diffraction Data, (JCPDS File 75–2188), (1979)
36. S. Music, M. Gotic, M. Ivanda, S. Popovic, A. Turkovic, R. Trojko, A. Sekulic, K. Furic, Mat. Sci. Eng. B47, 33 (1997) 37. N. Kolev, R.P. Bontchev, A. Jacobson, V.N. Popov, V.G.
Had-jiev, M.N. Iliev, Phys. Rev. B66, 132102 (2002)
38. D. Valim, A.G.S. Filho, P.T.C. Freire, S.B. Fagan, A.P. Ayala, J.M. Filho, A.F.L. Almeida, P.B.A. Fechine, A.S.B. Sombra, J.S. Olsen, L. Gerward, Phys. Rev. B70, 132103 (2004)
39. M. Pineda, J.L.G. Fierro, J.M. Palacios, C. Silleruelo, E. Garcia, J.V. Ibarra, Appl. Surf. Sci.119, 1 (1997)
40. S. Guillemet-Fritsch, T. Lebey, M. Boulos, B. Durand, J. Eur. Ceram. Soc.26, 1245 (2006)
41. K. Wakino, Ferroelectrics91, 69 (1989)
42. V.M. Ferreira, F. Azough, J.L. Baptista, R. Freer, Ferroelectrics 133, 127–132 (1992)
43. P. Jha, P. Arora, A.K. Ganguli, Mater. Lett.57, 2443 (2003) 44. J. Liu, Y. Sui, C.-G. Duan, W.-N. Mei, R.W. Smith, J.R. Hardy,
Chem. Mater.18, 3878 (2006)
45. S.F. Shao, J.L. Zhang, P. Zheng, W.L. Zhong, C.L. Wang, J. Appl. Phys.99, 084106 (2006)
46. L. Ni, X.M. Chen, X.Q. Liu, R.Z. Hou, Solid State Commun.139, 45 (2006)
![Table 2 Approximately composition of the different phases after microwave exposure, crystalline sizes (L C ) and the weighted pattern R-factor (R wp ) extracted from Rietveld refinement [33]](https://thumb-eu.123doks.com/thumbv2/123dok_br/15267328.540568/4.892.78.816.935.1070/approximately-composition-different-microwave-crystalline-extracted-rietveld-refinement.webp)