HESSD
8, 3937–3960, 2011Determining irrigation needs of
sorghum from two-source energy
J. M. S ´anchez et al.
Title Page
Abstract Introduction
Conclusions References
Tables Figures
◭ ◮
◭ ◮
Back Close
Full Screen / Esc
Printer-friendly Version Interactive Discussion
Discussion
P
a
per
|
Dis
cussion
P
a
per
|
Discussion
P
a
per
|
Discussio
n
P
a
per
|
Hydrol. Earth Syst. Sci. Discuss., 8, 3937–3960, 2011 www.hydrol-earth-syst-sci-discuss.net/8/3937/2011/ doi:10.5194/hessd-8-3937-2011
© Author(s) 2011. CC Attribution 3.0 License.
Hydrology and Earth System Sciences Discussions
This discussion paper is/has been under review for the journal Hydrology and Earth System Sciences (HESS). Please refer to the corresponding final paper in HESS if available.
Determining irrigation needs of sorghum
from two-source energy balance and
radiometric temperatures
J. M. S ´anchez1, R. L ´opez-Urrea2, E. Rubio1, and V. Caselles3
1
Applied Physics Department, School of Industrial Engineering, University of Castilla-La Mancha, Av. Espa ˜na, s/n 02071 Albacete, Spain
2
Instituto T ´ecnico Agron ´omico Provincial de Albacete and FUNDESCAM, Av. Gregorio Arcos, s/n 02006 Albacete, Spain
3
Earth Physics and Thermodynamics Department, Faculty of Physics, University of Valencia, C/Dr. Moliner, no50, 46100 Burjassot, Spain
Received: 7 April 2011 – Accepted: 18 April 2011 – Published: 20 April 2011
Correspondence to: J. M. S ´anchez ([email protected])
Published by Copernicus Publications on behalf of the European Geosciences Union.
HESSD
8, 3937–3960, 2011Determining irrigation needs of
sorghum from two-source energy
J. M. S ´anchez et al.
Title Page
Abstract Introduction
Conclusions References
Tables Figures
◭ ◮
◭ ◮
Back Close
Full Screen / Esc
Printer-friendly Version Interactive Discussion
Discussion
P
a
per
|
Dis
cussion
P
a
per
|
Discussion
P
a
per
|
Discussio
n
P
a
per
|
Abstract
Estimates of surface actual evapotranspiration (ET) can assist in predicting crop water
requirements. An alternative to the traditional crop-coefficient methods are the energy
balance models. The objective of this research was to show how surface temperature observations can be used, together with a two-source energy balance model, to de-5
termine crop water use throughout the different phenological stages of a crop grown.
Radiometric temperatures were collected in a sorghum (Sorghum bicolor) field as part
of an experimental campaign carried out in Barrax, Spain, during the 2010 summer growing season. Performance of the Simplified Two-Source Energy Balance (STSEB) model was evaluated by comparison of estimated ET with values measured on a weigh-10
ing lysimeter. Errors of ±0.14 mm h−1 and ±1.0 mm d−1 were obtained at hourly and
daily scales, respectively. Accumulated crop water use during the campaign resulted 500 mm versus the total 524 mm measured by the lysimeter. It is then shown that ther-mal radiometry can provide precise crop water necessities and is a promising tool for irrigation management.
15
1 Introduction
Understanding the surface actual evapotranspiration (ET) is essential for managers re-sponsible for planning and managing water resources, especially in arid and semi-arid regions where crop water demand generally exceeds precipitation and irrigation from surface and/or groundwater resources is then required to meet the deficit. This is par-20
ticularly sensitive in areas where water usage is regulated due to ecological protection programs, limited resources, or competitive demand (Piccinni et al., 2009).
Increasing demand for sustainable production of biofuels such as ethanol is currently driving intense research and discussion. Even though these technologies still face some important technical and economic challenges, energetic crops are expected to 25
become a relevant energy source in the near future ( ´Alvarez et al., 2010). Different
HESSD
8, 3937–3960, 2011Determining irrigation needs of
sorghum from two-source energy
J. M. S ´anchez et al.
Title Page
Abstract Introduction
Conclusions References
Tables Figures
◭ ◮
◭ ◮
Back Close
Full Screen / Esc
Printer-friendly Version Interactive Discussion
Discussion
P
a
per
|
Dis
cussion
P
a
per
|
Discussion
P
a
per
|
Discussio
n
P
a
per
|
Production of energetic crops involves changes in land uses that might compromise the water conservation strategies. This is of utmost importance in regions such as Castilla-La Mancha in central Spain, where determining crop water requirements spe-cific to each crop is key in providing growers with information to select which crops to grow and determine the timing and quantity of irrigation events throughout the growing 5
season (Montoro et al., 2010).
Actual evapotranspiration varies regionally and seasonally according to weather
con-ditions. The use of on-site meteorological data and crop coefficients enables the
de-termination of crop water use. However, generic crop coefficients will not fulfill the
need for precise irrigation applications, and specific crop coefficients need to be
devel-10
oped (L ´opez-Urrea et al., 2009a, b, c). This can be a limitation for providing spatially distributed regional ET information. Remote sensing has long been recognized as a feasible means to achieve this goal. The basis of remote sensing techniques is to de-termine ET as a residual of the land surface Energy Balance Equation (EBE), using the surface temperature as a key input (e.g. Bastiaanssen et al., 1998; Su, 2002). 15
The utility of the crop surface temperature to detect crop water stress (Pinter et al., 2003; Gardner et al., 1992; Jackson et al., 1981), and the EBE to estimate daily evapotranspiration, has been already demonstrated (Hatfield et al., 1983; Kustas and Norman, 1996; Pinter et al., 2003; Gavilan and Berengena, 2007). Some authors such as Faver et al. (1989) or Choudhury and Idso (1985) used canopy temperature to-20
gether with the Penman-Monteith equation to estimate crop ET. These authors reported high correlation between lysimeter ET and modeled ET from sorghum and wheat for selected days. Similar results were also found by Hatfield et al. (1983) and Jack-son et al. (1983) but now focusing on a particular time of day. More recently, Bashir et al. (2008) used the Surface Energy Balance Algorithm for Land (SEBAL) (Basti-25
aanssen et al., 1998), together with Landsat/ETM+ and MODIS images to estimate
ET of a large irrigated sorghum area. Comparison with ET calculated using the wa-ter balance approach, for 4 selected days, showed an average absolute error around
0.9 mm d−1. However, SEBAL requires heterogeneity in surface moisture conditions
HESSD
8, 3937–3960, 2011Determining irrigation needs of
sorghum from two-source energy
J. M. S ´anchez et al.
Title Page
Abstract Introduction
Conclusions References
Tables Figures
◭ ◮
◭ ◮
Back Close
Full Screen / Esc
Printer-friendly Version Interactive Discussion
Discussion
P
a
per
|
Dis
cussion
P
a
per
|
Discussion
P
a
per
|
Discussio
n
P
a
per
|
and is not applicable to small crop fields. These and some other problems have been
pointed out due to difficulties in quantification of aerodynamic resistances, especially
under partial fraction cover conditions (Hall et al., 1992). Two-Source Energy Balance models solved many of these limitations by allowing the estimation of soil and canopy contributions to the total energy fluxes, including evapotranspiration (Norman et al., 5
1995; Li et al., 2005).
One of the objectives of this paper is to show the potential of the Simplified Two-Source Energy Balance model (STSEB) (S ´anchez et al., 2008, 2009), together with radiometric surface temperature measurements, to determine accurate ET values un-der a variety of fraction cover conditions. In this work we focus on a forage sorghum 10
field located in “Las Tiesas” experimental site in Barrax, Spain. A field campaign was carried out in the summer growing season of 2010 with the aim of studying water bal-ance techniques and water necessities of energetic crops. A weighing lysimeter was placed in this site to register sorghum ET values, and two Infrared Thermal radiometers (IRT) were installed to measure surface temperatures.
15
The second objective of this study is to present this method as a simple and feasible technique to determine short and long-term crop water use from thermal infrared ra-diometry and ancillary meteorological data, under clear and cloudy sky conditions, and covering all stages of the crop development.
This paper is organized as follows. Information related to the study site, experimental 20
set-up, and measured variables and parameters, is presented in Sect. 2. A summary of the main equations and aspects of the STSEB approach is given in Sect. 3. Sec-tion 4 shows the analysis of the measured radiometric temperatures and the estimated surface energy fluxes in the sorghum field. Modeled values of hourly and daily ET, together with the comparison with lysimeter ET measurements, are included in this 25
HESSD
8, 3937–3960, 2011Determining irrigation needs of
sorghum from two-source energy
J. M. S ´anchez et al.
Title Page
Abstract Introduction
Conclusions References
Tables Figures
◭ ◮
◭ ◮
Back Close
Full Screen / Esc
Printer-friendly Version Interactive Discussion
Discussion
P
a
per
|
Dis
cussion
P
a
per
|
Discussion
P
a
per
|
Discussio
n
P
a
per
|
2 Study site and materials
This study was conducted during the summer of 2010 in the “Las Tiesas” farm, located between Barrax and Albacete (Central Spain). Its geographical coordinates are:
longi-tude 2◦5′W, latitude 39◦14′N, and its altitude is 695 m above sea level) (Fig. 1a). The
climate is semi-arid, Temperate Mediterranean with 320 mm of annual rainfall, mostly 5
concentrated in the spring and fall. Average mean, maximum and minimum
tempera-tures are: 13.7, 24.0 and 4.5◦C, respectively. For a more detailed description of the
climate of the area see L ´opez-Urrea et al. (2006).
The soil is classified as Petrocalcic Calcixerepts (Soil Survey Staff, 2006). Average
soil depth of the experimental plot was 40 cm, and is limited by the development of 10
a more or less fragmented petrocalcic horizon. Texture is silty-clay-loam, with 13.4% sand, 48.9% silt and 37.7% clay, with a basic pH. The soil is low in organic matter and in nitrogen, and has a high content of active limestone and potassium.
To determine actual forage sorghum (Sorghum bicolor (L) Moench cv. H-133) ET, a
weighing lysimeter was used (Fig. 1b). To schedule irrigation ETc values were
calcu-15
lated from daily mass loss minus drainage loss and the mass added from irrigations and/or rainfall. In the lysimeter lost water was replaced, maintaining non-limiting soil
water content. The lysimeter is located in the center of a 100 m×100 m plot, where
sorghum sowed on 27 May in 2010 (DOY 147) in rows (N-S orientated) of 35-cm
spac-ing. Plant population was 21 plants m−2. Plant samples from three separate areas were
20
obtained periodically to measure crop development. Leaf area index (LAI), fractional
vegetation cover (Pv), and crop height (h) were measured from the three samples.
Sorghum reached a maximum crop height of nearly 5 m, a maximum LAI of 11 m2m−2,
and the final harvest dry matter was over 3 kg m−2. Field harvest was on 23 September
in 2010 (DOY 265). 25
The whole plot has a permanent sprinkler irrigation system with sprinklers placed
on a grid of 15×12.5 m that provide a precipitation rate of 8.6 mm h−1. The lysimeter
container is 2.7 m long, 2.3 m wide and 1.7 m deep, with an approximate total weight of
HESSD
8, 3937–3960, 2011Determining irrigation needs of
sorghum from two-source energy
J. M. S ´anchez et al.
Title Page
Abstract Introduction
Conclusions References
Tables Figures
◭ ◮
◭ ◮
Back Close
Full Screen / Esc
Printer-friendly Version Interactive Discussion
Discussion
P
a
per
|
Dis
cussion
P
a
per
|
Discussion
P
a
per
|
Discussio
n
P
a
per
|
14.5 Mg. Efforts were made to keep the crop inside the lysimeter at the same growth
rate and plant population (21 plants m−2
) as the crop outside to minimize edge effects.
The lysimeter soil-containing tank sits on a system of scales with a counterweight that
offsets the dead weight of the soil and the tank. The de-multiplication factor of the
system is 1000:1. A steel load cell (model SB2, Epelsa1Ind., S.L.) is connected to the
5
system of balances. The scales beams allow measurements of ET in the lysimeter with a resolution of 0.04 mm equivalent water depth. The sample frequency was 1 s, and a reading was registered by a datalogger (CR10X, Campbell Scientific Ltd., Logan, Utah, USA) every 15 min. Additional information about the technical features of the lysimeter may be found in L ´opez-Urrea et al. (2006). The lysimeter readings were checked daily 10
to identify individual readings that were not explained by natural processes of water input and loss. Data losses occurred during irrigation and precipitation events, weight and calibration verifications, and once, when the soil inside the lysimeter tank was cultivated. The resulting data was compiled to obtain the measurement of sorghum ET. Starting on 19 June (DOY 174), radiometric surface temperature was measured, 15
using an Apogee SI-211 thermal Infrared Radiometer (IRT). This radiometer has a
broad thermal band (6–14 µm) with an accuracy of±0.3◦C, and 28◦field of view. It was
placed at a height of 2 m above the canopy level at anytime, looking at the surface with nadir view (Fig. 1c, d). Sky brightness temperature was measured by a second Apogee
radiometer pointing at the sky with an angle of 53◦ (Rubio, 1998). These radiance
20
values were used for the atmospheric correction of the surface temperature. IRTs were calibrated before the experiment. The calibration was done using a blackbody source
(Model Land P80P). The calibration encompassed a wide range of temperatures (−5
to 50◦C), exceeding those experienced in the field. Unfortunately, measure of surface
temperature failed after 9 September (DOY 249), reducing our study period to 75 days. 25
HESSD
8, 3937–3960, 2011Determining irrigation needs of
sorghum from two-source energy
J. M. S ´anchez et al.
Title Page
Abstract Introduction
Conclusions References
Tables Figures
◭ ◮
◭ ◮
Back Close
Full Screen / Esc
Printer-friendly Version Interactive Discussion
Discussion
P
a
per
|
Dis
cussion
P
a
per
|
Discussion
P
a
per
|
Discussio
n
P
a
per
|
station placed over an irrigated fescue grass surface. Reference evapotranspiration,
ETo, was also determined using the FAO56 Penman-Monteith method (Allen et al.,
1998).
1Trade and company names are given for the benefit of the reader and imply no endorsement by the authors.
5
3 Model description
The net energy balance of the soil-canopy-atmosphere system is given by:
Rn=H+λET+G (1)
whereRn is the net radiation flux (W m−
2
), H is the sensible heat flux (W m−2), λET
is the latent heat flux (W m−2), andG is the soil heat flux (W m−2). Some other minor
10
terms such as photosynthesis, advection or canopy storage have been neglected in
Eq. (1). The effective radiometric surface temperature in the same system,TR(K), can
be obtained as a weighted composite of the soil temperature,Ts (K), and the canopy
temperature,Tc (K):
TR=
"
Pv(θ)εcT
4
c +(1−Pv(θ))εsT 4 s ε
#1/4
(2) 15
whereεc, and εs, are the canopy and soil emissivities, respectively,εis the effective
surface emissivity, andPv(θ) is the fractional vegetation cover for the viewing angleθ.
In this work, a Simplified version of a Two-Source configuration of the Energy Bal-ance (STSEB) (S ´anchez et al., 2008) was used. According to this approach, the ad-dition between the soil and canopy contributions (values per unit area of component) 20
to the total sensible heat flux,HsandHc, respectively, are weighted by their respective
partial areas as follows:
H=PvHc+(1−Pv)Hs (3)
HESSD
8, 3937–3960, 2011Determining irrigation needs of
sorghum from two-source energy
J. M. S ´anchez et al.
Title Page
Abstract Introduction
Conclusions References
Tables Figures
◭ ◮
◭ ◮
Back Close
Full Screen / Esc
Printer-friendly Version Interactive Discussion
Discussion
P
a
per
|
Dis
cussion
P
a
per
|
Discussion
P
a
per
|
Discussio
n
P
a
per
|
wherePv (without a view angle argument) refers to the fraction cover at nadir view (i.e.
θ=0o). In Eq. (3),HsandHc are expressed as:
Hc=ρCp
Tc−Ta
rah
(4a)
Hs=ρCp
Ts−Ta
raa+ras
(4b)
whereρCp is the volumetric heat capacity of air (J K−1m−3), T
a is the air temperature
5
at a reference height (K), rah is the aerodynamic resistance to heat transfer between
the canopy and the reference height at which the atmospheric data are measured
(m s−1), raa is the aerodynamic resistance to heat transfer between the point z0M+
d (z0M: canopy roughness length for momentum, d: displacement height) and the
reference height (m s−1),rasis the aerodynamic resistance to heat flow in the boundary
10
layer immediately above the soil surface (m s−1). A summary of the expressions to
estimate these resistances can be seen in S ´anchez et al. (2008). Equations (4a) and (4b) are taken from the parallel configuration of the TSEB model (Norman et al., 1995;
Li et al., 2005), modified to take into account the distinction betweenrahandr
a a.
The partitioning of the net radiation flux,Rn, between the soil and canopy is proposed
15
as follows:
Rn=PvRnc+(1−Pv)Rns (5)
whereRnc and Rns are the contributions (values per unit area of component) of the
canopy and soil, respectively, to the total net radiation flux. They are estimated by establishing a balance between the long-wave and the short-wave radiation separately 20
for each component:
HESSD
8, 3937–3960, 2011Determining irrigation needs of
sorghum from two-source energy
J. M. S ´anchez et al.
Title Page
Abstract Introduction
Conclusions References
Tables Figures
◭ ◮
◭ ◮
Back Close
Full Screen / Esc
Printer-friendly Version Interactive Discussion
Discussion
P
a
per
|
Dis
cussion
P
a
per
|
Discussion
P
a
per
|
Discussio
n
P
a
per
|
Rns=(1−αs)S+εsLsky−εsσTs4 (7)
whereS is the solar global radiation (W m−2),αs andαcare soil and canopy albedos,
respectively, σ is the Stefan-Boltzmann constant, and Lsky is the incident long-wave
radiation (W m−2).
A similar expression is used to combine the soil and canopy contributions,λETsand
5
λETc, respectively, to the total latent heat flux:
λET=PvλETc+(1−Pv)λETs (8)
According to this framework, a complete and independent energy balance between the atmosphere and each component of the surface is established, from the assumption that all the fluxes act vertically. In this way, the component fluxes to the total latent heat 10
flux can be written as:
λETc=Rnc−Hc (9)
λETs=Rns−Hs−
G (1−Pv)
(10)
Finally,Gcan be estimated as a fraction (CG) of the soil contribution to the net radiation
(Choudhury et al., 1987): 15
G=CG(1−Pv)Rns (11)
where CG can vary in a range of 0.2–0.5 depending on the soil type and moisture.
4 Results
4.1 Radiometric temperatures
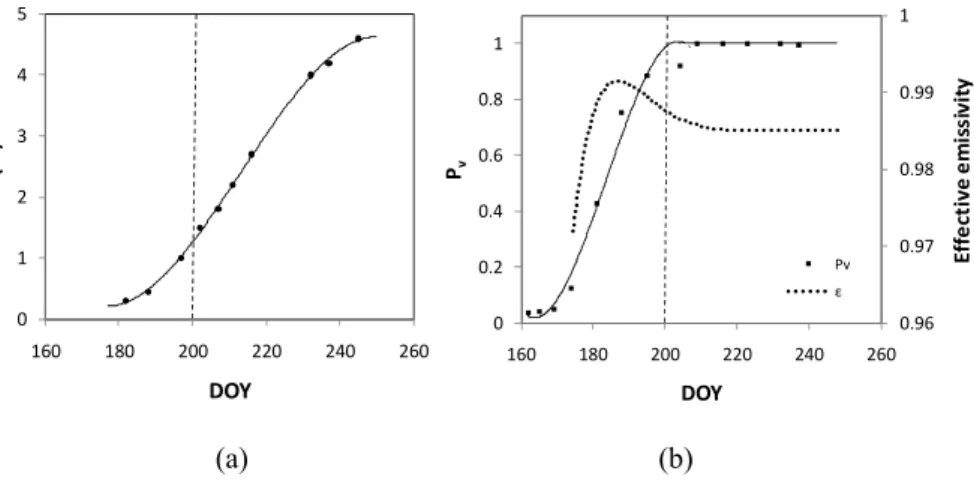
Growth cycle of the sorghum plants was captured by interpolation from the periodic 20
measurements taken over the course of the experiment. A third order regression equa-tion was used for the canopy height (Fig. 2a). For the fracequa-tion cover, measured values
HESSD
8, 3937–3960, 2011Determining irrigation needs of
sorghum from two-source energy
J. M. S ´anchez et al.
Title Page
Abstract Introduction
Conclusions References
Tables Figures
◭ ◮
◭ ◮
Back Close
Full Screen / Esc
Printer-friendly Version Interactive Discussion
Discussion
P
a
per
|
Dis
cussion
P
a
per
|
Discussion
P
a
per
|
Discussio
n
P
a
per
|
also fitted a third order equation forPv<1, whereas a constant value ofPv=1 was
as-sumed from DOY 200 to the end of the experiment (Fig. 2b). Under these conditions of full vegetation coverage the two-source scheme becomes a single-source approach, with the vegetation as the only component exchanging energy with the atmosphere.
Then,TR=Tcin Eq. (2), and transpiration is responsible of the total ET of the crop
sys-5
tem. Also, differences betweenTcandTaare less than 1◦C for non-stressed canopies,
which yields minor values for the sensible heat flux. Under these conditionsλET
be-comes the dominant flux in the right term of Eq. (1). Since soil temperature
measure-ments were not available in this study, for partial cover conditions we assumedTc∼Ta
andTswas inferred from Eq. (2) together with the measuredTRvalues.
10
Apogee IRT measurements were corrected for emissivity and atmospheric effect
us-ing the radiative transfer equation adapted to ground measurements (S ´anchez et al.,
2008). Values ofεc=0.985±0.011 andεs=0.960±0.013 were used for this study
(Ru-bio et al., 2003). Effective emissivity,ε, was calculated following the method proposed
by Valor and Caselles (1996) (see Fig. 2b). The downwelling long-wave radiance, re-15
quired for the atmospheric correction, was determined from the IRT values registered by the second Apogee pointing to the sky (Rubio, 1998). Thanks to the wide field of view of the Apogee radiometers, and the deployment configuration, sampled values of
TR, and estimated values ofTs, weighted for the sunlit and shaded portions of the two
components. 20
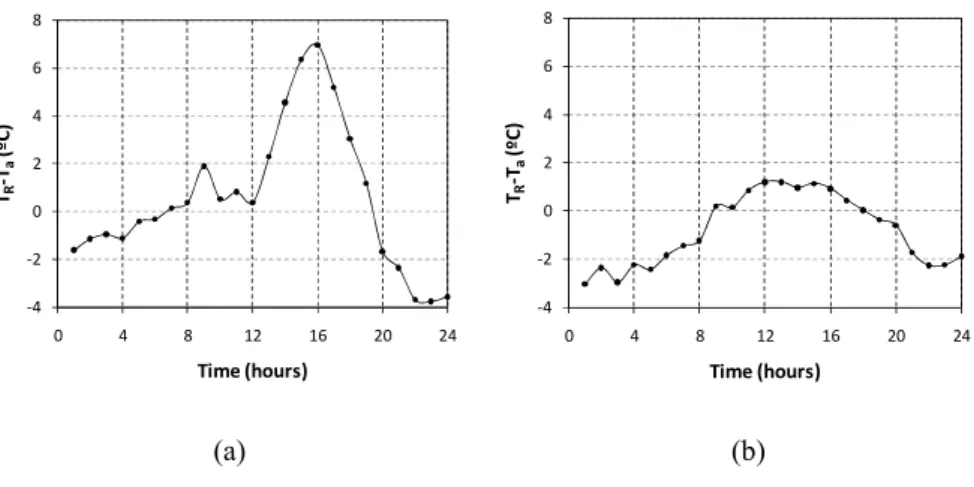
Figure 3 shows two examples of the diurnal evolution of the gradient TR–Ta, one
for intermediate vegetation cover when the soil component is still visible (DOY 185), and another for full cover conditions (DOY 236). Surface temperature was generally
warmer than air temperature during the middle of the day. This difference was
min-imum for full vegetation cover conditions (<1◦C), and increased with the amount of
25
soil exposed (Fig. 3). Irrigation was scheduled according to the water loss determined by the lysimeter throughout the growing season to ensure enough water availability for transpirational cooling, avoiding plant water-stress and then warming of the canopy
HESSD
8, 3937–3960, 2011Determining irrigation needs of
sorghum from two-source energy
J. M. S ´anchez et al.
Title Page
Abstract Introduction
Conclusions References
Tables Figures
◭ ◮
◭ ◮
Back Close
Full Screen / Esc
Printer-friendly Version Interactive Discussion
Discussion
P
a
per
|
Dis
cussion
P
a
per
|
Discussion
P
a
per
|
Discussio
n
P
a
per
|
cooler than air temperature. This difference was even higher for rainfall or irrigation
events. These temperature gradients control the exchange of H between the surface
and the atmosphere, adding or reducing energy to the availableRn.
4.2 Modelled ET
Surface temperature was used, together with registered solar radiation and down-5
welling long-wave radiation, to calculate Rn from Eqs. (5) and (6). Values 0.13 and
0.23 (Castrignan `o et al., 1997) were used for the soil and canopy albedo, respectively, although possible changes in albedo are possible. Wind speed measurements from the adjacent weather station were used to calculate the aerodynamic resistances required in Eqs. (3) and (4). These resistances together with the surface and air temperature 10
data yielded H results. A value of CG=0.2 was assumed in Eq. (9) to estimate G
values.
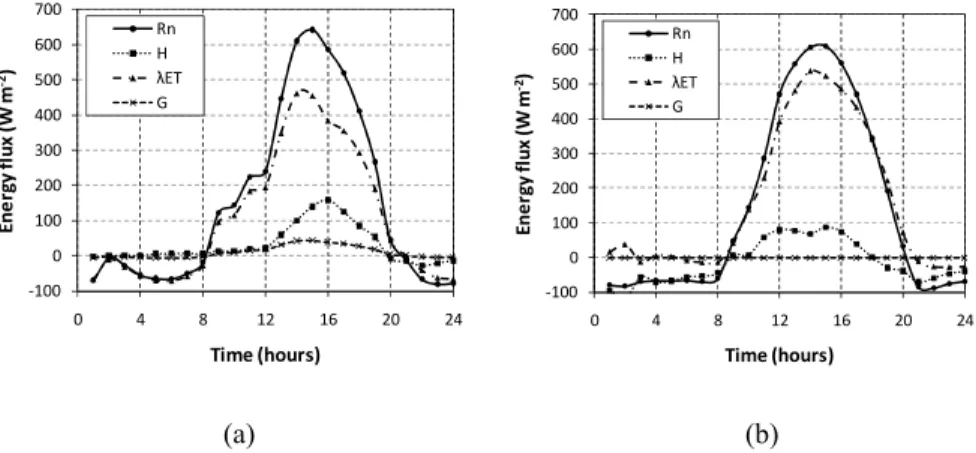
Figure 4 shows hourly values of all flux components in Eq. (1). Note that, as a
residual of the EBE,λET is principally controlled byRn and modulated by H. For our
study period most available energy was partitioned toλET. H was the dominant term for
15
first weeks after planting, when the fraction cover was still very low, but unfortunately
measure ofTRstarted on DOY 174 and data are not available for that period.
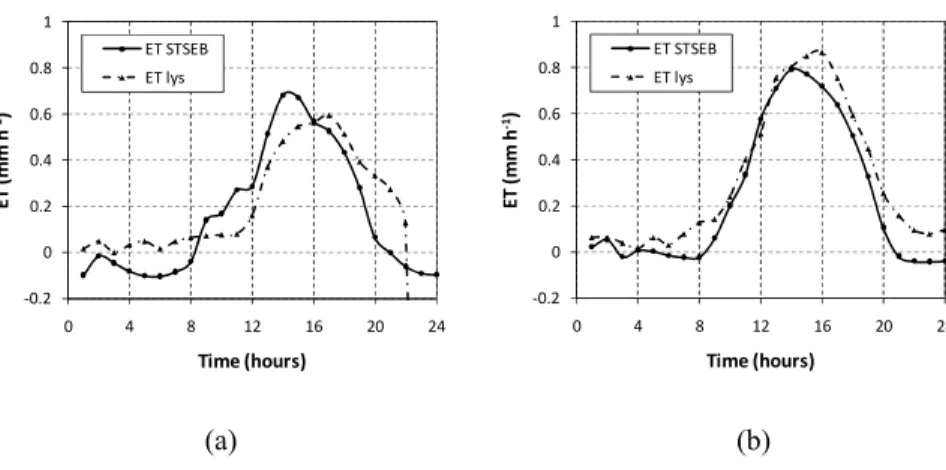
Values of latent heat flux were converted in ET values, dividing by the latent heat of
vaporization,λ, and compared to ET water loss registered by the lysimeter. Figure 5
shows two examples of the diurnal evolution of these hourly ET values. STSEB es-20
timations of ET matches the measured ET values under a wide range of vegetation cover fractions. Note that energy balance models yield ET values also under rainfall or irrigation conditions when the lysimeter measure is compromising.
Since night-time ET was generally negligible, hourly averages between 7 and 21 h were used for the quantitative test of the STSEB model. With this filtering we tried to 25
avoid events such as irrigation (around midnight) or early morning dew. Rainfall events were also excluded from the hourly analysis. More than 1000 single observations were used for the comparison of the diurnal ET values (Fig. 6a). Besides the linear
HESSD
8, 3937–3960, 2011Determining irrigation needs of
sorghum from two-source energy
J. M. S ´anchez et al.
Title Page
Abstract Introduction
Conclusions References
Tables Figures
◭ ◮
◭ ◮
Back Close
Full Screen / Esc
Printer-friendly Version Interactive Discussion
Discussion
P
a
per
|
Dis
cussion
P
a
per
|
Discussion
P
a
per
|
Discussio
n
P
a
per
|
regression, the accuracy of prediction was quantified using the Root Mean Square Deviation (RMSD) between estimated and measured ET values. The systematic devi-ation was illustrated by the biased estimator (Bias), and the relative error by the Mean
Absolute Percentage Difference (MAPD) (Willmott, 1982). STSEB model reproduced
lysimeter hourly ET measurements with negligible systematic deviation, and a RMSD 5
of 0.14 mm h−1.
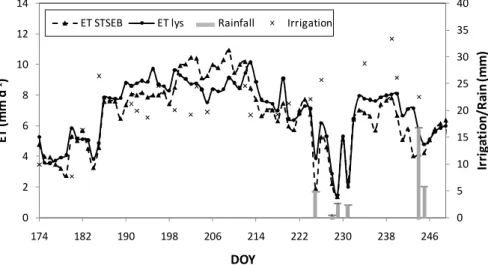
Beyond the performance of a model at an instantaneous scale, what is really impor-tant from the point of view of the irrigation planning or the water saving is the capacity of a model to predict daily ET values, and further cumulative water loss by evapotranspi-ration. Figure 7 shows the evolution of the daily ET values modelled and measured for 10
the experiment duration. For a first stage, when the energy balance was still influenced by the exposed soil surrounding the sorghum plants, the average trend of daily ET was to increase with the vegetation fraction cover. Daily ET peaked by middle July, with
values reaching 10 mm d−1
, and then decreased until beginning of September. Lowest
daily ET values, close to 2 mm d−1, were observed for some cloudy and rainy days
15
by middle August. A total of 73 days were used for the quantitative comparison, with the only exclusion of rainy days with registered rainfall amounts over 5 mm. Modelled
values underestimated 0.3 mm d−1lysimeter daily ET measurements, with a RMSD of
±1.0 mm d−1 (Fig. 6b). A similar RMSD value of±0.9 mm d−1and underestimation of
6% was observed when daily ET values were calculated using the standard FAO56 20
methodology (Allen et al., 1998).
These results are in agreement with some recent works. For instances, Kato and
Kamichika (2006) used a dual crop coefficient to estimate ET in a sorghum field.
Comparison with Bowen Ratio energy balance method showed a RMSD value of 0.84 mm d−1.
25
HESSD
8, 3937–3960, 2011Determining irrigation needs of
sorghum from two-source energy
J. M. S ´anchez et al.
Title Page
Abstract Introduction
Conclusions References
Tables Figures
◭ ◮
◭ ◮
Back Close
Full Screen / Esc
Printer-friendly Version Interactive Discussion
Discussion
P
a
per
|
Dis
cussion
P
a
per
|
Discussion
P
a
per
|
Discussio
n
P
a
per
|
period, the total rainfall registered was 33 mm, and a total irrigation of 506 mm was applied. Thus, cumulative ET predicted by the STSEB model underestimated 5% the lysimeter register.
These results illustrate the ability of surface temperature together with energy bal-ance to predict both short-term and long-term ET rates, and then to determine crop 5
water necessity and schedule crop irrigation. This study will be further completed with the application to other energetic crops such as sunflower and maize.
5 Conclusions
This work was motivated by an increasing production of energetic crops in semi-arid regions and the need to determine their water requirements. This study focused on 10
the evaluation of a two-source energy model to estimate crop water necessities from radiometric temperature information in a forage sorghum field. Two IRT radiometers were used, together with meteorological data, to run the STSEB model. Measurements in a weighing lysimeter were used to test modelled ET values at both, hourly and daily
scales. For a variety of Pv conditions, sorghum ET predictions were generally good,
15
and even both very high and very low ET values were quite well predicted by the model. Average errors of 22 and 12% were obtained for hourly and daily ET values, respectively, and total cumulated ET for the study period was a 5% underestimated.
These results confirm STSEB model as an alternative to water balance techniques to determine short-term and long-term accurate actual evapotranspiration. The pre-20
sented methodology could be then used to estimate ground-truth ET values, as an alternative to weighing lysimeters, required to determine irrigation needs or to calibrate
crop coefficient based algorithms.
Acknowledgements. This work has been funded by the Spanish Science and Innovation
Min-istry (projects AGL2009-13124, CGL2010-17577, and CSD2008-00040, and Juan de la Cierva
25
contract of J. M. S ´anchez), Generalitat Valenciana (project PROMETEO/2009/086) and the JCCM (projects PEIC11-0170-8185 and PPII10-0319-8732). The authors would like to thank
HESSD
8, 3937–3960, 2011Determining irrigation needs of
sorghum from two-source energy
J. M. S ´anchez et al.
Title Page
Abstract Introduction
Conclusions References
Tables Figures
◭ ◮
◭ ◮
Back Close
Full Screen / Esc
Printer-friendly Version Interactive Discussion
Discussion
P
a
per
|
Dis
cussion
P
a
per
|
Discussion
P
a
per
|
Discussio
n
P
a
per
|
the logistical support in operating and maintaining the instrumentation of Laura Mart´ınez, Angel Garc´ıa and Miguel G ´omez.
References
Allen, R. G., Pereira, L. S., Raes, D., and Smith, M.: Crop evapotranspiration: guidelines for computing crop water requirements, in: Proceedings of the Irrigation and Drainage Paper
5
No. 56, Food and Agricultural Organization, United Nations, Rome, 1998.
Alvarez, M. M., P ´erez-Carrillo, E., and Serna-Sald´ıvar, S. O.: Effect of decortication and pro-tease treatment on the kinetics of liquefaction, saccharification, and ethanol production from sorghum, J. Chem. Technol. Biot., 85, 1122–1129, 2010.
Bashir, M. A., Hata, T., Tanakamaru, H., Abdelhadi, A. W., and Tada, A.: Satellite-based energy
10
balance model to estimate seasonal evapotranspiration for irrigated sorghum: a case study from the Gezira scheme, Sudan, Hydrol. Earth Syst. Sci., 12, 1129–1139, doi:10.5194/hess-12-1129-2008, 2008.
Bastiaanssen, W. G. M., Menenti, M., Feddes, R. A., and Holtslag, A. A. M.: A remote sensing surface energy balance algorithm for land (SEBAL): 1. Formulation, J. Hydrol., 212–213,
15
198–212, 1998.
Castrignan `o, A., Di Bari, V., and Stelluti, M.: Evapotranspiration predictions of CERES-Sorghum model in Southern Italy, Eur. J. Agron., 6, 265–274, 1997.
Choudhury, B. J. and Idso, S. B.: Evaluating plant and canopy resistances of field grown wheat from concurrent diurnal observations of leaf water potential, stomatal resistance, canopy
20
temperature, and evapotranspiration flux, Agric. For. Meteorol., 34, 67–76, 1985.
Choudhury, B. J., Idso, S. B., and Reginato, R. J.: Analysis of an empirical model for soil heat flux under a growing wheat crop for estimating evaporation by an infrared-temperature based energy balance equation, Agric. For. Meteorol., 39, 283–297, 1987.
Faver, K. L. and O’toole, J. C.: Short-term estimation of sorghum evapotranspiration from
25
canopy temperature, Agric. For. Meteorol, 48, 175–183, 1989.
Gardner, B. R., Nielsen, D. C., and Shock, C. C.: Infrared thermometry and the crop water-stress index:1. History, theory, and base-lines, J. Prod. Agric., 5(4), 462–466, 1992.
mea-HESSD
8, 3937–3960, 2011Determining irrigation needs of
sorghum from two-source energy
J. M. S ´anchez et al.
Title Page
Abstract Introduction
Conclusions References
Tables Figures
◭ ◮
◭ ◮
Back Close
Full Screen / Esc
Printer-friendly Version Interactive Discussion
Discussion
P
a
per
|
Dis
cussion
P
a
per
|
Discussion
P
a
per
|
Discussio
n
P
a
per
|
suring latent heat flux in a semiarid advective environment, Irrigation Sci., 25, 127–140, 2007.
Hall, F., Huemmrich, K., Goetz, S., Sellers, P., and Nickerson, J.: Satellite remote sensing of surface energy balance: Success, failures and unresolved issues in FIFE, J. Geophys. Res., 97, 19061–19089, 1992.
5
Hatfield, J. L., Perrier, A., and Jackson, R. D.: Estimation of evapo-transpiration at one time-of-day using remotely sensed surface temperatures, Agr. Water Manage., 7(1–3), 341–350, 1983.
Jackson, R. D., Idso, S. B., Reginato, R. J., and Pinter, P. J.: Canopy temperature as a crop water stress indicator, Water Resour. Res., 17, 1133–1138, 1981.
10
Jackson, R. D., Hatfield, J. L., Reginato, R. J., Idso, S. B., and Pinter, P. J.: Estimation of evapotranspiration from one time-of day measurements, Agric. Water Manage., 7, 351–362, 1983.
Kato, T. and Kamichika, M.: Determination of a crop coefficient for evapotranspiration in a sparse sorghum field, Irrig. Drain., 55, 165–175, 2006.
15
Kustas, W. P. and Norman, J. M.: Use of remote sensing for evapotranspiration monitoring over land surfaces, Hydrolog. Sci. J., 41(4), 495–516, 1996.
L ´opez-Urrea, R., Mart´ın de Santa Olalla, F., Fabeiro, C., and Moratalla, A.: Testing evapotran-spiration equations using lysimeter observations in a semiarid climate, Agric. Water Manage., 85, 15–26, 2006.
20
L ´opez-Urrea, R., Mart´ın de Santa Olalla, F., Montoro, A., and L ´opez-Fuster, P.: Single and dual crop coefficients and water requirements for onion (Allium cepa L.) under semiarid condi-tions, Agric. Water Manage, 96(6), 1031–1036, 2009a.
L ´opez-Urrea, R., Montoro, A., L ´opez-Fuster, P., and Fereres, E.: Evapotranspiration and re-sponses to irrigation of broccoli, Agric. Water Manage., 96(9), 1155–1161, 2009b.
25
L ´opez-Urrea, R., Montoro, A., Gonz ´alez-Piqueras, J., L ´opez-Fuster, P., and Fereres, E.: Water use of spring wheat to raise water productivity, Agric Water Manage., 96, 1305–1310, 2009c. Li, F., Kustas, W. P., Prueger, J. H., Neale, C. M. U., and Jackson, T. J.: Utility of Remote
Sens-ing based two-source energy balance model Ander low and high vegetation cover conditions, J. Hydrometeorol., 6(6), 878–891, 2005.
30
Montoro, A., L ´opez-Fuster, P., and Fereres, E.: Improving on-farm water management through an irrigation scheduling service, Irrigation Sci., doi:10.1007/s00271-010-0235-3(online), 2010.
HESSD
8, 3937–3960, 2011Determining irrigation needs of
sorghum from two-source energy
J. M. S ´anchez et al.
Title Page
Abstract Introduction
Conclusions References
Tables Figures
◭ ◮
◭ ◮
Back Close
Full Screen / Esc
Printer-friendly Version Interactive Discussion
Discussion
P
a
per
|
Dis
cussion
P
a
per
|
Discussion
P
a
per
|
Discussio
n
P
a
per
|
Marek, T. H., Schneider, A. D., Howell, T. A., and Ebeling, L. L.: Design and construction of large weighing monolithic lysimeters, Trans. ASAE, 31(2), 477–484, 1998.
Norman, J. M., Kustas, W., and Humes, K.: A two-source approach for estimating soil and vegetation energy fluxes from observations of directional radiometric surface temperature, Agric. For. Meteorol, 77, 263–293, 1995.
5
Piccini, G., Ko, J., Marek, T., and Howell, T.: Determination of growth-stage-specific crop coef-ficient (kc) of maize and sorghum, Agric. Water Manage., 96, 1698–1704, 2009.
Pinter, P. J., Hatfield, J. L., Shepers, J. S., Barnes, E. M., Moran, M. S, Daughtry, C. S. T., and Upchurch, D. R.: Remote sensing for crop management, Photogramm. Eng. Rem. S., 69(6), 647–664, 2003.
10
Rubio, E.: Optimising the remote sensing measurement of temperature and emissivity, Ph D. Thesis, University of Valencia, 272 pp., 1998.
Rubio, E., Caselles, V., Coll, C., Valor, E., and Sospedra, F.: Thermal infrared emissivities of natural surfaces: Improvements on the experimental set-up and new measurements, Int. J. Remote Sens., 20(24), 5379–5390, 2003.
15
S ´anchez, J. M., Kustas, W. P., Caselles, V., and Anderson, M.: Modelling surface energy fluxes over maize using a two-source patch model and radiometric soil and canopy temperature observations, Remote Sens. Environ., 112, 1130–1143, 2008.
S ´anchez, J. M., Caselles, V., Nicl `os, R., Coll, C., and Kustas, W. P.: Estimating energy balance fluxes above a boreal forest from radiometric temperature observations, Agric. For. Meteorol.,
20
149, 1037–1049, 2009.
Su, Z.: The Surface Energy Balance System (SEBS) for estimation of turbulent heat fluxes, Hydrol. Earth Syst. Sci., 6, 85–100, doi:10.5194/hess-6-85-2002, 2002.
Valor, E. and Caselles, V.: Mapping Land Surface Emissivity from NDVI: Application to Euro-pean, African, and South American Areas, Remote Sens. Environ., 57, 167–184, 1996.
25
HESSD
8, 3937–3960, 2011Determining irrigation needs of
sorghum from two-source energy
J. M. S ´anchez et al.
Title Page
Abstract Introduction
Conclusions References
Tables Figures
◭ ◮
◭ ◮
Back Close
Full Screen / Esc
Printer-friendly Version Interactive Discussion
Discussion
P
a
per
|
Dis
cussion
P
a
per
|
Discussion
P
a
per
|
Discussio
n
P
a
per
|
(a) (b)
Sorghum lysimeter
Reference lysimeter
(c) (d)
Fig. 1. (a)Location of the experimental site.(b)Lysimeter placed in the center of the sorghum field (picture from DOY 147). (c) Experimental assembly of the two Apogee IRTs over the incipient sorghum (picture from DOY 172). (d)Nadir view of the developed sorghum (picture from DOY 196).
HESSD
8, 3937–3960, 2011Determining irrigation needs of
sorghum from two-source energy
J. M. S ´anchez et al.
Title Page
Abstract Introduction
Conclusions References
Tables Figures
◭ ◮
◭ ◮
Back Close
Full Screen / Esc
Printer-friendly Version Interactive Discussion
Discussion
P
a
per
|
Dis
cussion
P
a
per
|
Discussion
P
a
per
|
Discussio
n
P
a
per
|
(a) (b)
0 1 2 3 4 5
160 180 200 220 240 260
h
(
m
)
DOY
0.96 0.97 0.98 0.99 1
0 0.2 0.4 0.6 0.8 1
160 180 200 220 240 260
E
ff
e
ct
iv
e
e
m
is
si
v
it
y
Pv
DOY
Pv ε
HESSD
8, 3937–3960, 2011Determining irrigation needs of
sorghum from two-source energy
J. M. S ´anchez et al.
Title Page
Abstract Introduction
Conclusions References
Tables Figures
◭ ◮
◭ ◮
Back Close
Full Screen / Esc
Printer-friendly Version Interactive Discussion
Discussion
P
a
per
|
Dis
cussion
P
a
per
|
Discussion
P
a
per
|
Discussio
n
P
a
per
|
(a) (b)
-4 -2 0 2 4 6 8
0 4 8 12 16 20 24
TR -Ta
(º
C
)
Time (hours)
-4 -2 0 2 4 6 8
0 4 8 12 16 20 24
TR -Ta
(º
C
)
Time (hours)
Fig. 3. Diurnal evolution of the gradient between sorghum radiometric temperature and air temperature:(a)DOY 185,(b)DOY 236.
HESSD
8, 3937–3960, 2011Determining irrigation needs of
sorghum from two-source energy
J. M. S ´anchez et al.
Title Page
Abstract Introduction
Conclusions References
Tables Figures
◭ ◮
◭ ◮
Back Close
Full Screen / Esc
Printer-friendly Version Interactive Discussion
Discussion
P
a
per
|
Dis
cussion
P
a
per
|
Discussion
P
a
per
|
Discussio
n
P
a
per
|
2
(a) (b)
3
-100 0 100 200 300 400 500 600 700
0 4 8 12 16 20 24
E
n
e
rg
y
f
lu
x
(
W
m
-2)
Time (hours) Rn
H λET G
-100 0 100 200 300 400 500 600 700
0 4 8 12 16 20 24
E
n
e
rg
y
f
lu
x
(
W
m
-2)
Time (hours) Rn
H λET G
EB
lys
EB
lys
HESSD
8, 3937–3960, 2011Determining irrigation needs of
sorghum from two-source energy
J. M. S ´anchez et al.
Title Page
Abstract Introduction
Conclusions References
Tables Figures
◭ ◮
◭ ◮
Back Close
Full Screen / Esc
Printer-friendly Version Interactive Discussion
Discussion
P
a
per
|
Dis
cussion
P
a
per
|
Discussion
P
a
per
|
Discussio
n
P
a
per
|
8
(a) (b)
9
-0.2 0 0.2 0.4 0.6 0.8 1
0 4 8 12 16 20 24
E
T
(
m
m
h
-1)
Time (hours) ET STSEB
ET lys
-0.2 0 0.2 0.4 0.6 0.8 1
0 4 8 12 16 20 24
E
T
(
m
m
h
-1)
Time (hours) ET STSEB
ET lys
Fig. 5. Diurnal evolution of the estimated and measured sorghum ET:(a)DOY 185,(b)DOY 236.
HESSD
8, 3937–3960, 2011Determining irrigation needs of
sorghum from two-source energy
J. M. S ´anchez et al.
Title Page
Abstract Introduction
Conclusions References
Tables Figures
◭ ◮
◭ ◮
Back Close
Full Screen / Esc
Printer-friendly Version Interactive Discussion
Discussion
P
a
per
|
Dis
cussion
P
a
per
|
Discussion
P
a
per
|
Discussio
n
P
a
per
|
(a) (b)
y = 1.09x - 0.05 r² = 0.848 Bias= -0.004 RMSD= 0.14 MAPD= 0.22
-0.2 0 0.2 0.4 0.6 0.8 1 1.2 1.4
-0.2 0 0.2 0.4 0.6 0.8 1 1.2 1.4
E
T
E
B
E
(
m
m
h
-1)
ET lys (mm h-1)
y = 1.00x - 0.3 r² = 0.794 Bias= -0.3 RMSD= 1.03 MAPD= 0.12
0 2 4 6 8 10 12
0 2 4 6 8 10 12
E
T
E
B
E
(
m
m
d
-1)
ET lys (mm d-1)
Fig. 6. Modelled (STSEB) versus measured (lys) sorghum evapotranspiration: (a)hourly val-ues,(b)daily values. Results of the linear regression fit, together with the main statistics of the comparison (Bias, RMSD, and MAPD), are also included.
HESSD
8, 3937–3960, 2011Determining irrigation needs of
sorghum from two-source energy
J. M. S ´anchez et al.
Title Page
Abstract Introduction
Conclusions References
Tables Figures
◭ ◮
◭ ◮
Back Close
Full Screen / Esc
Printer-friendly Version Interactive Discussion
Discussion
P
a
per
|
Dis
cussion
P
a
per
|
Discussion
P
a
per
|
Discussio
n
P
a
per
|
0 5 10 15 20 25 30 35 40
0 2 4 6 8 10 12 14
174 182 190 198 206 214 222 230 238 246
Ir
ri
g
a
ti
o
n
/R
a
in
(
m
m
)
E
T
(
m
m
d
-1)
DOY
ET STSEB ET lys Rainfall Irrigation
Fig. 7.Evolution of the sorghum daily ET values modelled (STSEB) and measured (lys) for the experiment duration. Rainfall and irrigation water quantities are also plotted.
HESSD
8, 3937–3960, 2011Determining irrigation needs of
sorghum from two-source energy
J. M. S ´anchez et al.
Title Page
Abstract Introduction
Conclusions References
Tables Figures
◭ ◮
◭ ◮
Back Close
Full Screen / Esc
Printer-friendly Version Interactive Discussion
Discussion
P
a
per
|
Dis
cussion
P
a
per
|
Discussion
P
a
per
|
Discussio
n
P
a
per
|
0 100 200 300 400 500 600
174 186 198 210 222 234 246
C
u
m
u
la
ti
v
e
E
T
(
m
m
)
DOY
ET STSEB ET lys
Irrigation/Rainfall