Corresponding author: Norma-Aurea Rangel-Vazquez, Departamento de Metal Mecánica del Instituto Tecnológico de Aguascalientes, Ave. López Mateos # 1801 Ote. Fracc. Bona Gens CP. 20256 Aguascalientes, México, e-mail: [email protected]
Spectroscopy Analyses of Polyurethane/Polyaniline
IPN Using Computational Simulation
(Amber, MM+ and PM3 Method)
Norma-Aurea Rangel-Vazquez, Carlos Sánchez-López
Departamento de Metal Mecánica, Instituto Tecnológico de Aguascalientes, México
Francisco Rodríguez Felix
Departamento de Investigación y Posgrado en Alimentos, Universidad de Sonora, México
Abstract: The polyurethane (PU)/polyaniline (PANI) IPN, at three composition ratios (95/05, 75/25, 60/40), were analyzed, after the action of the urease enzyme, by means of the Hyperchem 8v software. Theoretical analysis of Gibbs free energy, FTIR, and 13C-NMR were done. The generation of functional groups due to hydrolysis was analyzed by
FTIR. The 13C-NMR spectra of the three ratios showed a superposition of the individual spectra of PU and PANI and
an appreciable decrease of the signals due to the action of the urease enzyme. The orbits showed that the electron density of the HOMO (Highest Occupied Molecular Orbital) is predominantly localized on the C-C bond, indicating that the binding of PU/PANI with the urease enzyme contains a vacant d-orbital. It is concluded that the adsorption of the urease enzyme increases the degree of hydrolysis of the IPN.
Keywords: PU, PANI, Hyperchem 8v.
Introduction
Polymers are known to have good insulating properties and are among the most used materials in the modern world. However, it has been discovered that there are some polymers which have conducting properties[1-3]. There are at least four major classes of
semiconducting polymers that have been developed so far. They include conjugated conducting polymers, charge transfer polymers, ionic conducting polymers and conductive filled polymers[4,5]. The potential uses for
conductive filled polymers have since been multiplied due to their ease of processing, good environmental stability and wide range of electrical properties[6].
Conducting polymers are polymer materials with metallic and semiconductor characteristics, a combination of properties not exhibited by any other known material. A principal property of a conductive polymer is the presence of conjugated double bonds along the backbone of the polymer. In conjugation, the bonds between the carbon atoms are alternating single and double. Since the electrons in a conjugated system are only loosely bound, electron flow may be possible. Every bond contains a localized “σ” bond which forms a strong chemical bond. In addition, every double bond also contains a less strongly localized “π” bond which is weaker. These enable the electrons to be delocalized over the whole system, and then be shared by many atoms. This means that this kind of electrons may move around the whole system. However, conjugation is not enough to make the polymer material conductive[7-10].
In addition, the polymer material needs to be doped for electron flow to occur. Doping is either the addition of electrons (reduction reaction) or the removal of electrons (oxidation reaction) from the polymer. An oxidation doping (removal of electrons) can be done using iodine.
The iodine attracts an electron from the polymer from one of the bonds. Once doping has occurred, the electrons in the bonds are able to “jump” around the polymer chain. As the electrons are moving along the molecule, electric current occurs. For better conductivity the molecules must be well ordered and closely packed to limit the distance “jumped” by the electrons. The conductivity of conducting polymers can be tuned by chemical manipulation of the polymer backbone, by the nature of the dopant, by the degree of doping, and by blending with other polymers[1,2,11].
PANI is a kind of intrinsically conducting polymer consisting of phenylenediamine (PPD) and quinonediimine structure as shown in Figure 1[12-16]. The
morphology of PANI, granular or tubular, depends on the acidity conditions during the reaction rather than on the chemical structure of the acid[17]. Like many other
conducting polymers, PANI is not soluble in common organic solvents because of the stiffness of its backbone and hydrogen bonding interaction between adjacent chains. Improving the processability of PANI, has made possible its use in many applications as electrodes, biosensors, batteries, anti-static coatings, gas sensors, membranes and light emitting diodes[12,18-22].
PANI has resonance structures that resemble the aromatic or quinoid forms. In its neutral state the polymer is not conductive, they become conductive only in the oxidized state and have a conductivity of 101(Ω cm)–1
for PANI, respectively. The charge associated with the oxidized state is typically delocalized over several units of this polymer and can form a radical cation (polaron) or a dication (bipolaron). The introduction of charge to the chain can transform the aromatic structure in to the lower band gap quinoid structure[23].
T
E
C
H
N
I
C
A
L
N
O
T
E
The majority of polymers selected to prepare PANI composites is insulating polymeric materials with excellent physical properties, such as rubber, plastic and textile. Many papers dealing with the preparation of the rubber–PANI, plastic–PANI, and others have been published[24]. The reason why PU is chosen is
due to its balanced flexibility and hardness, good film forming property and resistance to solvent. Moreover, the interaction between NH in PANI and NHCOO in PU may be a bonus to improve the compatibility of the system.
The strong tendency of PANI and PU to form hydrogen bonding has been verified by Luo et al. and Rangel-Vázquez et al. through different spectroscopic techniques, which was believed to be responsible for a certain degree of phase mixing in PANI/PU blend[12,25].
In the characterization of PANI filled PU/PMMA interpenetrating network system, Luo et al. and Wang et al. mentioned that the hydrogen bonding formation between NH of PANI and NHCOO group of PU/PMMA polymer network had some effect on the physical, mechanical, electrical as well as thermal properties of the conductive IPN, also suggested that the interaction between the carboxyl groups in PU and imine groups in PANI could induce miscibility of PANI/ PU blends[12,26]. The combination of PANI segments with
blocks of another polymer has been recently reported, such as the grafting of polyethylene glycol or polyacrylic acid onto a PANI backbone, and a block copolymer consisting of PU and PANI oligomer, etc. The use of a thermoplastic elastomer with conducting polymers is very attractive due to the combination of mechanical properties and a processability which does not require vulcanization[25,27].
Enzymes exhibit a number of features that make them as advantageous as compared to conventional chemical catalysts. Foremost among them are a high level of catalytic efficiency, often far superior to chemical catalysts, and a high degree of specificity that allows them to discriminate not only between reactions but also between substrates (substrate specificity), similar parts of molecules (regiospecificity) and between optical isomers (stereospecificity). The enzymatic hydrolysis is a heterogeneous process that is affected by the mode of interaction between the enzymes and the polymeric chains and involves typically four steps: (1) diffusion of
the enzyme from the bulk solution to the solid surface, (2) adsorption of the enzyme on the substrate, resulting in the formation of the enzyme–substrate complex, (3) catalysis of the hydrolysis reaction, and (4) diffusion of the soluble degradation products from the solid substrate to the solution.
The rate of the global reaction is controlled by the slowest step. The enzymatic hydrolysis of solid substrates are normally characterized by an enzyme saturation point; in this enzyme concentration, no further increase in the degradation rate is observed when more enzymes are added. This has been attributed to a decrease in the exposed polymer surface as the enzyme molecules saturate the surface, and appears to be limiting the progress of degradation of some biomaterials[28,29].
Quantum mechanical calculations have extensively been used to study the energetics of simple chemical reactions and to understand the electrostatic interactions between compounds. Their application to polymeric systems, until very recently was not available. This was mainly due to very large numbers of atoms in polymeric structures requiring powerful computers and very long computer times. With advances in both computer and software technology, now it is possible to do quantum mechanical calculations or precise simulations on polymeric systems[30]. In this work, the computational
analysis was applied to PU, PANI and PU/PANI (3 ratios), where Gibbs free energy, FTIR, 13C-NMR, and
molecular orbitals were calculated after the action of the urease enzyme.
Experimental Section
Methods
Since sketching often creates the structure in a high energy configuration, and starting a simulation from a such unoptimized structure can lead to erroneous simulation results, after it has been sketched, it is necessary to carry out the geometry optimization or energy minimization of the system being examined. In this work three aspects were considered for selection of geometry optimization method and algorithm: system size, convergence level and force field used. Next a minimization algorithm is chosen to find the potential energy minimum corresponding to the lowest energy structure. Iteration number and convergence level lead optimal structure.
The geometry optimization (Amber, MM+ and PM3 method, respectively) was calculated by means of the Polak-Ribiere algorithm with a gradient of 0.001 Kcal/(Å mol) in vacuum, 1 spin multiplicity, convergence limit of 0.001, and 1000 iteration limits. Table 1 shows the urease enzyme properties.
Table 1. Properties of urease enzyme.
Name Enzyme Source Reaction
temperature
pH Mw Purity
Urease Hydrolase Bean 25 °C 8 162.000 g/mol 80%
Figure 1. Structure of PANI (white: hydrogen, blue: carbon and
FTIR
The infrared spectrum is commonly obtained by passing infrared electromagnetic radiation through a sample that possesses a permanent or induced dipole moment and determining what fraction of the incident radiation is absorbed at a particular energy. In an absorption spectrum, the energy of each peak corresponds to the frequency of the vibration of a molecule part, thus allowing qualitative identification of certain bond types in the sample. The FTIR was obtained by first selecting menu compute, vibrational and rotational options. Once completed this analysis, using the vibrational option, the FTIR spectrum pattern is obtained for two methods of analysis[31]. Tables 2 and 3 show the experimental values
of PU and PANI, respectively.
2.4 Electrostatic potential
After obtaining a Gibbs free energy or geometry optimization using different methods, we can plot two-dimensional contour diagrams of the electrostatic potential surrounding a molecule, the total electronic density, the spin density, one or more molecular orbitals, and the electron densities of individual orbitals. When you select the appropriate option, in the Contour plot dialog box, Hyperchem software displays the electrostatic potential as a contour plot. Choose the values for the starting contour and the contour increment so that you can observe the minimum (typically about –0.5 for polar organic molecules) and so that the zero potential line appears.
A menu plot molecular graph, the electrostatic potential property is selected and then the 3D representation mapped isosurface for both methods of analysis. Atomic charges indicate where large negative values (sites for electrophilic attack) are likely to occur. However, the largest negative value of the electrostatic potential is not necessarily adjacent to the atom with the largest negative charge[31].
2.2 Quantum chemical calculations
To understand the hydrolysis of different PU/PANI ratios, after hydrolysis reaction with urease enzyme, the molecular electronic structure calculations have been performed. These calculations yielded HOMO and LUMO (Lowest Unoccupied Molecular Orbital) energies. Among quantum chemical methods, the Density functional theory (DFT) is found to be a suitable method for our calculations.
All the calculations were performed using Amber, MM+ and PM3 method. Although the three semi-empirical parameters are optimized primarily to reproduce thermo-chemistry of small organic molecules, it has been proven to perform exceptionally well for relatively large organic molecules of heteroatoms.
Results and Discussions
The geometry optimization was used to locate a minimum of energy, on the surface, of the potential energy surface, and get the balance structure of a molecular system. Using the Hyperchem 8v software, by means of the Amber, MM+ and PM3 method, with the Polak-Ribiere algorithm was possible calculate the Gibbs free energy (∆G)of PU and PANI (see Table 6), where
Table 2. FTIR experimental values of PU[32,33].
Assignment Wavenumber
(cm–1)
NH, OH stretching 3520 a 3350
CH asymmetric stretching 2936 a 2919
C=O stretching 1724 a 1715
CN and NH stretching 1616
NH (Amide II) bending 1525 a 1550
C–O–C 1255
C-N, C-C and C-O stretching 1187 a 1015
Table 3. FTIR experimental values of PANI[14,22].
Assignment Wavenumber
(cm–1)
N-H stretching 3450
C–C ring asymmetric and symmetric stretching vibrations
1575 and 1519
Benzene structure 1485
N–H and C–C bending vibrations 1325 and 1291 C-N stretching of a secondary aromatic amine 1310 C–H bending (in-plane and out-of-plane) 1138 and 834
NMR analysis
13C-NMR analyses were obtained by means of
TNDO/2 method to determine the shielding and coupling constants of different IPN´s. The electrostatic potential property was obtained with 3D mapped isosurface representation. Tables 4 and 5 show the experimental values of PU and PANI, respectively.
Table 4 13C-NMR experimental values of PU[34-36].
Assignment PPM
C(O)ONH 159, 154
C=C 137 – 129, 125
C=CN 121, 119, 100
CH2O 72, 66
C – C 40
CH2 33 – 22, 20
CH3 14
NH group 8
CH2 4.2, 1.8
Table 5. 13C-NMR experimental values of PANI[37-39].
Assignment PPM
-CH3 173
Imine carbon 159, 158
Nonprotonated benzenoid unit 144 C=C-C (protonated carbons of
the quinoid unit)
137 C-C=C (protonated benzenoid) 124, 123
C=C 114
were observed the energy for diverse models, proven that the reaction was carried out.
Table 7 shows the ∆G that was used to locate a minimum of energy, in the surface, of the potential energy surface, and get the balance structure of a molecular system, using the Hyperchem 8v software by means of the semi-empirical methods (Amber, MM+ and PM3, respectively) and the Polak-Ribiere algorithm was possible calculate the ∆Gof different IPN´s. The negative values obtained shows that the reaction is spontaneous[40]
and the reaction mechanisms were adjusted to first order in each one of the relationships (95/05, 75/25 and 50/50, respectively). These results are similar to those reported by Rangel (2007) who determined that the blended and supported PU/HA composites are vulnerable to the hydrolysis reactions by means of the action of the urease enzyme, which it was carried out by means of hydrophobic adsorption in the surface followed by the hydrolysis of the ester bond of the PU, being proven the kinetics of first order[29]. Ayad et al (2003) studied
the kinetics formation of PU/PANI, concluding that the reaction was adjusted in first order[41]. Ma et al (2008)
determined the kinetics of polymerization of the aniline of the first order, concluding that, the increment of the concentration of radicals generated that polymerization began[42].
FTIR analyses
The strong tendency of PANI and PU to form hydrogen bonding has been verified by Rodrigues et al. through various spectroscopic techniques, which
was believed to be responsible for a certain degree of phase mixing in PANI/PU blend[43]. Ma et al (2009)
also confirmed the hydrogen bonding between PANI and PU, and the strong hydrogen bonding in the blend contributed to better miscibility, higher conductivity and tensile strength[44]. Semi-empirical theoretical methods
(Amber, MM+ and PM3) are specially designed to obtain enthalpy of formation of chemical systems. Stewart (2004) proposed a mathematical re-parameterization of the MNDO method called PM3 method. In this method single-atom parameters were obtained for C, N, H and O, simultaneously, by fitting 4000-500 experimental references[45]. Table 8 shows vibration bands characteristic
of PANI with theoretical values using three methods (Amber, MM+ and PM3, respectively) and experimental values. From 3553 at 3548 cm–1 vibration bands have been
attributed to the stretching vibration of the secondary amine.
The vibration bands around 2955, 2559 cm–1 were
assigned to the aromatic CH vibration. At 1675 cm–1
is due to the C=C double bind of quinoid rings. The vibration band at 1157 cm–1 is attributed to CN double
bond and indicative of protonation[46,47]. The peaks around
1465 and 1585 cm–1 result from stretching vibration for
benzene and quinoid moieties in the PANI chains. The peak at 1205 cm–1 was attributed at the vibration
of CH in benzene ring. The band at 1612 cm–1 is due to CC
stretching vibration of the benzoid ring, while the bands at 1675, 1674 and 1675 cm–1 are associated with CC
stretching vibration of the quinoid ring. This absorption has its origin in a vibration mode involving the benzoid
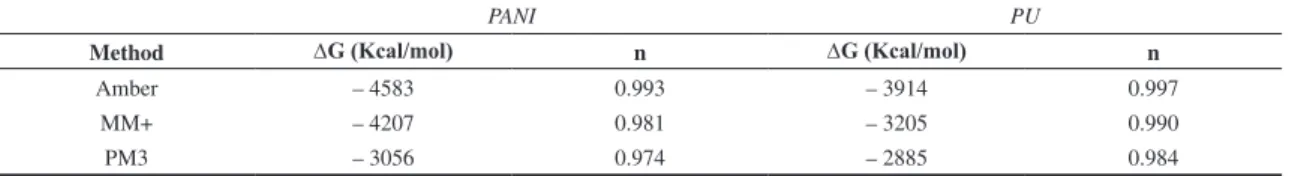
Table 6. Gibbs free energy (∆G) and reaction order (n) for PANI and PU respectively.
PANI PU
Method ∆G (Kcal/mol) n ∆G (Kcal/mol) n
Amber – 4583 0.993 – 3914 0.997
MM+ – 4207 0.981 – 3205 0.990
PM3 – 3056 0.974 – 2885 0.984
Table 7. DG and reaction order (n) of PU/PANI respectively.
95/05 75/25 50/50
Method ∆G (Kcal/mol) n ∆G (Kcal/mol) n ∆G (Kcal/mol) n
Amber 0.999 – 43254 0.994 – 40192 0.991
MM+ 24726 0.997 – 21879 0.991 – 20154 0.985
PM3 – 26304 0.996 – 25081 0.987 – 23846 0.982
Table 8. FTIR results of PANI.
VIBRATIONAL MODE EXPERIMENTAL VALUES
(cm–1)
THEORETICAL VALUES (cm–1)
Amber MM+ PM3
Amine secondary 3430, 3280 3553 3551 3548
CH vibration 2618 2559 2956 2955
C=C double (quinoid rings) 1593 1675 1674 1675
CC stretching 1612 1638 1622 1619
Stretching vibration for benzoid and quinoid 1573, 1500 1585 1537 1465
Ph-NH 1138 1216 1213 1211
CN 1174 1157 1149 1143
CH 1201 1205 1209 1205
ring CC is stretching partially mixed with CH bending. At 953 and 931 cm–1 correspond to the vibrations of the
quinoid and benzoid ring[48].
IR spectroscopy is an important experimental technique, which is widely used to determine the extent of hydrogen bonding in polymeric systems and especially in PUs. By determining the shifts in peak positions, a semi-quantitative measure of the hydrogen bond strength can be obtained from IR spectra. Quantum mechanical calculations are also very useful in constructing the IR spectrum of single molecules or complex systems, where peak shifts and related energy changes due to hydrogen bonding can quantitatively be obtained[30]. In bands corresponding to the urethane group
(-CH2 a 2867-2825 cm–1), two shoulder peaks appears at
1838-1835 cm–1, which is assigned to the carbonyl group
(C=O) can be observed in Table 9, the peaks between 1698 and 1697 cm–1 corresponds to C=C stretching peak
in the benzene rings. At 1489-1482 cm–1 were assigned
to stretching of CN, at 1290-1289 cm–1 was attributed
to stretching of benzene ring. The peaks from 1142 to 1138 cm–1 because of vibration of CH in benzene ring
and stretching of CN band have been observed[28].
Tables 10 to 12 are presented the simulations result where is appreciated that, the wavenumbers are very similar in each one of PU/PANI ratios. The adsorption and rate of hydrolysis reaction are affected by the physicochemical properties of the substrate (molecular weight, chemical composition, crystallinity, surface area) and also by the inherent characteristics of a specific enzyme (activity, stability, local concentration, amino acid composition, and 3D conformation). It is also very important to take into account the medium conditions such as pH and temperature, since they influence both the properties of the substrate and of the enzyme[49]. In
terms of degradation of biocompatible polymer, different investigations have been reported of tissue, some of these materials starting from isocyanates like HDI, BDI and LDI.
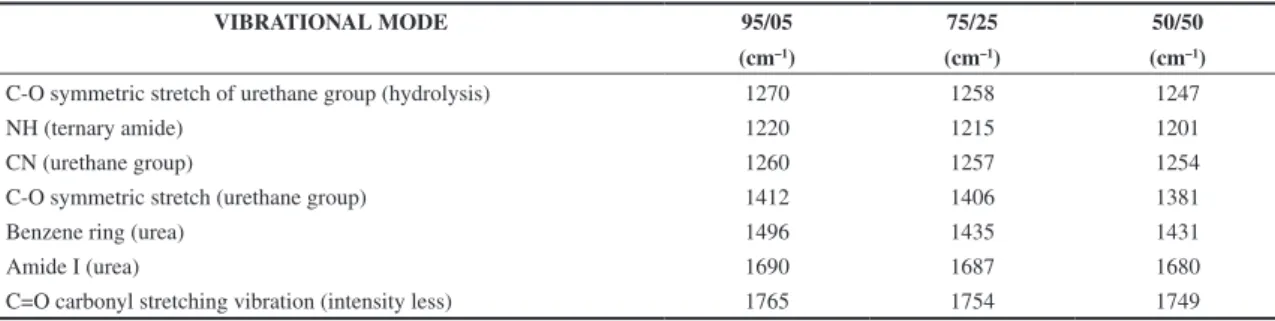
Tables 10 to 12 show FTIR spectra of 3 PU/PANI ratios, where, the characteristic bands of the hydrolysis were appreciated. From 1412 to 1370 cm–1 are attributed
to the stretching C-OR, and from 1270 to 1200 cm–1
were assigned to the stretching of the bond C-OR of the urethane group formed by the hydrolysis[13,47]. Finally, it
was appreciated that the degradation was made mainly on
Table 9. FTIR results of PU.
VIBRATIONAL MODE EXPERIMENTAL
VALUES
(cm–1)
THEORETICAL VALUES
(cm–1)
Amber MM+ PM3
CH2 2912, 2807 2867 2825 2825
C=C 1582 1698 1697 1697
C=O 1720 1838 1835 1835
CN 1375 1489 1482 1482
Benzene ring 1231 1290 1289 1289
CN 1210 1276 1274 1274
CH 1115 1142 1138 1138
Table 10. FTIR theoretical analysis results (Amber method) for PU/PANI relations modificated by urease enzyme.
VIBRATIONAL MODE 95/05
(cm–1)
75/25
(cm–1)
50/50
(cm–1)
C-O symmetric stretch of urethane group (hydrolysis) 1270 1258 1247
NH (ternary amide) 1220 1215 1201
CN (urethane group) 1260 1257 1254
C-O symmetric stretch (urethane group) 1412 1406 1381
Benzene ring (urea) 1496 1435 1431
Amide I (urea) 1690 1687 1680
C=O carbonyl stretching vibration (intensity less) 1765 1754 1749
Table 11. FTIR theoretical analysis results (MM+ method) for PU/PANI relations modificated by urease enzyme.
VIBRATIONAL MODE 95/05
(cm–1)
75/25
(cm–1)
50/50
(cm–1)
C-O symmetric stretch of urethane group (hydrolysis) 1263 1254 1228
NH (ternary amide) 1216 1207 1198
CN (urethane group) 1258 1257 1252
C-O symmetric stretch (urethane group) 1410 1402 1372
Benzene ring (urea) 1475 1466 1449
Amide I (urea) 1685 1684 1679
the relationship 95/05 due to a bigger presence of PU in the IPN´s.
Also, from 1765 to 1749 cm–1 were attributed to the
decreased of the stretching C=O, as well as in the bands related with the groups amide I (urea) and the benzene ring (urea), whose bands were determined from 1690 to 1680 and from 1496 to 1431 cm–1, respectively. From
1220 to 1201 cm–1 was assigned to the amide III of the
urethane group, at 1220 cm–1 corresponded to the NH and
CN of stretching (ternary amide) of the urea and urethane group.
NMR analyses
Figure 2 shows 13C-NMR spectra of PU and PANI,
respectively; in Figure 2a was appreciated that the resonances at 160-150 ppm were assigned to sec–sec and prim–sec urea carbonyls respectively, whereas the peak at 150 was ascribed to urethane carbonyls[50], from 180
to 195 ppm diverse signs arose as a result of the reaction between the isocyanate (HDI) with the hydroxyl groups of 1,6-hexanediol and isopropanol. Two strong and sharp peaks centered at 32 and 80 ppm are ascribed to the soft-segment carbons[51].
The peak at 142 ppm was attributed to the resonance of urethane carbonyl. In Figure 2b, at 20 ppm was assigned to the C-H bonds of PANI, the aromatic region ranging from 100 to 115 and from 133 to 140 ppm have contributions from all of the PANI carbons. In this
region, the peak at 120 ppm are assigned to the benzene protonated ring carbons of PANI, while the peak at 145 ppm is associated with the quinoid protonated ring carbons of PANI[28].
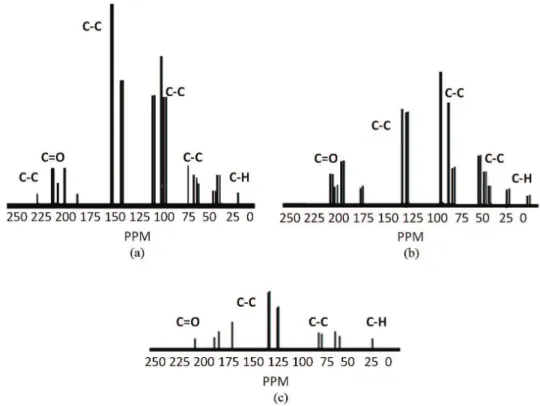
Figure 3 shows 13C-NMR spectra with 3 ratios (95/05,
75/25 and 50/50, respectively), after attack with urease enzyme, where appears merely as a superposition of the individual spectra of the polymers (PANI and PU). From 18 to 25 ppm are attributed to the CH bonds of PANI which increased with the PANI percentage in the IPNs, also, from 180 ppm diverse signs arose as a result of the reaction between the isocyanate (HDI) with the hydroxyl groups of 1,6-hexanediol and isopropanol. Two strong and sharp peaks centered at 48 and 75 ppm are ascribed to the soft-segment carbons. The peaks at 200 ppm were attributed to the resonance of carbonyl (urethane). The resonance at 40 ppm was assigned to –CH2– groups of HDI. According to the results of Salis et al., the resonance of –CH2– in HDI is restricted by the neighboring PANI oligomers[46].
In addition, the aromatic region ranging from 140 to 155 ppm has contributions from all of the PANI carbons[50].
However, because the chemical shifts of resonance peaks in this region are affected by the disturbance of electron clouds from individual components, the peaks presenting in the spectrum are broader as compared to those of neat PUs. In this region, the peaks at 105 and 120 ppm are assigned to the benzene protonated ring carbons of
Table 12. FTIR theoretical analysis results (PM3 method) for PU/PANI relations modificated by urease enzyme.
VIBRATIONAL MODE 95/05
(cm–1)
75/25
(cm–1)
50/50
(cm–1)
C-O symmetric stretch of urethane group (hydrolysis) 1252 1231 1200
NH (ternary amide) 1213 1204 1195
CN (urethane group) 1257 1253 1249
C-O symmetric stretch (urethane group) 1405 1400 1370
Benzene ring (urea) 1460 1429 1432
Amide I (urea) 1684 1683 1683
C=O carbonyl stretching vibration (intensity less) 1762 1760 1744
PANI and the protonated HDI carbons, while the peak at 225 ppm is associated with the quinoid protonated ring carbons of PANI. Some peaks in the regions of aromatic and urethane carbonyl are almost invisible, which is also ascribed to the electron clouds disturbance arising from the trapped PU-PANI. As compared to that of PU-PANI, weaker peaks in the aromatic region are observed, while the peak at 40 ppm shows a little stronger. It is clear that this difference in peak intensity result by means to urease enzyme action[25].
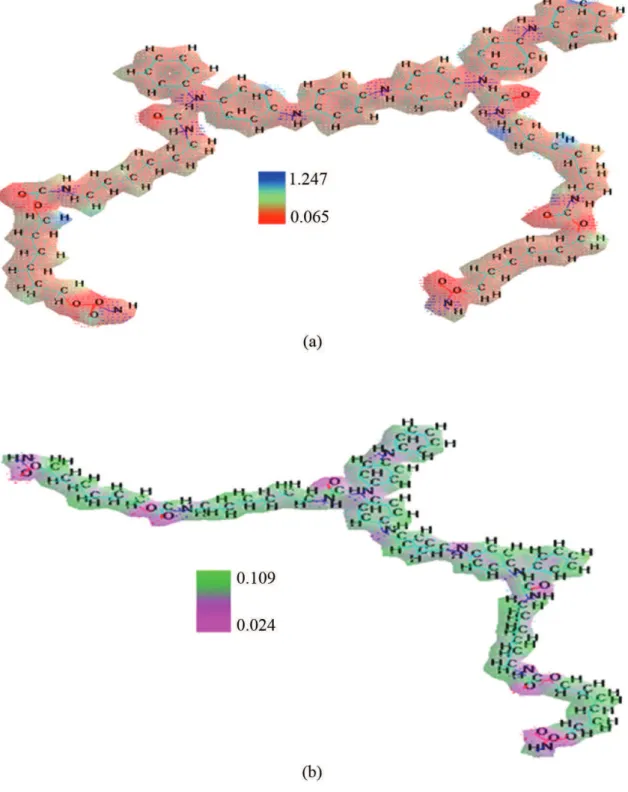
Electrostatic potential
Figure 4a show the electrostatic potential for 95/05 (PU/PANI) ratio, where is appreciated that the electrostatic potential is from 1.247 (maximum value) to 0.065 (minimum value) due to the electronegative present of the PANI, while in the Figure 4b it is appreciated that the potential diminishes from 0.109 (maximum value) to 0.024 (minimum value), due to the action of the urease enzyme that modify the chemical structure of the molecules generating a loss of the area of interaction of the IPN[42,52,53]. Olivucci et al. also confirmed the hydrogen
bonding between PANI and PU, and the strong hydrogen bonding in the blend contributed to better miscibility, higher conductivity and tensile strength[54].
Molecular orbitals
Figure 5 shows the frontier molecular orbital (highest occupied molecular orbital, HOMO) density distributions of (a) PU and (b) PANI. It is found that the electron density of HOMO for the PU unit is localized
mainly on two benzene with small contributions from diisocyanate[44], the preferred configuration of PANI
includes an alternate tilt of one aromatic ring with respect to the next (the arene-like rings are not coplanar). In fact, we observe light polarization dependence of PANI films with thicknesses less than 50 Å. Because the HOMO, HOMO-1, and HOMO-2 are enhanced with s-polarized light, lthough observed in both p and s-polarized light, it is clear the benzene rings (and the chain length) are mostly parallel with the surface[55,56].
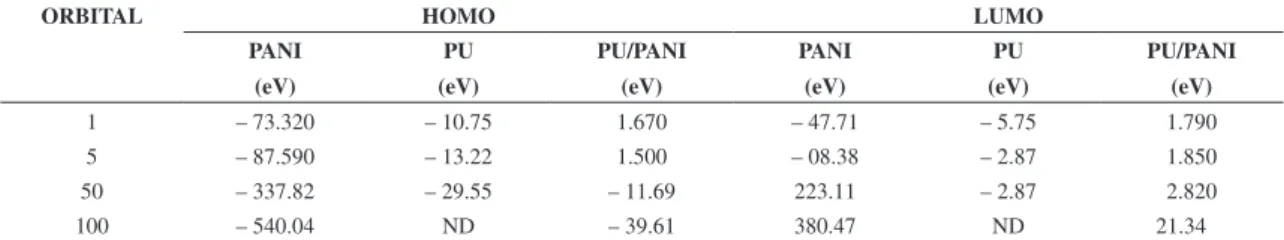
Table 13 shows that for the PU/PANI with urease enzyme, the electron density of HOMO is localized predominantly on the C-C bond. This indicates that the bonding of PU/PANI with enzyme containing d-orbital vacant will be more facile when compared to bonding though benzene ring in the absence of urease enzyme. Our calculations reveal that the enzyme adsorption further increases with the increasing hydrolysis degree and hence the inhibition efficiency. To understand the effect of hydrolysis degree on inhibition efficiency, we have computed the HOMO–LUMO energy gap. Often, EHOMO refers to the tendency of inhibitor to donate electrons Higher value of EHOMO indicates a greater electron donation tendency and, hence, stronger bond formation. On the other hand, lower value of ELUMO indicates more probable electron acceptance of the molecule. This will also be strengthening bond by accepting back donated electrons. The energy gap
∆E=ELUMO-EHOMO is thereby an important parameter for determining reactivity of the urease molecules towards the adsorption on the PU/PANI surface.
Figure 3. 13C-NMR spectra with 3 ratios (PU/PANI) (a) 95/05, (b) 75/25 and (c) 50/50, respectively after attack with urease enzyme
Figure 4. Electrostatic potential, in where (a) PU/PANI with 95/05 ratio, (b) PU/PANI after attack (15 days) with urease enzyme using Amber method.
The reactivity of the urease molecule increases with decreasing ∆E, promoting the greater inhibition efficiency of the molecule. Therefore, the reactivity of the urease molecule for adsorption on the PU/ PANI surface increases with increasing degree of hydrolysis. Thus, the electronic structure calculations envisage the orbital density distribution of HOMO of
Figure 5. Shows the frontier molecular orbital (highest occupied molecular orbital, HOMO) density distributions of (a) PU and (b) PANI.
Table 13. HOMO and LUMO orbitals value for PANI, PU and PU/PANI with urease enzyme.
ORBITAL HOMO LUMO
PANI
(eV)
PU
(eV)
PU/PANI
(eV)
PANI
(eV)
PU
(eV)
PU/PANI
(eV)
1 – 73.320 – 10.75 1.670 – 47.71 – 5.75 1.790
5 – 87.590 – 13.22 1.500 – 08.38 – 2.87 1.850
50 – 337.82 – 29.55 – 11.69 223.11 – 2.87 2.820
Conclusions
Samples of PU/PANI with different composition were analyzed. Using the Hyperchem software 8v by means of the Amber, MM+ and PM3 method, with the Polak-Ribiere algorithm was possible calculate the Gibbs free energy (∆G) of PU, PANI and PU/PANI (3 ratios).
FTIR tables showed the characteristic functional groups and different signs by means hydrolysis of PU, PANI and 3 PU/PANI ratios with 3 methods of computing modeling. From 1270 to 1200 cm–1 were assigned to
the stretching of the bond C-OR of the urethane group formed by the hydrolysis, in fact, can be appreciated that urease enzyme attacks more strongly to 95/05 due to a bigger presence of PU in the IPN´s.
13C-NMR spectra with 3 ratios (95/05, 75/25 and
50/50, respectively), show that appears merely as a superposition of the individual spectra of the polymers (PANI and PU). It is clear that this difference in peak intensity result by means to urease enzyme. The absorption peak at 334 nm is attributed to the transition of electrons from the highest occupied molecular orbital (HOMO) to the lowest unoccupied molecular orbital (LUMO) which is related to π→π* electronic transition. Orbital analysis demonstrated that the electron density of HOMO is localized predominantly on the C-C bond. This indicates that the bonding of PU/PANI with enzyme containing d-orbital vacant. Our calculations reveal that the enzyme adsorption further increases with increasing degree of IPN´s hydrolysis.
References
1. Hesketh, P. J. & Misra, D. - Electrochem. Soc. Interface, 21,
p.61 (2012).
2. Arshak, K.; Velusamy, V.; Korostynska, O.; Oliwa-Stasiak, K. & Adley, C. - IEEE Sens. J, 9, p.1942, (2009). http://
dx.doi.org/10.1109/JSEN.2009.2032052
3. Angelopoulos, M. - IBM J. Res. Dev., 45, p.57 (2001). 4. Alam, M.; Ansari, A. A.; Shaik, M. R. & Alandis, N.
M. - Arabina J. Chem., 6, p.341 (2013). http://dx.doi. org/10.1016/j.arabjc.2012.04.021
5. Pant, H. C.; Patra, M. K.; Negi, S. C.; Bhatia, A.; Vadera, S. R. & Kumar, N. - Bull. Mater. Sci., 29, p.379 (2006). http:// dx.doi.org/10.1007/BF02704139
6. MacDiarmid, A. G. - Angew. Chem. Int. Ed., 40,
p.2581 (2001). http://dx.doi.org/10.1002/1521-3773(20010716)40:14<2581::AID-ANIE2581>3.0.CO;2-2 7. Dai, L. & Mau, A. W. H. - Adv. Mater., 13,
p.899 (2001). http://dx.doi.org/10.1002/1521-4095(200107)13:12/13<899::AID-ADMA899>3.0.CO;2-G 8. Meier, H.; Lehmann, M. & Kolb, U. - Chem.
Eur. J., 6, p.2462 (2000). http://dx.doi. org/10.1002/1521-3765(20000703)6:13<2462::AID-CHEM2462>3.0.CO;2-A
9. Bredas, J. L. & Street, G. B. - Acc. Chem. Res., 18, p.309
(1985). http://dx.doi.org/10.1021/ar00118a005
10. Chakane, P. S.; Jain, L. S. & Bhoraskar, S. V. - Trans. SAEST, 1, p.35 (2002).
11. Patil, O.; Heeger, A. J. & Wudl, F. - Chem. Rev., 88, p.183
(1988). http://dx.doi.org/10.1021/cr00083a009
12. Luo, J.; Wang, X.; Li, J.; Zhao, X. & Wang, F. - Polymer, 48, p.4368 (2007). http://dx.doi.org/10.1016/j.
polymer.2007.05.062
13. Trchová, M.; Sedenkova, M. I.; Tobolkova, E. & Stejskal, J. - Polym. Degrad. Stab., 86, p.179 (2004). http://dx.doi. org/10.1016/j.polymdegradstab.2004.04.011
14. Stejskal, J. & Gilbert, R. G. - Pure Appl. Chem., 74, p.857 (2002).
15. Reza, N. M.; Golbabaee, M.; Moghaddam, A. B.; Dinarvand, R. & Sedghi, R. - Int. J. Electrochem. Sc., 3, p.1117 (2008).
16. Del Castillo-Castro, T.; Castillo-Ortega, M. M.; Villarreal, I.; Brown, F.; Grijalva, H.; Pérez-Tello, M.; Nuño-Donlucas, S. M. & Puig, J. E. - Composites Part A, 38, p.639 (2007).
http://dx.doi.org/10.1016/j.compositesa.2006.02.001 17. Sedenkova, I.; Trchová, M. & Stejskal, J. - Polym. Degrad.
Stab., 93, p.2147 (2008).
18. Zun-Li, M.; Zhong-Li, Z.; Hong, C.; Gui-Ping, N. & Hua-Feng, S. - Carbohydr. Polym., 75, p.660 (2009).
19. Lee, H. Y.; Rwei, S. P.; Wang, L. & Chen, P. H. - Mater. Chem. Phys., 112, p.805 (2008). http://dx.doi.org/10.1016/j. matchemphys.2008.06.050
20. Rangel-Vázquez, N. A.; Salgado-Delgado, R.; García-Hernández, E.; Mendoza-Martínez, A. M. & Gómez-Jimenez, M. A. – Braz. J. Mater. Sci. Eng., 4, p.45 (2010).
21. Zhou, C.; Han, J.; Song, G. & Guo, R. - Eur. Polym. J., 44, p.2850 (2008). http://dx.doi.org/10.1016/j. eurpolymj.2008.01.025
22. Islam, S.; Lakshmi, G. B. V. S.; Siddiqui, A. M.; Husain, M. & Zulfequar, M. - Int. J. Polym. Sci., 2013, p.1 (2013).
http://dx.doi.org/10.1155/2013/307525
23. Abdulla H. S. & Abbo, A. I. - Int. J. Electrochem. Sci., 7, p.10666 (2012).
24. Schmidt, V.; Domenech, S. C.; Soldi, M. S.; Pinheiro, E. A. & Soldi, V. - Polym. Degrad. Stab., 83, p.519 (2004). http://
dx.doi.org/10.1016/j.polymdegradstab.2003.08.011 25. Rangel-Vázquez, N. A.; Salgado-Delgado, R.;
García-Hernández, E. & Mendoza-Martínez, A. M. - J. Mex. Chem. Soc., 53, p.248 (2009).
26. Wang, T. L.; Yang, C. H.; Shieh, Y. T. & Yeh, A. C. - Eur. Polym. J., 45, p.387 (2009). http://dx.doi.org/10.1016/j.
eurpolymj.2008.11.020
27. Vicentini, D. S.; Barra, G. M. O.; Bertolino, J. R. & Pires, A. T. N. - Eur. Polym. J., 43, p.4565 (2007). http://dx.doi. org/10.1016/j.eurpolymj.2007.06.046
28. Rangel-Vázquez, N. A.; Salgado-Delgado, R.; Garcia-Hernandez, E. & Mendoza-Martinez, A. M. - Rev. Iber. Polímeros, 11, p.179 (2010).
29. Rangel-Vázquez N. A. - “Poliuretano poroso/ Hidroxiapatita para Aplicaciones Biomédicas: Síntesis y Caracterización”, PhD thesis, Instituto Tecnológico de Ciudad Madero, México (2007).
30. Yilgör, E.; Yilgör, I. & Yurtsever, E. - Polymer, 43, p.6551
(2002). http://dx.doi.org/10.1016/S0032-3861(02)00567-0 31. Rangel-Vázquez, N. A. & Rodríguez-Felix,
32. Rangel, N. A.; De Alva, H. E.; Romero, J.; Rivera, J. L.; Álvarez, A. & García, E. - Rev. Iber. Polímeros, 8, p.99 (2007).
33. Pretsch, T.; Jakob, I. & Müller, W. - Polym. Degrad. Stabil., 94, p.61 (2009). http://dx.doi.org/10.1016/j.
polymdegradstab.2008.10.012
34. Ngoc, L. P. & Van, B. L. - J Sci Nat, Sci, & Tech, XXIII,
p.19 (2007).
35. Wong, C. S. & Badri, K. H. - Mater. Sci. Appl., 3, p.78
(2012).
36. Omed, G. H.; Gelas, A.; Jamal, M.; Tahir, D. A. & Saeed, S. R. - IJAPM, 1, p.101 (2011).
37. Zujovic, Z. D.; Gizdavic-Nikolaidis, M. & Bowmaker, G. A. - Chem. New Zealand, 77, p.87 (2013).
38. Wu, C. S. - Express Polym. Lett., 6, p.465 (2012). http:// dx.doi.org/10.3144/expresspolymlett.2012.49
39. Kim, S.; Shin, S.; Spinks, G.; Kim, I. & Kim, S. - J. Appl. Polym. Sci., 96, p.867 (2005). http://dx.doi.org/10.1002/ app.21524
40. Araoyinbo, A. O.; Rahmat, A.; Derman, M. Z. & Ahmad, K. R. - Adv. Mater. Lett., 4, p.899 (2013).
41. Ayad, M. M.; Gemaey, A. H.; Salahuddin, N. & Shenashin, M. A. - J. Colloid Interf. Sci., 263, p.196 (2003). http://
dx.doi.org/10.1016/S0021-9797(03)00028-6
42. Ma, L.; Yan, J.; Gan, M.; Qiu, W.; He, L. & Li, J. - Polym. Test., 27, p.683 (2008). http://dx.doi.org/10.1016/j.
polymertesting.2008.05.006
43. Rodrigues, P. C.; Lisboa-Filho, P. N.; Mangrich, A. S. & Akcelrud, L. - Polymer, 46, p.2285 (2005). http://dx.doi.
org/10.1016/j.polymer.2005.01.020
44. Ma, J.; Li, Q.; Song, B.; Liu, D.; Zheng, B.; Zhang, Z. & Feng, Y. - J. Mol. Catal. B: Enzym., 56, p.151 (2009). http:// dx.doi.org/10.1016/j.molcatb.2008.03.012
45. Stewart, J. P. - J. Mol. Model., 10, p.155 (2004). PMid:14997367. http://dx.doi.org/10.1007/s00894-004-0183-z
46. Salis, A.; Setzu, S.; Monduzzi, M. & Mula, G. - “Porous silicon-based electrochemical biosensors”, in: Biosensors:
emerging materials and applications, cap 7, Pier A. Serra (ed.), InTech, Croatia, p.328 (2011).
47. Tuzun, N. S.; Bayata, F. & Sarac, A. S. - J. Mol. Struct.: THEOCHEM, 857, p.95 (2008). http://dx.doi.
org/10.1016/j.theochem.2008.02.007
48. Kaur, M. & Datta, M. - “A Novel Methodology for the Total Conversion of Fly Ash into Value Added products: Zeolite. International Conference on Recycling & Reuse of Materials (ICRM 2009)”, Kerala, India (2009).
49. Mishra, A. K. & Tandon, P. - J. Phys. Chem. B, 113, p.9702 (2009). PMid:19569629. http://dx.doi.org/10.1021/ jp901143m
50. Reza-Nabid, M.; Golbabaee, M.; Bayandori, M.; Dinarvand, R. & Sedghi, R. - Int. J. Electrochem. Sci., 3, p.1117 (2008).
51. Gaudin, F. & Sintes-Zydowicz, N. – Colloid. Surface. A, 331, p.133 (2008). http://dx.doi.org/10.1016/j.
colsurfa.2008.07.028
52. Ge, Z.; Zhang, X.; Dai, J.; Li, W. & Luo, Y. - Eur. Polym. J., 45, p.530 (2009). http://dx.doi.org/10.1016/j. eurpolymj.2008.11.008
53. Blinova, N.; Stejskal, J.; Trhová, M.; Prokes, J. & Omastova M. - Eur. Polym. J., 43, p.2331 (2007). http://dx.doi.
org/10.1016/j.eurpolymj.2007.03.045
54. Olivucci, M.; Ragazos, N.; Bernardi, F. & Robb, M. A. - J. Am. Chem. Soc., 115, p.3710 (1993). http://dx.doi. org/10.1021/ja00062a042
55. Cantatore, E.; Gelinck, G. H. & De-Leeuw, D. M. - “Polymer electronics: from discrete transistors to integrated circuits and active matrix displays”, in: IEEE Proceedings of the Bipolar/BiCMOS Circuits and Technology Meeting, p.167, Eindhoven, Netherlands (2002).
56. Xu, B.; Choi, J.; Caruso, A. N. & Dowban, P. A. - Appl. Phys. Lett., 80, p.4342 (2002). http://dx.doi. org/10.1063/1.1484247

![Table 4 13 C-NMR experimental values of PU [34-36] .](https://thumb-eu.123doks.com/thumbv2/123dok_br/18869407.419704/3.765.408.714.104.257/table-c-nmr-experimental-values-of-pu.webp)