in parallel neotropical fishponds
Sipaúba-Tavares, LH.*, Seto, LM. and Millan, RN.
Centro de Aquicultura, Univ. Estadual Paulista – UNESP, Via de Acesso Prof. Paulo Donato Castellane, s/n, CEP 14884-900, Jaboticabal, SP, Brazil
*e-mail: [email protected]
Received: October 10, 2012 – Accepted: January 22, 2013 – Distributed: February 28, 2014 (With 5 figures)
Abstract
The present study was carried out to evaluate the phytoplankton community and water quality in four parallel fishponds (FP1 to FP4) during one year. Some abiotic parameters of water column and phytoplankton was sampled in four sites, one in each fishpond. Similarity analysis showed that FP2 fishpond was markedly different for the others ponds with regard to phytoplankton community. Conductivity, orthophosphate, temperature, TSS and hardness parameters were significantly different (p<0.05) between fishponds and all limnological parameters were significantly different (p<0.01) among period (months). Organic matter and phosphorus of the sediment were significantly different (p<0.01) only among fishponds. In current study Chlorophyceae and Bacillariophyceae occurred in most months. Cyanobacteria density in April and May was higher in all fishponds, at FP3 represented 71.4% in April and FP1 represented 78.7% in May of
total reported, with chlorophyll-a content lower than 41 mg.L–1. The physical and chemical parameters of fishponds water constituted relations between the parameters and algae occurrence. The present study however, indicated that Cyanobacteria was more frequent in the fishponds after the fish grow-out period (April), and the water quality should be monitored more frequently in this period, due to the high total phosphorus, orthophosphate and chlorophyll-a contents.
Keywords: algae, aquaculture, physical and chemical parameters, water quality.
Variação sazonal dos parâmetros bióticos e abióticos em tanques de
piscicultura com disposição paralela de região neotropical
Resumo
O presente estudo avaliou durante um ano a comunidade fitoplanctônica e os fatores abióticos da água de quarto tanques de piscicultura (FP1 ao FP4) com disposição paralela. Alguns fatores abióticos da água e do fitoplâncton foram amostrados em quarto pontos, localizados um em cada tanque de piscicultura. Análise de similaridade mostrou que o tanque de piscicultura FP2 foi diferente dos outros tanques em relação a comunidade fitoplanctônica. Condutividade, ortofosfato, temperatura, STS e dureza foram diferentes (p<0,05) entre tanques e todas as variáveis limnológicas variaram entre o período de estudo (p<0,01). Matéria orgânica e fósforo do sedimento variaram (p<0,01) somente
entre os tanques. Chlorophyceae e Bacillariophycea estiveram presentes em todos os meses amostrados. Em abril e
maio foi observada elevada densidade de Cyanobacteria em todos os tanques sendo que no FP3 representou 71,4% em abril e no FP1 78,7% em maio do total encontrado, com teor de clorofila-a abaixo de 41 mg.L–1. Os parâmetros físico-químicos da água dos tanques de piscicultura apresentaram relação com a ocorrência do fitoplâncton nestes sistemas. Os resultados deste estudo indicaram a maior frequência de Cyanobacteria no período após a engorda de peixes (abril) necessitando maior monitoramento da qualidade da água devido aos altos teores de fósforo total, ortofosfato e clorofila-a observados neste mês (abril)
Palavras-chave: alga, aquicultura, variáveis físicas e químicas, qualidade da água.
1. Introduction
Fishponds are dynamic ecosystems characterized by
shallowness and continuous water flow, which directly affect both limnological variables throughout the day. The spatial and seasonal impact of fishponds on the water column is due to the high fish density and artificial regimes. The water quality is identified in terms of its biotic and abiotic
parameters. In open artificial systems, such as fishponds, the physical, chemical and biological variables are highly affected by environmental conditions and management.
The physical and chemical parameters are used to
Biotic and abiotic parameters in parallel fishponds
(Sipaúba-Tavares et al., 2010). However ecological water
quality is defined by biological parameters because the composition of aquatic communities is reflected by the sum of all influencing or disturbing factors (Kopp et al., 2012).
Diversity of the plankton population is fairly dependent
on water quality, climatic factors and management in fishponds that constantly receive large nutrient loads (feed, fertilizing, fish waste) which contribute towards algal growth (Sipaúba-Tavares et al., 2011). The abundance and
composition of algae may be very useful indicators of water quality, since they reflect environmental conditions. Any environmental change within the fishpond may to cause,
relevant repercussion on this community.
The variation of water quality and natural food (plankton) are strongly affected by fish density, or rather, when a lower biomass of phytoplankton occurs, available nitrogen and
phosphorous in the water column are less. Since nutrients
in the added fertilizers integrate the plankton biomass and later the trophic chain, fish biomass increases, coupled to subsequent high growth of fish production (Vega et al., 2007). Even if fish do not directly feed on the plankton,
the community needs adequate water quality conditions so that biomass may remain at acceptable levels, without blooms or any toxin release in the water. These latter
conditions are highly common in eutrophic systems such as fishponds.
The release of nutrients by fishponds is a continuous process through the year, reaching maximal values during the summer when high water temperature imposes the need for higher feeding rates (Neofitou and Klaoudatos, 2008).
Nutrients supply and its ratios have a decisive effect on the species composition of phytoplankton because
different algal species have different nutrient requirements.
Differences in the phytoplankton biomass and composition have been found in ponds with different trophic status (Zhong et al., 2011).
The aim of this study was to evaluate the effects of the seasonal variation of biotic and abiotic parameters in
four parallel fishponds with the same fishery management and fish stock density.
2. Material and Methods
2.1. Area and fish management
The study was carried out at the aquaculture farm
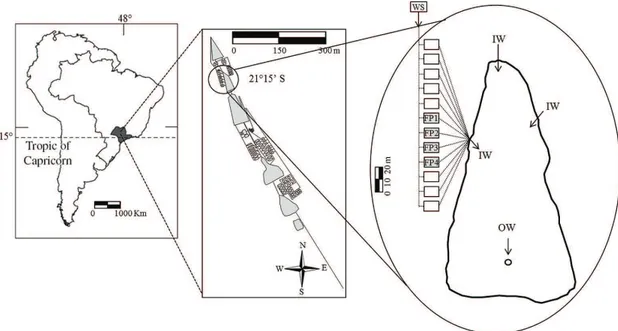
(21°15’S and 48°17’W) in four parallel fishponds (FP1 to FP4) with continuous water flow and 5% a daily volume exchange. Water supply comes from the others ponds up to the parallel fishponds and channeled to these fishponds by underground tubes. The surface area of fishponds is 45 m2
and their mean depth 1.50 m (Figure 1). The fishponds were populated with “pacu” fries (Piaractusmesopotamicus) and
“tambaqui” fries (Colossoma macropomum), at a density
of 0.15 kg.m3. Fish were fed floating pelleted feed with 30% crude protein three times a day, at 3% weight.day–1.
2.2. Sampling sites and physical and chemical data
Physical and chemical parameters were recorded at
surface sample (0.10 m) using a 1 L Van Dorn bottle, monthly during twelve months. Water samples were collected at one site in each fishpond (FP1 to FP4) (Figure 1). Temperature, pH, dissolved oxygen and conductivity were measured using a multi-probe Horiba U-10. Total
phosphorus, orthophosphate, nitrite, nitrate, and ammonia
were quantified spectrophotometrically according to Golterman et al. (1978) and Koroleff (1976). Chlorophyll-a
Figure 1. Cross-section of fishponds studied, where: FP1 to FP4 = fishponds, IW = inlet water, OW = outlet water, WS =
750 nm (Nusch, 1980). Hardness, total suspended solids
(TSS) and 5-day biochemical oxygen demand (BOD5), was determined according to Boyd and Tucker (1992). Alkalinity and bicarbonate contents were determined
according to Mackereth et al. (1978). Water transparency was estimated by a Secchi disk and sediment samples
were undertaken for phosphorus and organic matter (OM) according to Andersen (1976). Analyses were performed
immediately after sampling or samples were duly stored under refrigeration.
2.3 Phytoplankton
Phytoplankton composition was analyzed only in
surface samples (0.10 m). Phytoplankton samples were taken by a 1 L Van Dorn bottle from each fishpond, monthly during twelve month, immediately filtered with 25 µm of mesh nets and preserved in Lugol iodine solution. The net
samples were observed in an optical microscope (200 X
magnification) for preliminary taxonomical identifications.
Samples for the quantitative analysis of the phytoplankton
were collected with a Van Dorn bottle, fixed with 1% Lugol iodine solution and stored in ambar glass jars. Sub-samples were placed in sedimentation in Sedgewick-Rafter chamber during 30 minutes. After sedimentation the organisms (cells, colony and filaments) were counted using a Leica-Leitz microscope (APHA, 1998) and enumerated in 100 fields. At least 200 cells of the most frequent species or genus were counted (p<0.05; Lund et al., 1958). Frequency of occurrence was estimated for total phytoplankton organisms were divided into three categories: constant (50% or above); common (between 10% and 50%) and rare (between 1% and 10%) (Sampaio et al., 2002).
Analysis of variance (ANOVA) was used to evaluate differences among fishponds and among months, and their interactions. When a significant differences was detected, Fisher LSD (Least Square Differences) test was used post-hoc comparisons. All tests of significance were made at p=0.05. The statistical analyses were carried out by Statistica 8.0 (StatSoft Inc, 2007). Fishponds were grouped by cluster analysis (un-weighted pair group average linkage, UPGMA) based on the Bray Curtis index, using abundance log10 (x + 1) transformed data of
all phytoplankton (Magurran, 1989).
3. Results
All limnological parameters of water column were significantly different (p<0.01) between months, but
only orthophosphate, conductivity, TSS, temperature
and hardness were significantly different (p<0.05) among fishponds (Table 1). An increase of total phosphorus, orthophosphate, and chlorophyll-a was observed among
November to April (Figures 2 and 3). The highest values of chlorophyll-a was recorded among March and April
and nitrate was lowest in these months varying between 99 to 250 mg.L–1 (Table 1; Figure 2).
Temperature was directly affected by local climatic
conditions, with low values in July (winter) and high ones from December to March (summer) (Table 1; Figure 3).
A sharp fall in dissolved oxygen concentrations occurred in October. This fact coincided with high ammonia contents in October varying between 76 and 155 mg.L–1; high water transparency varying between 125 to 150 cm
Table 1. Physical and chemical variables of water samples, phosphorus (Psed) and organic matter (OMsed) in the sediment of the four fishponds (FP1 to FP4) during the studied period (Mean ± standard deviation).
VARIABLES FISHPONDS ANOVA
FP1 FP2 FP3 FP4 Sites Months
Nitrate (mg.L–1) 269.3 ± 161.9 261.3 ± 171.6 269.6 ± 144.3 284.5 ± 170.2 p>0.05 p<0.01
Nitrite (mg.L–1) 3.1 ± 1.5 3.8 ± 2.8 4.1 ± 3.2 3.4 ± 1.7 p>0.05 p<0.01
Ammonia (mg.L–1) 54.3 ± 34.0 43.0 ± 27.5 70.2 ± 50.1 53.0 ± 40.8 p>0.05 p<0.01
Total Phosphorus (mg.L–1) 63.5 ± 38.4 71.9 ± 49.0 79.1 ± 49.3 65.3 ± 34.7 p>0.05 p<0.01
Orthophosphate (mg.L–1) 12.0 ± 9.7b 16.3 ± 15.3ab 21.6 ± 19.0a 18.3 ± 15.0ab p<0.05 p<0.01
Dissolved Oxygen (mg.L–1) 3.3 ± 0.6 3.2 ± 0.7 3.2 ± 0.6 3.1 ± 0.7 p>0.05 p<0.01
Conductivity (mS.cm–1) 41.3 ± 1.7b 41.8 ± 1.8b 41.8 ± 1.1b 42.7 ± 1.8a p<0.01 p<0.01
TSS (mg.L–1) 15.4 ± 11.5ab 12.1 ± 12.4b 20.1 ± 19.6a 17.7 ± 19.2a p<0.05 p<0.01
pH 6.9 ± 0.4 7.0 ± 0.6 6.6 ± 0.5 6.6 ± 0.7 p>0.05 p<0.01
Temperature (°C) 25.8 ± 3.0a 25.4 ± 2.8b 25.4 ± 2.9b 25.7 ± 2.7ab p<0.05 p<0.01
Chlorophyll-a (mg.L–1) 30.4 ± 35.3 48.9 ± 64.3 41.9 ± 24.8 41.3 ± 47.7 p>0.05 p<0.01
Alkalinity (mg.L–1) 32.7 ± 2.4 32.5 ± 3.5 32.1 ± 3.1 32.0 ± 3.6 p>0.05 p<0.01 Bicarbonate (mg.L–1) 39.6 ± 2.7 39.1 ± 3.5 39.2 ± 3.8 38.6 ± 4.4 p>0.05 p<0.01
BOD5 (mg.L–1) 3.3 ± 1.6 3.8 ± 1.1 3.5 ± 1.5 3.1 ± 1.5 p>0.05 p<0.01 Hardness (mg.L–1) 11.8 ± 1.8b 12.4 ± 2.0b 12.3 ± 1.3b 13.8 ± 2.3a p<0.01 p<0.01 Water Transparency (cm) 130 ± 20 120 ± 30 110 ± 40 130 ± 20 p>0.05 p<0.01 Psed. (mgP.g–1) 0.4 ± 0.1b 0.3 ± 0.1c 0.5 ± 0.1b 0.7 ± 0.3a p<0.01 p>0.05
Biotic and abiotic parameters in parallel fishponds
and low chlorophyll-a varying between 11 to 37 mg.L–1. The values obtained for dissolved oxygen indicated the low oxygenation in the water column, with a minimum of 1.3 mg.L–1 (FP2 and FP4) in October, and a maximum of 4 mg.L–1 (FP1 and FP2) in May and April during the study period. The water pH is close to neutral, showing little variation throughout the year and no seasonal pattern.
The same was observed to alkalinity and bicarbonate,
showing low variation during the study period (Table 1;
Figures 2 and 3).
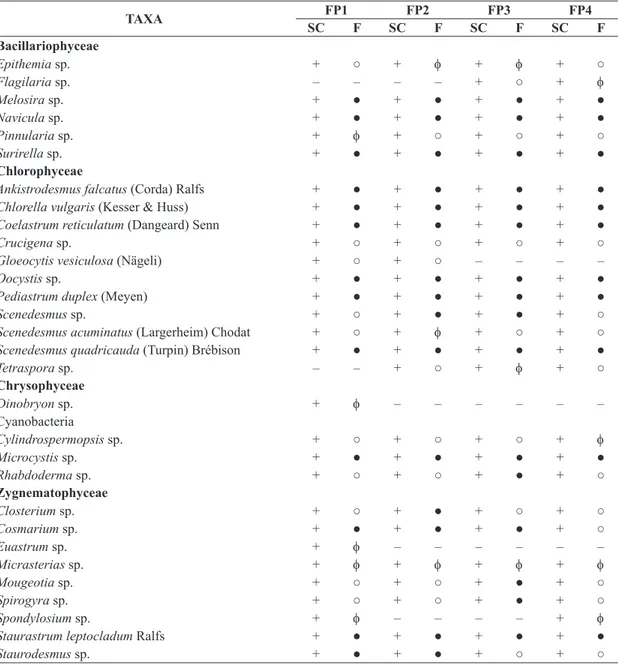
The quantitative analysis of samples taken in the four
fishponds revealed that the phytoplankton community was represented by a total of 30 taxa (species or genus). The Chlorophyceae and Zygnematophyceae, had highest
richness, represented by 12 and 9 taxa respectively,
followed by Bacillariophyceae with 6 taxa, as illustrated in Table 2. There were great changes in phytoplankton
densities during the study period. The fishponds FP2 and FP3 had the largest number of constant species was
observed. Cyanobacteria (Cylindrospermopsis sp.) and
Zygnematophyceae (Staurastrumleptocladum) had one specie constant in the four fishponds, whereas Chlorophyceae
and Bacillariophyceae was represented by six and three
constant species in the four fishponds, respectively during
the study period (Table 2).
High density of Cyanobacteria occurred at FP1, FP3 and FP4 during March, and the chlorophyll-a contents were
below 41 mg.L–1. In April when Cyanobacteria species
were present but not abundant at FP1, FP2 and FP4, the chlorophyll-a contents were above 133 mg.L–1, with the
exception of FP3 where Cyanobacteria was dominant
(>70%) and chlorophyll-a was below 40 mg.L–1 (Table 1; Figures 2 and 3).
Bacillariophyceae were reported in all months, in general with highest abundance between August and October, but in FP1 was highest in October, November and January. In October orthophosphate and hardness concentrations decreased, and lowest dissolved oxygen (<1.7 mg.L–1)
and BOD5 (<3.8 mg.L–1) concentrations were reported
(Table 1; Figures 3 and 4).
Chlorophyceae had the highest abundance percentage, or rather, more than 46%, between June and July in all fishponds, at FP1 they were dominant between July and September with 83% of total phytoplankton population,
with an increase in nitrate concentrations and a decrease of orthophosphate concentrations (Figures 2 and 4).
Zygnematophyceae increased at higher abundance percentages in January (86%) at FP2 with highest pH (7.8), low ammonia (22 mg.L–1) and nitrate (49 mg.L–1) contents. In November this group was represented with 72% and February with 69% at FP4, associated with highest
conductivity (41 mS.cm–1) and hardness (11 mg.L–1) were
reported (Table 1; Figures 2, 3 and 4).
Chrysophyceae, represented by Dinobryon sp. featuring
93% total of species in December and only occurred at FP1 in this month when observed highest temperature (29°C) and low ammonia (76 mg.L–1), pH (6.8), conductivity
(40 mS cm–1) and TSS (12 mg.L–1) were reported (Table 1;
Biotic and abiotic parameters in parallel fishponds
Figures 2, 3 and 4). The highest TSS values ranging between 45 and 75 mg.L–1, were observed in the four fishponds in
January (Table 1; Figures 2, 3 and 4).
Similarity analyses for phytoplankton densities showed
the formation of two groups, FP2 fishpond was markedly different from the others ponds with regard to phytoplankton
(Figure 5).
Sediment phosphorus contents varied between 0.33
and 0.76 mg.L–1, with low contents throughout the whole period under analysis. High rates of organic matter were reported at fishpond FP3, varying between 2.8% and 8.8%. Phosphorus and organic matter in the sediment did not vary (p>0.05) between months but were significantly different (p<0.01) among the fishponds (Table 1).
4. Discussion
Results show that difference (p<0.05) existed among fishponds with regard to orthophosphate, conductivity, TSS, temperature and hardness even though some limnological variables differed throughout the period analyzed and thus
interfered directly with the phytoplankton community.
The fishponds are shallow, turbid and warm neotropical ponds. The water has pH nearly neutral, low oxygenation and conductivity during the year. Total suspended solids concentrations increase considerably during December and January (rainy period) probably as a consequence of allochthonous material (organic and inorganic) of water supply and fertilize management (fish grow-out period).
Table 2. Specific composition (SC), and frequency occurrence (F) of phytoplankton taxa in the four fishponds (FP1 to FP4),
where: + = presence; − = absence; ● = constant; ο = common and ϕ = rare.
TAXA FP1 FP2 FP3 FP4
SC F SC F SC F SC F
Bacillariophyceae
Epithemia sp. + ○ + f + f + ○
Flagilaria sp. – – – – + ○ + f
Melosira sp. + ● + ● + ● + ●
Navicula sp. + ● + ● + ● + ●
Pinnularia sp. + f + ○ + ○ + ○
Surirella sp. + ● + ● + ● + ●
Chlorophyceae
Ankistrodesmusfalcatus (Corda) Ralfs + ● + ● + ● + ●
Chlorella vulgaris (Kesser & Huss) + ● + ● + ● + ●
Coelastrum reticulatum (Dangeard) Senn + ● + ● + ● + ●
Crucigena sp. + ○ + ○ + ○ + ○
Gloeocytis vesiculosa (Nägeli) + ○ + ○ – – – –
Oocystis sp. + ● + ● + ● + ●
Pediastrum duplex (Meyen) + ● + ● + ● + ●
Scenedesmus sp. + ○ + ● + ● + ○
Scenedesmus acuminatus (Largerheim) Chodat + ○ + f + ○ + ○
Scenedesmus quadricauda (Turpin) Brébison + ● + ● + ● + ●
Tetraspora sp. – – + ○ + f + ○
Chrysophyceae
Dinobryon sp. + f – – – – – –
Cyanobacteria
Cylindrospermopsis sp. + ○ + ○ + ○ + f
Microcystis sp. + ● + ● + ● + ●
Rhabdoderma sp. + ○ + ○ + ● + ○
Zygnematophyceae
Closterium sp. + ○ + ● + ○ + ○
Cosmarium sp. + ● + ● + ● + ○
Euastrum sp. + f – – – – – –
Micrasterias sp. + f + f + f + f
Mougeotia sp. + ○ + ○ + ● + ○
Spirogyra sp. + ○ + ○ + ● + ○
Spondylosium sp. + f – – – – + f
Staurastrumleptocladum Ralfs + ● + ● + ● + ●
This is also a possible explanation for the high total
phosphorus, orthophosphate and chlorophyll-a contents
and low nitrate concentration during this period. The phytoplankton community of the four fishponds was represented in the samples by numerous genus and species among Chlorophyceae and Zygnematophyceae, but
Bacillariophyceae and Chlorophyceae were found to be
the most frequent in the fishponds during the study period, followed by Zygnematophyceae and Cyanobacteria. High
frequency of Bacillariophyceae is attributed moderate levels
of nutrients, low conductivity waters and high transparency
(Baba et al., 2011), as reported in current study.
The growth and abundance of Chlorophyceae in the present study also reflect the oligo-mesotrophic nature of the fishponds water. Chlorophyceae species in these fishponds in general they are more dominant groups in
terms of species number due to temperature and nutrients contents (Sipaúba-Tavares et al., 2011).
Human activities in the fishponds introduce allochthonous
material, which may affect the physical and chemical variables from one season to another (Davies et al., 2009). Since seasonal variations affect the physical and chemical variables, there are variation in plankton abundance and
diversity. Intense feed management (high feed addition in
Biotic and abiotic parameters in parallel fishponds
ponds) during the summer (rainy season, from November to March) increased chlorophyll-a, TSS, orthophosphate and total phosphorus contents, low nitrate and conductivity,
with high density of Zygnematophyceae in FP4 and FP2 (January). In generally, Zygnematophyceae is found mainly
in nutrient-poor acidic water environments with low
electrical conductivity and high transparency (Felisberto
and Rodrigues, 2005).
The highest Cyanobacteria densities have been found in
March and April in FP1, FP3 and FP4, with low temperature
and high conductivity values were reported.
Chrysophyceae represented 91.5% of total phytoplankton only in December (FP1), and none during the rest of the studied period. Chrysophyceae were represented just one
species, namely, Dinobryon sp. This species may grow in the
phytoplankton of both acid and base waters, characterized
by poor nutrients, alkalinity and high tolerance to low temperatures. It is a highly common species causing blooms in oligo-mesotrophic ponds during the summer (Tas et al., 2010). The ability of flagellates to overcome low nutrients
affinity by complementing the diet inorganic nutrients with organic ones is well-known survival strategy in this microalgae group (Loureiro et al., 2009).
Dissolved oxygen concentrations in fishponds were low varied between 1.3 and 4.0 mg.L–1. In fact, a sharp decrease in dissolved oxygen concentrations occurred in all fishponds in October. This fact coincided with high ammonia contents varying between 76 and 156 mg.L–1. Ammonia contents are usually low in oxygenated waters of mesotrophic ponds due to its use by algae in the photic zone and nitrification to nitrogen oxidized forms (Quirós, 2003).
Nitrate concentrations became low between November
and April and pH varied between 6.5 and 7.9, whereas organic matter was high mainly in FP3. The removal of nitrogen from waters is usually dominated by nitrate denitrification, concomitantly with the oxidation of organic matter. However, highly productive surface waters with high pH would favor nitrogen release to the atmosphere
as ammonia (Quirós, 2003).
Low nitrogen compounds in the fishponds caused in
low chlorophyll-a contents in present study, with values
below 100 mg.L–1, except in March with 127 mg.L–1 at
FP1 and in April at FP1 (132 mg.L–1), FP2 (250 mg.L–1) and FP4 (148 mg.L–1). The concentration of chlorophyll-a in algal cells declines under nitrogen limitation, because nitrogen is a major constituent of this pigment and its
apoprotein (Heraud et al., 2007).
A high load of organic matter (dead algal cell, fish feed solids, uneaten food) in bottom sediments is related to the fishpond fertilization management featuring plankton densities, high quantities of non-consumed remains and consequently large metabolites produced by fish, mainly in the fish grow-out period during the rainy and hot season. In fact, occurs an increase in fish waste and, consequently, with a higher nitrogen and phosphorus release through
feces and urine. Thus, an increase of nutrients in the water
and sediment occurred during this period.
Ammonia nitrogen is the most important and readily available nitrogen source for phytoplankton. In the current study, ammonia concentrations were lower than 145 mg.L–1 (except FP3 in October with 155 mg.L–1, and March with 173 mg.L–1), probably due to the fast ammonia uptake by phytoplankton. The relatively low ammonia during the study period may be attributed the competitive advantage for Cyanobacteria, mainly in May and April, due to high affinity ammonium uptake. Since nitrogen and phosphorus are commonly found in fertilizers used in fishponds and relatively high temperature are favorable conditions for the growth of Cyanobacteria. This taxon is dominant at temperatures above 20°C, alkaline pH and high nutrient
concentration (Rahman and Jewel, 2008).
According to cluster the fishpond FP2 exhibited the highest difference when compared to others ponds.
Such difference may be associated with low density of
Cyanobacteria, except in November, and high dominance of Bacillariophyceae during the study period.
Great care should be taken in feeding management since high ammonia concentrations associated with high pH and temperature cause higher abundance of Cyanobacteria, mainly after the fish grow-out period (April). During the study period, several materials (diet and fertilizers) were added to the fishponds. These materials produced in the pond (feces, urine, nitrification) can be retained
in the sediment and later released in the water column.
This fact occurred in April when phytoplankton groups had excellent representations and high concentrations of nutrients (mainly ammonia and orthophosphate) in the water column and phosphorus and organic matter (mainly FP3 and FP4) in the sediment.
Succession changes in biotic and abiotic parameters are associated with many factors, like food management,
human activities, hydraulic retention time, climatic factors,
fish density, and others intrinsic factors that affect abiotic parameters in the fishponds. Since there are many extrinsic and intrinsic factors associated with limnological variables, these factors would have a weighted effect related to the particular characteristics of fishponds. Results of current study showed that some limnological variables vary among fishponds and during the year (May-April).
The physical and chemical parameters of fishponds
water constituted relations between the parameters and
Figure 5. Cluster analysis considering the average total
density of Chlorophyceae and Bacillariophyceae mainly
June to January. Cyanobacteria had high density mainly in April (mainly FP3) when total phosphorus, orthophosphate and ammonia contents were high. The present study
however, indicated that Cyanobacteria were more frequent
in the fishponds after the fish grow-out period and the
water quality should be monitored more frequently in this
period due to the high total phosphorus, orthophosphate
and chlorophyll-a contents. Water management within
these fishponds may be optimized to avoid risks associated
with Cyanobacteria and impairment to the water uses, due
the effluents of these fishponds directly discharged into the largest pond.
Acknowledgements– The authors would like to thank
the Brazilian Council for Scientific and Technological Development (CNPq) for financial support. We would also like the working group of Limnology and Plankton Production Laboratory of CAUNESP.
References
ANDERSEN, JM., 1976. An ignition method for determination of total phosphorus in lake sediments. Water Research, vol. 10, no. 4, p. 329-331. http://dx.doi.org/10.1016/0043-1354(76)90175-5 AMERICAN PUBLIC HEALTH ASSOCIATION – APHA, 1998.
Standard methods for the examination of water and wastewater.
20th ed. Washington: American Public Health Association, America Water Works Association, Water Environmental Federation. BABA, AI., SOFI, AH., BHAT, SU. and PANDIT, AK., 2011. Periphytic algae of river Sindh in the Sonamargarea of Kashmin valley. Journal of Phytology, vol. 3, no. 6, p. 1-12.
BOYD, CE. and TUCKER, CS., 1992. Water quality and pond
soil analyses for aquaculture. Auburn: Alabama Agricultural
Experiment Station, Auburn Univeristy. 183 p.
DAVIES, OA., ABOWEI, J F.N. and OTENE, B.B., 2009. Seasonal abundance and distribution of plankton of Minichinda stream, Niger Delta, Nigeria. America of Journal Science Research, vol. 2, no. 2, p. 20-30.
FELISBERTO, AS. and RODRIGUES, L., 2005. Influência do gradiente longitudinal (rio-barragem) na similaridade das comunidades de desmídias perifíticas. Revista Brasileira de Botânica, vol. 28, no. 2, p. 241-254.
GOLTERMAN, HL., CLYMO, RS. and OHNSTAD, MAM., 1978. Methods for physical and chemical analysis of freshwater.
2nd ed. Oxford: Blackwell Scientific Publication. 213 p. IBP Handbook, no. 8.
HERAUD, P., BEARDALL, J., MCNAUGHTON, D. and WOOD, BR., 2007. In vivo prediction of the nutrient status of individual microalgal cells using Raman microspectroscopy. Research Letters, vol. 275, no. 1, p. 24-30.
KOPP, R., VITEK, T., STASTNY, J., SUKOP, I., BRABEC, T., ZIKOVA, A., SPURNY, P. and MARES, J., 2012. Water quality and biotic community of a highland stream under the influence of a eutrophic fishpond. International Review of Hydrobiology, vol. 97, no. 1, p. 26-40. http://dx.doi.org/10.1002/iroh.201111426 KOROLEFF, F., 1976. Determination of nutrients. In GRASHOF, E. and KREMLING, E. (Eds.). Methods of sea water analysis. German: Verlag Chemie Wenhein. p. 126-133.
J. and VAQUÉ, D., 2009. The significance of organic nutrients in the nutrition of Pseudo-nitzschia delicatissima (Bacillariophyceae). Journal of Plankton Research, vol. 31, no. 4, p. 399-410. http:// dx.doi.org/10.1093/plankt/fbn122
LUND, JWG., KIPLING, C. and LE CREN, ED., 1958. The inverted microscopic method of estimating algal numbers and the statistical basis of estimations by counting. Hydrobiologia, vol. 12, p. 143-170.
MACKERETH, FJH., HERON, J. and TALLING, FJ., 1978.
Water analysis: some revised methods for limnologists. England:
Titus Wilson and Son. 124 p.
MAGURRAN, AE., 1989. Diversidad ecológica y su medición. Barcelona: Ediciones Vedrá. 200 p.
NEOFITOU, N. and KLAOUDATOS, S., 2008. Effect of fish farming on the water column nutrient concentration in a semi-enclosed gulf of the Eastern Mediterranean. Aquaculture Research, vol. 39, no. 5, p. 482-490. http://dx.doi.org/10.1111/j.1365-2109.2008.01900.x NUSCH, EA., 1980. Comparison of different methods for chorophyll and phaeopigments determination. Archives für Hydrobiologie, vol. 14, p. 14-36.
QUIRÓS, R., 2003. The relationship between nitrate and ammonia concentrations in the pelagic zones of lakes. Limnética, vol. 22, no. 1-2, p. 37-50.
RAHMAN, MM. and JEWEL, MAS., 2008. Cyanobacterial blooms and water quality in two urban fish ponds. University Journal of
Zoology, Rajshahi University, vol. 27, p. 79-84.
SAMPAIO, EV., ROCHA, O., MATSUMURA-TUNDISI, T. and TUNDISI, JG., 2002. Composition and abundance of zooplankton in the limnetic zone of seven reservoirs of the Paranapanema River, Brazil. Brazilian Journal of Biology, vol. 6, no. 3, p. 525-545. SIPAÚBA-TAVARES, LH., LOURENÇO, E.M. and BRAGA, F.M.S., 2010. Water quality in six sequentially disposed fish ponds with continuous water flow. Acta Scientiarum Biological Sciences, vol. 32, no. 1, p. 9-15. http://dx.doi.org/10.4025/ actascibiolsci.v32i1.3436
SIPAÚBA-TAVARES, LH., DONADON, A.R.V. and MILLAN, R.N., 2011. Water quality and plankton populations in an earthen polyculture pond. Brazilian Journal of Biology, vol. 71, no. 4, p. 1-11.
STATSOFT INC., 2007. STATISTICA (Data Analysis Software
System), version 8. Available from: <http:www.statsoft.com>.
TAS, B., GÖNÜLOL, A. and TAS, E., 2010. Seasonal dynamics and biomass of mixotrophic flagellate Dinobryon sertularia Ehrenberg (Chrysophyceae) in Derbent reservoir (Samsun, Turkey). Turkish Journal of Fisheries and Aquatic Science, vol. 10, no. 3, p. 305-313.
VEGA, C., JAMBRINA, C., SAJA, R., BECARES, E., FERNÁNDEZ, C. and FERNÁNDEZ, M., 2007. Aspectos limnológicos de estanques para la producción intensiva de tenca (Tirica tinca). Limnética, vol. 26, no. 1, p. 173-182.