Diversity and Distributions, (Diversity Distrib.) (2009) 15, 390– 400
B I O D I V E R S I T Y
R E S E A R C H
ABSTRACT
Aim To relate the recent Iberian lynx decline to changes in the distribution of the European rabbit after the haemorrhagic disease outbreak of 1989. As Iberian rabbits evolved in two geographically separated lineages, being the recent lynx range practically restricted to the southwestern lineage, we also test if differential range dynamics exists for these lineages, with the consequent implications for lynx conservation and reintroduction planning.
Location The Iberian Peninsula.
Methods We modelled environmental favourability for the lynx based on its dis-tribution before 1989, and for the rabbit using disdis-tribution data collected primarily after 1989, and validated them using independent abundance data. We compared both models and combined them in a lynx occurrence forecast. We correlated the prevalence of southwestern rabbit lineage with the environmental favourability for the rabbit.
Results The environmental lynx model correlated with past lynx abundance data, but did not reflect its recent strong range contraction. The rabbit model correlated with recent rabbit abundance, but was negatively correlated with the environmental model for the lynx. The combination of both models forecasted lynx occurrence in a few separated nuclei, which encompass all recent lynx records. The prevalence of rabbit’s southwestern lineage correlated negatively with favourability for the rabbit.
Main conclusions The region to which the lynx became confined before 1989 is currently less favourable for rabbits, whereas more favourable areas remain outside lynx reach. This differential favourability correlates with rabbit phylogeographical structure, suggesting that the southwestern lineage is facing more unfavourable conditions or is less resilient to recent diseases. The loss of concordance between lynx distribution and the whole rabbit phylogeographical structure has prevented lynx persistence in northeastern rabbit lineage areas, which should be considered in lynx reintroduction planning. Similar conservation problems could affect other ecologically interacting species whose distributions’ overlapping has sharply diminished.
Keywords
Distribution changes, Lynx pardinus, Oryctolagus cuniculus, predator–prey interactions, reintroduction planning, spatial models.
INTRODUCTION
Spellerberg & Sawyer (1999) pointed out that, since biogeo-graphical research improves our understanding of species
distribution patterns and the processes that cause and maintain them, biogeographical principles, theories and analyses can be applied to problems concerning the conservation of biodiversity.
Lomolino (2004) and Whittaker etal. (2005) promoted applied
1
Laboratorio de Biogeografía, Diversidad y Conservación, Departamento de Biología Animal, Facultad de Ciencias, Universidad de Málaga, 29071 Málaga, Spain, 2
Department of Biological Sciences, Imperial College London, Silwood Park Campus, Ascot SL5 7PY, UK,
3
Unidade de Macroecologia e Conservação, Centro de Ecologia Aplicada, Universidade de Évora, 7000-730 Évora, Portugal,
4
Departamento de Biología de la Conservación, Estación Biológica de Doñana, CSIC, Avenida María Luisa s/n, 41013 Sevilla, Spain
*Correspondence: Raimundo Real, Laboratorio de Biogeografía, Diversidad y Conservación, Departamento de Biología Animal, Facultad de Ciencias, Universidad de Málaga, 29071 Málaga, Spain. E-mail: rrgimenez@uma.es
Blackwell Publishing Ltd
Conservation biogeography of
ecologically interacting species:
the case of the Iberian lynx and
the European rabbit
Raimundo Real
1*, A. Márcia Barbosa
1,2,3, Alejandro Rodríguez
4,
Mismatch in lynx and rabbit ranges biogeography as an area of central importance in conservation
planning, and proposed a new concept, conservation biogeography, as a key subfield for conservation biology. Indeed, a biogeographical perspective may help to understand broad-scale conservation problems. In particular, differential range dynamics of ecologically interacting species (predator–prey, mutualists, competitors, host-parasite ... ) may have important consequences for their viability prospects. We explore the value for predator conservation of maintaining a range encompassing all the genetic diversity of prey populations, by addressing the biogeographical relationship between a species of great conservation concern, the Iberian lynx
Lynx pardinus (Temminck, 1827), and its staple prey, the European
rabbit (Oryctolagus cuniculus L., 1758).
The Iberian lynx, a top predator endemic to the Iberian Peninsula (SW Europe), has undergone a severe decline in the second half of the 20th century (Delibes etal., 2000) and is currently considered the world’s most threatened felid (Nowell & Jackson, 1996). Despite protective legislation and many efforts made during the last decades to reverse the decline of lynx populations, the species has continued to diminish in numbers and in distribution range (Guzmán etal., 2002, 2004; Rodríguez & Delibes, 2002, 2003, 2004). The last census estimated that about 160 lynxes survive in two separated reproductive populations (Guzmán etal., 2004). Lynx reproductive success depends on thresholds in the abundance of the European rabbit (Palomares etal., 2001), which has also been declining in the Iberian Peninsula, especially after the spread of myxomatosis in the 1950s and the rabbit haemorrhagic disease in the late 1980s (Villafuerte etal., 1995; Cooke, 2002). Therefore, it is widely recognized that, at a local scale, lynx occur-rence is largely determined by rabbit abundance, and that no conservation plan for the lynx can be successfully implemented without parallel plans for the local management of the rabbit (Delibes etal., 2000; Palomares etal., 2001; Ferrer & Negro, 2004).
The Iberian lynx and the European rabbit are also closely related at broad temporal and spatial scales. Both originated in the Iberian Peninsula at approximately the same time and are linked to western European Mediterranean environments (Branco etal., 2000; Johnson etal., 2004; López Martínez, 2008), though phylogeographical analyses have shown that Iberian rabbits evolved in two clearly divergent lineages that are geo-graphically segregated (Branco etal., 2000; Branco & Ferrand, 2003; Geraldes etal., 2005). Such phylogeographical structure, i.e. the geographical pattern in intraspecific genetic lineages, is lacking in known lynx populations (Johnson etal., 2004).
At intermediate spatial (40,000 km2) and temporal (from 1950
to 1985) scales, Rodríguez & Delibes (2002, 2003, 2004) found that a number of factors not always related with rabbit abundance, such as changes in land uses, habitat fragmentation, spatial structure of populations and non-natural mortality derived from game activities, contributed to the range restriction of lynx. By 1980, the lynx’s range was constrained to those areas where the pressure of these non-trophic detrimental factors had been relatively low and rabbit densities were sufficient. These areas are all within the range of rabbit’s southwestern lineage.
In this paper we test the hypothesis that the drastic contraction of the Iberian lynx range during the last 20 years has been driven
by changes in the distribution of the European rabbit in Spain after the rabbit haemorrhagic disease outbreak of 1989. We also test if differential range dynamics exist for the two rabbit lineages, with the consequent implications for lynx conservation and reintroduction planning.
METHODS
General methodological approach
To reach the above-mentioned objectives we: first, built a distribution model for the Iberian lynx based on data from before the last rabbit population crash using non-trophic environmental variables; second, built a model for the rabbit based on distribution data mostly collected after the beginning of this population crash, to be used as a current trophic favourability model for the lynx; third, validated the models by contrasting them with independent abundance data; fourth, compared both models to establish their degree of agreement, and combined them in a lynx occurrence forecast (based on both environmental and trophic favourability) to be compared with the latest lynx records; and fifth, related these results to the phylogeographical structure of rabbit populations.
Distribution data and predictor variables
Spain covers nearly 85% of the Iberian Peninsula and includes probably all the current distribution range of the Iberian lynx (Guzmán etal., 2004; Sarmento etal., 2005). The Atlas of the Terrestrial Mammals of Spain (Palomo & Gisbert, 2002) gathered distribution records of various sources from 1980 to 2000. Lynx presence was reported in 333 (6.4%) of the 5167 Universal
Trans-verse Mercator (UTM) 10 × 10-km grid cells of mainland Spain,
all in the southwestern quadrant (Fig. 1). However, most of these presences were recorded between 1980 and 1988 (Rodríguez & Delibes, 1990) and few were detected in more recent surveys
(Guzmán etal., 2002, 2004). The rabbit was reported in 3335
(nearly 65%) of the UTM cells (Palomo & Gisbert, 2002; Fig. 2), with a high proportion of these records collected after the emergence of the rabbit haemorrhagic disease in 1989 (Blanco & Villafuerte, 1993; Villafuerte etal., 1998). Thus, most of the distri-bution data of lynx and rabbit in the atlas are temporally separated by an important event that affected both species. This enables building an environmental favourability model for the lynx based on its distribution before the main decline of the rabbit and an environmental favourability model for the rabbit based on its distribution after the beginning of this decline in 1989. An environ-mental favourability model refers to the environenviron-mental con-ditions that meet the physiological, ecological and behavioural requirements of a species, which normally include food availability. In contrast, a trophic favourability model refers specifically to food availability. In this case, as the rabbit is the lynx’s staple prey, the environmental favourability model for the rabbit can be used as a current trophic favourability model for the lynx. This may help to relate, on a broad scale, the recent drastic reduction in the lynx range to either non-trophic factors or the decline of the rabbit.
R. Real et al.
We recorded 27 predictor variables related to location, topography, climate, lithology and human activity (Table 1). The variables related to location, topography and lithology are invariant before and after 1989. The climatic data are from records of several (generally around forty) years between 1956 and 1999, and are mostly considered to be representative of present climatic conditions (Font, 1983, 2000). As for the human variables (taken from I.G.N., 1999), major urban centres have been the same throughout the study period. Some of the high-ways were built after 1989, but were already major roads before then, so the analysed highways may be representative of the maintenance or increase of human activity. Therefore, all these variables have not changed significantly during the study period and are suitable for modelling both lynx and rabbit data. Variables were digitized from the original sources using CartaLinx 1.2
(Clark Labs), processed using Idrisi32 (Clark Labs) at a 1 × 1-km resolution, and averaged to give values on UTM 10 × 10-km grid cells (for details see Barbosa etal., 2003; Muñoz etal., 2005).
The variables were chosen on the basis of availability at this scale and potential predictive power, and could be correlated with more local causal factors. Climate, lithology or topography, for example, could affect species through their effect on vegetation, and the distance to major cities and highways could be surrogates for different forms of local human disturbance. Latitude and longi-tude were included to take into account the non-environmental spatial structure in the distribution of the species, which is functional in ecosystems and should be included in distribution models (Legendre, 1993). The inclusion of spatial variables in a model can reveal a geographical trend in distribution that does not reflect the spatial structure of the environmental predictor
Figure 1 Distribution of the Iberian lynx Lynx pardinus (left) and the European rabbit Oryctolagus cuniculus (right) in mainland Spain represented on a Universal Transverse Mercator 10 × 10-km grid. Black squares indicate presences recorded between 1980 and 2002 (after Palomo & Gisbert, 2002).
Figure 2 Environmental favourability for the Iberian lynx Lynx pardinus and the European rabbit Oryctolagus cuniculus in mainland Spain based on a Universal Transverse Mercator 10 × 10-km grid, according to the environmental favourability models obtained (Tables 2 and 3, respectively).
Mismatch in lynx and rabbit ranges
variables (Borcard etal., 1992), and thus could be attributed to historical events or to contagious biotic processes such as migration (Legendre, 1993; Barbosa etal., 2001; Real etal., 2003).
Since the presence probability of both species was affected by the differences in size among UTM grid cells (logistic regression of presence/absence on cell area, P < 0.001), we used only complete
100 km2 squares (n = 4443, with 302 lynx and 2938 rabbit
presences) to build the species’ distribution models, and then applied these to the whole territory.
Distribution modelling
We modelled absence data together with presences because absences may be due to ecological, historical or anthropogenic reasons, all of which are relevant factors in conservation biogeo-graphy. Part of the absences depicted in the Atlas is likely due to uneven or insufficient sampling. Some authors recommend the use of profile methods on the basis that they are supposedly not affected by false absences (Hirzel etal., 2001). Spatially structured false absences, due to geographically biased sampling effort, do reduce model prediction reliability, but also affect profile methods,
which are sensitive to true presences that are missing, i.e. false absences. Following the suggestion of Lobo & Martín-Piera (2002), we took the total number of records of all species reported in the atlas for each UTM cell as measures of sampling effort, and used them to control the possible effect of spatially structured false absences on our results.
To select a set of significant predictors for each species distribu-tion, we related each of the variables separately with the species’ presence/absence data using logistic regression. To control the increase of type I error under repeated testing (i.e. the familywise error rate, FWER), García (2003) recommended evaluating the false discovery rate (FDR). We controlled the FWER using the procedure for all forms of dependency among test statistics (Benjamini & Yekutieli, 2001) under an FDR value of q = 0.05. This procedure orders the variables according to decreasing significance (increasing P-value), being i the position of each variable in this ordered list, and only accepts variables up to the highest i position whose P-value is lower than i/V * q/Σ(1/i), where V is the total number of variables analysed.
We used the set of the significant variables obtained for each species as starting point to build a multivariate environmental
Table 1 Environmental variables used to model the distributions of the Iberian lynx (Lynx pardinus) and the European rabbit (Oryctolagus cuniculus) in Spain.
Code Variable
Alti Mean altitude (m)*
ARan Altitude range (m) (= AMax – AMin)
Slop Slope (degrees) (calculated automatically from Alti) HJan Mean relative air humidity in January at 07 : 00 hours (%)† HJul Mean relative air humidity in July at 07 : 00 hours (%)† HRan Annual relative air humidity range (%) (= |HJan – HJul|) PET Mean annual potential evapotranspiration (mm)†
AET Mean annual actual evapotranspiration (mm) (= min[PET; Prec]) Inso Mean annual insolation (hours/year)†
SRad Mean annual solar radiation (kwh/m2/day)†
TJan Mean temperature in January (°C)† TJul Mean temperature in July (°C)† Temp Mean annual temperature (°C)†
TRan Annual temperature range (°C) (= TJul–TJan)
DPre Mean annual number of days with precipitation ≥ 0.1 mm2
DFro Mean annual number of frost days (minimum temperature ≤ 0 °C)† Prec Mean annual precipitation (mm)†
MP24 Maximum precipitation in 24 h (mm)† RMP Relative maximum precipitation (= MP24/Prec) PIrr Pluviometric irregularity‡
ROff Mean annual run-off (mm)§
Lati Latitude (degrees N)¶
Long Longitude (degrees E)¶
DHi Distance to the nearest highway (km)¶
U100 Distance to the nearest town with more than 100,000 inhabitants (km)¶ U500 Distance to the nearest town with more than 500,000 inhabitants (km)¶
Perm Soil permeability§
Sources: *US Geological Survey (1996). †Font (1983, 2000). ‡Montero de Burgos and González-Rebollar (1974). §IGME (1979). ¶IGN (1999); population of cities taken from the Instituto Nacional de Estadística (National Institute of Statistics; http://www.ine.es).
R. Real et al.
model for the lynx and another for the rabbit using the favourability function described by Real et al. (2006), which may be written as follows:
where n1 and n0 are the numbers of presences and absences,
respectively, e is the basis of the natural logarithm, and y is a logit function combining several variables and obtained using logistic regression. Basically, it is a generalized linear model that assesses the local variations in presence probability with respect to the overall species prevalence. This makes the models independent of the species’ presence/absence ratio in the study area, enabling direct model comparison and combination when more than one species are involved (see also Estrada et al., 2008; Real et al., 2008). This use is different from that proposed by Albert & Thuiller (2008), who modified this function to obtain the probability of occurrence of a species in a study area starting from that obtained in a smaller sample, when the true prevalence of the species in the whole area is known. The logit function was obtained using a forward-backward stepwise procedure for variable selection. At each step only a variable with a significant additional contribution to the model, according to the Wald test, was added, i.e. a variable was not accepted unless it was significantly related to the residuals not accounted for by other variables. The combination of stepwise selection and FDR control guarantees that every variable included in the model is significantly related to the distribution of the species independent of the effect of other variables in the model. This is a useful and effective tool to infer distribution patterns inductively from observed data when no theory or previous hypotheses exist about the importance of each variable (Guisan & Zimmermann, 2000). As multicollinearity may render some variables redundant in the interpretation, we checked that Kendall’s Tau-b rank correlation between potentially redundant variables included in the models was lower than 0.8 (Jiménez-Valverde & Lobo, 2006; Real et al., 2008) before inter-preting them separately. We also checked the variance inflation factors (VIF) of the variables included in the models.
Since the stepwise procedure tends to yield successively more complex models, we evaluated the parsimony of the models produced by each step using the Akaike Information Criterion (AIC; Akaike, 1973; Burnham & Anderson, 2002). Notwithstanding the current controversy about the use of null hypothesis testing (NHT) versus information theory (IT) approaches (see Stephens
et al., 2005, 2007; Lukacs et al., 2007), we used both at two different
stages of the analyses, NHT for inductive model building and IT for model comparison, which respects the assumptions of both NHT and IT. We also tested the power of the models to explain the spatial trends of each species by comparing the models’ AIC values with those obtained in the corresponding trend surface analysis using a full third degree polynomial of longitude and latitude (Legendre & Legendre, 1998).
To evaluate the discrimination capacity of the models in the whole territory, we tested the significance of the area under the
receiver operating characteristic curve (AUC) values (Metz & Kronman, 1980). As Lobo et al. (2008) have shown, actual AUC values do not provide information about the good performance of the model, but rather about the generalist or restricted distribution of the species along the range of predictor conditions.
Model validation
Model predictions were validated by comparison with independent species abundance data. Pearson’s parametric correlations were used when there was no evidence against a normal distribution of the data (Kolmogorov–Smirnov test, P < 0.01). Otherwise, a non-parametric coefficient (Kendall’s Tau-b rank correlation) was used.
To test the lynx’s environmental model we analysed the correlations between the obtained favourability values and historical (from 1950 to 1985, N = 397 UTM squares) lynx abundance data at four stages of this species’ range contraction, obtained by Rodríguez & Delibes (2002) from the density of sightings and mortalities. The latter was independent information on lynx abundance which was not reflected in the Atlas. To check if the rabbit model reflected recent rabbit abundance in lynx areas, we analysed Kendall’s rank correlation between the rabbit favourability values and the results of a rabbit field survey
performed during 2000–2001 in 323 complete 100 km2 UTM
squares within the region of former lynx occurrence (SW Spain), in which rabbit pellet-pile counts obtained in 8-h walking transects within a 2-m-wide strip were used to obtain a relative abundance index from 1 (absent, no pellet piles) to 5 (very abundant, more than 100 pellet piles) (see Guzmán et al., 2004). All correlations between suitability and abundance values were carried out considering only the cells with abundance values.
Comparison and combination of the lynx and rabbit models
We compared the lynx’s environmental model with the rabbit model by means of Kendall’s correlation analyses between the predicted favourability values, both in all mainland Spain and within the lynx’s occurrence area as reported in the atlas. We also performed a Kendall’s partial rank correlation analysis between the two models controlling for the total number of records to minimize the effect of a possible bias in the atlas sampling effort.
As lynx occurrence requires both the maintenance of favourable non-trophic conditions and the presence of enough rabbits, we combined the environmental model for the lynx and the rabbit model to yield prospective lynx occurrence areas. Favourability values can be used in fuzzy logic operations (Real et al., 2006; Estrada et al., 2008), so we estimated the favourability for lynx persistence by calculating the fuzzy intersection between the lynx and rabbit favourability models (which means favourability for simultaneous presence and corresponds to the minimum favourability value between the two species at each UTM cell; Yager & Zadeh, 1992). We displayed the results on the UTM
10 × 10-km cells where lynx occurrence was reported in the
atlas. F e n n e y y , = + 1 0
Mismatch in lynx and rabbit ranges
Comparison with rabbit phylogeography
We looked into a possible relationship between environmental favourability for the rabbit and the distribution of the two rabbit lineages in the Iberian Peninsula based on cytochrome b data (Branco et al., 2000), which entailed the inclusion of Portugal to take into account a sizable part of the distribution of the south-western rabbit lineage. We built an environmental favourability model for the rabbit in Spain with the variables available for the whole Iberian Peninsula (all except pluviometric irregularity, run-off and soil permeability), and extrapolated it to the 10 × 10-km UTM cells of continental Portugal. As phylogeographical data were available in variable but generally coarse spatial detail, we took provinces as spatial units and calculated the proportion of rabbits of each lineage (Branco et al., 2000) and the mean environ-mental favourability for the rabbit in each province. We then analysed Pearson’s correlation between the proportion of southwestern-lineage rabbits and environmental favourability for the rabbit.
RESULTS
Distribution models
The parameters of the final model obtained for each species are shown in Tables 2 and 3, respectively. AIC values showed that, for both species, the final model was more parsimonious than every simpler intermediate model obtained during the stepwise procedure. AIC values of the spatial models resulting from trend surface analysis for the lynx and the rabbit were poorer (ΔAIClynx = 76.5 and ΔAICrabbit = 21.0, respectively) than those
of the corresponding environmental models. Consequently, the environmental models accounted for the spatial trends of the species better than the smoothing of data using a third degree polynomial of the spatial variables. All the variables had VIF values lower than 10 for both species (Tables 2 and 3). Variables related to environmental energy, such as solar radiation, actual evapotranspiration and insolation, affect both species in a similar way, whereas variables related to spatial location and the stability of precipitation, such as latitude, pluviometric irregularity, number of days with precipitation and longitude, have opposite effects on lynx and rabbit favourability (Tables 2 and 3).
Environmental favourability values for the lynx and the rabbit as predicted by the models are represented in Fig. 2. The discrimination capacity in the whole territory was highly significant for both models, although lower for the rabbit (AUClynx = 0.923, P < 0.001; AUCrabbit = 0.705, P < 0.001), in
accordance with the more generalist distribution of the latter along the range analysed. The environmental lynx model does not foresee the strong decline in lynx distribution that has occurred after 1989.
Model validation
Kendall’s correlation analysis between our lynx environmental favourability model and the lynx abundance data at four stages of
its range contraction (Rodríguez & Delibes, 2002) gave significant positive results for all stages, with lower significance in more recent years: Tau-b = 0.137 (P = 0.00027) in 1950; Tau-b = 0.139 (P = 0.00020) in 1965; Tau-b = 0.128 (P = 0.00065) in 1975; and
Tau-b = 0.088 (P = 0.024) in 1985. The correlation between rabbit
environmental favourability and current rabbit abundance in lynx areas was also positive and significant (Tau-b = 0.104,
P = 0.016).
Table 2 Variables included in the best Iberian lynx (Lynx pardinus) environmental favourability model and their coefficients (β), standard errors (SE), variance inflation factor (VIF), Wald test values and significance level (P). The variables are ranked according to their order of entrance in the model. Variable codes as in Table 1.
Table 3 Variables included in the best rabbit (Oryctolagus cuniculus) environmental favourability model and their coefficients (β), standard errors (SE), variance inflation factor (VIF), Wald test values and significance level (P). The variables are ranked according to their order of entrance in the model. Variable codes as in Table 1.
Variable β SE VIF Wald P
Lati –0.602 0.201 9.359 8.939 < 0.01 PIrr –0.489 0.056 4.969 75.938 < 0.001 HJul –0.041 0.016 2.393 6.172 < 0.05 DHi 0.015 0.003 1.326 20.830 < 0.001 SRad 0.072 0.013 8.241 32.180 < 0.001 AET 0.003 0.001 1.832 20.983 < 0.001 MP24 0.011 0.002 1.866 21.134 < 0.001 TJul 0.365 0.061 8.369 35.901 < 0.001 U500 0.011 0.002 1.571 36.956 < 0.001 DFro 0.045 0.008 6.110 16.810 < 0.001 Alti –0.002 0.001 6.711 31.348 < 0.001 Slop 0.155 0.045 2.946 11.719 < 0.001 DPre –0.037 0.009 6.450 15.401 < 0.001 Long –0.366 0.099 2.649 13.532 < 0.001 Inso –0.003 0.001 9.223 10.821 < 0.01 Constant –1.571 14.003 0.013 > 0.05
Variable β SE VIF Wald P
Long 0.18 0.020 2.070 79.27 < 0.001 U100 –0.012 0.0012 1.226 99.69 < 0.001 PIrr 0.20 0.018 4.819 131.25 < 0.001 Perm 0.35 0.046 1.116 59.026 < 0.001 DPre 0.017 0.0033 7.660 28.095 < 0.001 Lati 0.25 0.044 6.312 32.59 < 0.001 SRad 0.0094 0.0021 6.668 19.61 < 0.001 Prec –0.00080 0.00019 4.543 17.22 < 0.001 AET 0.0016 0.00040 2.381 15.63 < 0.001 Inso –0.00062 0.00022 5.782 7.76 < 0.01 RMP 1.43 0.57 2.640 6.25 < 0.05 Constant –19.052 2.64 52.048 < 0.001
R. Real et al.
Comparison and combination of the lynx and rabbit models
The favourability model for the rabbit, based on its distribution mostly after 1989, correlates negatively with the lynx model, both in all the UTM cells of mainland Spain (Tau-b = –0.133,
P < 0.001, N = 5167) and in the cells with lynx records in the
atlas (Tau-b = –0.217, P < 0.001, N = 333). Partial correlation between the two models controlling for sampling effort was still negative, both in all mainland Spain (Tau-b = –0.117, N = 5167) and within the lynx reported range (Tau-b = –0.224, N = 333).
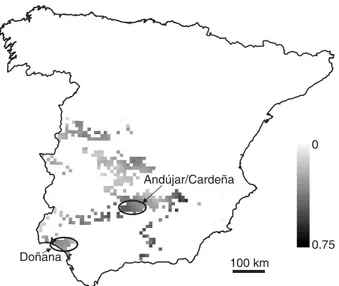
In Fig. 3 we show the lynx occurrence forecast according to the
combined (environmental ∩ rabbit) model. The prospect of
occurrence is generally low, and the areas with higher values are separated, which does forecast a sharp reduction and fragmentation of the lynx’s distribution range.
Comparison with rabbit phylogeography
The mean environmental favourability obtained for the rabbit in all Iberian provinces and the relative proportions of rabbits of each lineage in the provinces analysed by Branco et al. (2000) are shown in Fig. 4. The correlation between the proportion of rabbits of southwestern lineage and environmental favourability for the species was significantly negative (r = –0.669, P < 0.01,
n = 17), which means that environmental favourability for rabbits
is lower where the southwestern lineage predominates.
DISCUSSION
Relationship between models and abundance
The positive correlations between predicted favourability and independently observed abundance for both lynx and rabbit corroborate the existence of a relationship between abundance
and the favourability models. However, it is striking that the environmental lynx model is more correlated with lynx abundance in 1950 than in 1985, even when the modelled environmental conditions were selected due to their relation to the more recent lynx data (Atlas distribution data were stated to be from 1980–2000; Palomo & Gisbert, 2002). Between these years, lynx abundance declined smoothly (Rodríguez & Delibes, 2002), and our results suggest that that decline affected particularly the most environ-mentally favourable areas. Consequently, the cause of this smooth decline could not be attributed to the modelled variables, but probably to a change in the situation of the rabbit during that
Figure 4 Proportion of rabbits of each lineage in the provinces analysed by Branco et al. (2000), and mean environmental favourability obtained for the species in all Iberian provinces.
Figure 3 Lynx pardinus occurrence forecast according to the combined (trophic ∩ non-trophic) model, in the Spanish Universal Transverse Mercator 10 × 10-km grid cells with lynx records before 1989. Encircled are the areas with current reproducing lynx populations according to Guzmán et al. (2002, 2004).
Mismatch in lynx and rabbit ranges period of time, possibly caused by the emergence of myxomatosis
in the mid-1950s (see also Rodríguez & Delibes, 2003). Other causes might include lynx non-natural mortality or spatial structure of lynx populations (Rodríguez & Delibes, 2004).
Notwithstanding this, lynx favourable areas must have also been sufficiently favourable for its staple prey, which is funda-mental for lynx presence, so the environfunda-mental lynx model had to implicitly include enough rabbit availability up to 1980, the earliest time limit of the reported lynx records (Rodríguez & Delibes, 1990). This is probably why it does not suggest the sharp lynx decline that has taken place recently, which indicates that something not accounted for in the model occurred after 1980 and caused the decline.
The rabbit model has been shown to reflect recent rabbit abundance in former lynx areas and, thus, may be used as a current trophic favourability model for the lynx.
The lynx occurrence forecast versus observed distribution changes
The prediction of reduction and fragmentation of the lynx’s range (cf. Figs 1 and 3) is in accordance with the known recent data: the only two regions where reproducing lynx populations are known to currently occur (Guzmán et al., 2002, 2004) are Andújar-Cardeña, in south-central Spain, where the lynx occurrence forecast is relatively high in a nucleus of several adjacent cells (Fig. 3), and the Doñana National Park in the south-west, for which the occurrence forecast is not so high but where lynxes are highly protected. Other high occurrence forecasts are mostly in isolated or peripheral cells that would hardly sustain viable lynx populations.
The disagreement between the lynx and rabbit models
The consistently negative associations between the environmental lynx model and current rabbit favourability suggest that the rabbit decline after 1989 has especially affected the areas to where the lynx had become restricted by the half of the 20th century. Consequently, the lynx environmental model no longer implies rabbit availability, but only non-trophic favourable conditions for the lynx, which might be at the origin of the recent local lynx extinctions that occurred almost simultaneously in many parts of its range.
Our results also suggest that rabbits are currently scarcer within the lynx areas than in more eastern and northern parts of the Iberian Peninsula. This occurs despite the fact that lynxes are known to have positive effects on rabbit populations by control-ling smaller predator populations (Palomares et al., 1995), although this indirect interaction perhaps operates only at high lynx densities. Possible causes of this differential decline include climatic changes, shifts in land use, the emergence of rabbit diseases, and other factors, including the spatial genetic structure of the rabbit (see below), that may act with certain spatial auto-correlation. For example, vector-transmitted diseases, such as myxomatosis, could be more virulent in the humid west, which
may hold more vector insects than the drier east; according to Cooke (2002) the initial impact of the rabbit haemorrhagic disease seemed to be influenced by climate, as Spanish rabbits have recovered better in warmer, dryer areas. Another possibility is that rural abandonment during the last decades favoured the recovery of eastern rabbit populations, while in the western mountainous areas, due to their wetter climate, it led to an increase in continuous forests and scrublands (Fernández-Alés
et al., 1992), favouring big game species such as the red deer and
the wild boar instead of the rabbit.
Our model for lynx occurrence forecast, which combines these opposite trends in trophic and non-trophic factors, does predict a sharp reduction and fragmentation of the lynx’s range after 1989, which is consistent with the species’ current situation (Guzmán et al., 2002, 2004; Palomares & Rodríguez, 2004). This seems to indicate that a widespread decrease in favourability for the rabbit in lynx areas, but not in the rest of Spain, may help to explain the simultaneous crash of lynx populations throughout its distribution range.
The role of rabbit phylogeographical structure
As previously indicated, our results do suggest that genetic characteristics of rabbit populations could also be playing a key role in this geographical trend. The phylogeographical analyses of Branco et al. (2000) showed that rabbits from the southwestern and the northeastern halves of the Iberian Peninsula have evolved in two divergent lineages with different evolutionary and demographic histories (Branco & Ferrand, 2003). Possible explanations for the lower environmental favourability for rabbits in the southwestern lineage area might include a different ecology of both lineages (derived from their evolution in different biogeographical areas), and the model mainly reflecting favourability for the northeastern lineage. Another explanation could be that large empty areas in the rabbit distribution map within the southwestern lineage (Fig. 1) were actually false negatives, but our results remained significant after controlling for a possible bias in false negatives. It is also possible that the genetic differences in the rabbit could result in differential vulnerability to diseases or other environmental hazards.
In any case, the lynx’s original distribution allowed it to rely on both rabbit lineages (Rodríguez & Delibes, 1990), but since it has become restricted to the southwestern quadrant of the Iberian Peninsula, lynx populations depend now on the southwestern lineage. Human and spatial variables were significant predictors of lynx distribution, which suggests that human pressure and historical events, rather than rabbit scarcity, may have played an important role in restricting the lynx to the southwestern quadrant of Spain. This increased environmental uncertainty for the lynx, because for a specialist predator relying on all the genetic diversity of its staple prey may be a key biogeographical strategy regarding long-term survival. Being an r-strategist, the rabbit may endure adverse circumstances and then thrive when conditions get better, but a k-strategist predator such as the lynx might become locally extinct if rabbit recovery delays too much. If, during a certain period of time, a deleterious event hits rabbit’s southwestern
R. Real et al.
lineage more severely than the northeastern one, the lynx could be pushed to the verge of extinction, when this could be avoided if both rabbit lineages were within reach. The negative relation-ship shown here between environmental favourability for the rabbit and the prevalence of the southwestern lineage is a sign that it is indeed facing more adverse conditions than the northeastern lineage, or that it is less resilient to current diseases. In fact, Blanco & Villafuerte (1993) found that the rabbit haemorrhagic disease had less severe effects on central-eastern Iberian populations, where rabbit densities were higher and most individuals belonged to the northeastern lineage (Branco et al., 2000).
The need to restore the concordance between lynx range and rabbit phylogeographical structure
The Iberian lynx and the European rabbit are historically related species, since they share the same geographical origin and for a long time have interacted ecologically. This implies that a complex network of interrelationships may have emerged between them, and it is not easy to replace one of the species with another with a similar ecological role, or to remedy the scarcity of rabbit with an artificial intervention to supply food.
Our results suggest that, although at large (historical, phylo-geographical) and small (ecological) scales lynxes are highly associated with rabbits, at intermediate (current biogeographical) scale human and environmental constraints, including diseases or change in climate or land use, are pushing their distributions in opposite directions, a situation in which the lynx is clearly jeopardized. One solution to this dilemma could be to restore the original concordance between lynx biogeography and the whole rabbit phylogeographical structure, i.e. restore the overlapping between the distributions of the two species. We mean that it is not enough that the distribution of the lynx is included in the rabbit range; it should cover most of the distribution of the rabbit in the Iberian Peninsula, or at least include both of its main genetic lineages. As Lomolino (2004) pointed out, to conserve species we need to conserve their distributions, which constitute their geographical, ecological and evolutionary context.
This is a case where conservation biogeography is particularly useful in reintroduction planning, showing that the spatial genetic structure of populations with which the focal species interacts might be worth of consideration in guidelines for reintroductions (IUCN, 1998). Our results suggest that some areas of good habitat quality and healthy northeastern-lineage rabbit populations could be considered for lynx reintroduction, even if they are not the most recently inhabited by lynxes. Even if rabbits of northeastern lineage were more resistant to diseases (which is not currently confirmed), this should be preferred to translocating northeastern-lineage rabbits to the southwestern-lineage territory, since rabbit phylogeography responds to a natural evolutionary process and thus should be preserved according to conservation biology principles (Delibes-Mateos et al., 2008). In addition, the degree of genetic differentiation between the two lineages (Branco et al., 2000; Geraldes et al., 2005) might result in reduced inter-fertility and further hinder rabbit recovery.
Concluding remarks
Adding a biogeographical dimension to predator–prey relation-ships may suggest novel conservation proposals. Our approach suggests that the lynx was restricted to the south-west of Spain along a process of centuries, whereas the rabbit has changed in favourability more recently due to changes in environment or diseases. This reveals an instance of how purely biogeographical events affecting two different species at different temporal scales may have a profound effect on their conservation. We believe the present study is an example of conservation biogeography sensu Whittaker et al. (2005), since the context, scale, methods, results and conservation proposals are all of a biogeographical nature. Most of what was said here may also be applicable to the Iberian imperial eagle (Aquila adalberti C. L. Brehm, 1861), another endangered rabbit-specialist predator that has become restricted to the Iberian south-west (Ferrer & Negro, 2004). Analogous conservation issues may affect many other interacting species facing discrepancy between their current distributions.
ACKNOWLEDGEMENTS
M. S. Branco ceded us the rabbit phylogeographical data. A. M. Barbosa was supported by Fundação para a Ciência e a Tecnologia, Portugal (grants SFRH/BD/4601/e2001 and SFRH/BPD/40387/ e2007), and A. Rodríguez by a research contract financed by Consejería de Innovación, Ciencia y Empresa, Junta de Andalucía (Spain). This work was partially funded by projects REN2003-02471 and CGL2006-09567/BOS (Ministerio de Ciencia y Tecnología, Spain, and FEDER) and P05-RNM-00935 (Consejería de Innovación, Ciencia y Empresa de la Junta de Andalucía, Spain).
REFERENCES
Akaike, H. (1973) Information theory and an extension of the maximum likelihood principle. Proceedings of the Second
Inter-national Symposium on Information Theory (ed. by B.N. Petrov and
F. Csaki), pp. 267–281. Akadémia Kiadó, Budapest, Hungary. Albert, C.H. & Thuiller, W. (2008) Favourability functions versus
probability of presence: advantages and misuses. Ecography,
31, 417– 422.
Barbosa, A.M., Real, R., Márquez, A.L. & Rendón, M.A. (2001) Spatial, environmental and human influences on the distribu-tion of otter (Lutra lutra) in the Spanish provinces. Diversity
and Distributions, 7, 137–144.
Barbosa, A.M., Real, R., Olivero, J. & Vargas, J.M. (2003) Otter (Lutra lutra) distribution modeling at two resolution scales suited to conservation planning in the Iberian Peninsula.
Bio-logical Conservation, 114, 377–387.
Benjamini, Y. & Yekutieli, D. (2001) The control of the false dis-covery rate in multiple testing under dependency. Annals of
Statistics, 29, 1165–1188.
Blanco, J.C. & Villafuerte, R. (1993) Factores ecológicos que influyen
sobre las poblaciones de conejos. Incidencia de la enfermedad Hemorrágica. Internal report, ICONA, Madrid, Spain.
Mismatch in lynx and rabbit ranges Borcard, D., Legendre, P. & Drapeau, P. (1992) Partialling out the
spatial component of ecological variation. Ecology, 73, 1045 – 1055.
Branco, M. & Ferrand, N. (2003) Biochemical and population genetics of the rabbit, Oryctolagus cuniculus, carbonic anhydrases I and II, from the Iberian Peninsula and France.
Biochemical Genetics, 41, 391–404.
Branco, M., Ferrand, N. & Monnerot, M. (2000) Phylogeography of the European rabbit (Oryctolagus cuniculus) in the Iberian Peninsula inferred from RFLP analysis of the cytochrome
b gene. Heredity, 85, 307–317.
Burnham, K.P. & Anderson, D.R. (2002) Model selection and
multimodel inference. A practical information-theoretic approach, 2nd edn. Springer, New York.
Cooke, B.D. (2002) Rabbit haemorrhagic disease: field epidemio-logy and the management of wild rabbit populations. Revue
Scientifique et Technique – Office International Des Epizooties,
21, 347–358.
Delibes, M., Rodríguez, A. & Ferreras, P. (2000) Action plan for
the conservation of the iberian lynx in Europe (Lynx pardinus).
Council of Europe Publishing, Strasbourg, France.
Delibes-Mateos, M., Ramírez, E., Ferreras, P. & Villafuerte, R. (2008) Translocations as a risk for the conservation of European wild rabbit Oryctolagus cuniculus lineages. Oryx, 42, 259–264.
Estrada, A., Real, R. & Vargas, J.M. (2008) Using crisp and fuzzy modelling to identify favourability hotspots useful to perform gap analysis. Biodiversity and Conservation, 17, 857–871. Fernández-Alés, R., Martín, A., Ortega, F. & Alés, E.E. (1992)
Recent changes in landscape structure and function in a mediter-ranean region of SW Spain (1950–84). Landscape Ecology, 7, 3– 18.
Ferrer, M. & Negro, J.J. (2004) The near extinction of two large European predators: super specialists pay a price. Conservation
Biology, 18, 344–349.
Font, I. (1983) Atlas climático de España. Instituto Nacional de Meteorología, Madrid, Spain.
Font, I. (2000) Climatología de España y Portugal. Ediciones Universidad de Salamanca, Salamanca, Spain.
García, L.V. (2003) Controlling the false discovery rate in ecological research. Trends in Ecology and Evolution, 18, 553–554. Geraldes, A., Rogel-Gaillard, R. & Ferrand, N. (2005) High levels
of nucleotide diversity in the European rabbit (Oryctolagus
cuniculus) SRY gene. Animal Genetics, 36, 349–351.
Guisan, A. & Zimmermann, N.E. (2000) Predictive habitat distribution models in ecology. Ecological Modelling, 135, 147– 186.
Guzmán, N., García, F.J., Garrote, G., Pérez de Ayala, R. & Iglesias, M.C. (2002) Iberian lynx (Lynx pardinus) distribution and current conservation status in Spain 2000–02. International
Seminar on the Iberian Lynx, October 2002, pp. 16–18.
(Proceed-ings available online at http://lynx.uio.no/lynx/ibelynxco/ 01_information/1_7_conferences/andujar-I/andujar-I.htm). Andújar, Spain.
Guzmán, J.N., García, F.J., Garrote, G., Pérez de Ayala, R. & Iglesias, C. (2004) El lince ibérico (Lynx pardinus) en España y
Portugal. Censo-diagnóstico de sus poblaciones. Dirección General
para la Biodiversidad, Madrid, Spain.
Hirzel, A.H., Helfer, V. & Metral, F. (2001) Assessing habitat-suitability models with a virtual species. Ecological Modelling,
145, 111–121.
Instituto Geológico y Minero de España (IGME) (1979) Mapa
hidrogeológico nacional. Explicación de los mapas de lluvia útil, de reconocimiento hidrogeológico y de síntesis de los sistemas acuíferos, 2nd edn. IGME, Madrid, Spain.
Instituto Geográfico Nacional (IGN) (1999) Mapa de Carreteras.
Península Ibérica, Baleares y Canarias. IGN/Ministerio de
Fomento, Madrid, Spain.
IUCN (1998) IUCN guidelines for re-introductions. Prepared by the IUCN/SSC Re-Introduction Specialist Group. IUCN, Gland, Switzerland.
Jiménez-Valverde, A. & Lobo, J. (2006) Distribution determinants of endangered iberian spider Macrothele calpeiana (Araneae, Hexathelidae). Environmental Entomology, 35, 1491–1499. Johnson, W.E., Godoy, J.A., Palomares, F., Delibes, M., Fernandes,
M., Revilla, E. & O’Brien, S.J. (2004) Phylogenetic and phylo-geographic analysis of Iberian lynx populations. Journal of
Heredity, 95, 19–28.
Legendre, P. (1993) Spatial autocorrelation: trouble or new para-digm? Ecology, 74, 1659 –1673.
Legendre, P. & Legendre, L. (1998) Numerical ecology. Second English Edition. Elsevier, Amsterdam, the Netherlands. Lobo, J.M., Jiménez-Valverde, A. & Real, R. (2008) AUC: a
mis-leading measure of the performance of predictive distribution models. Global Ecology and Biogeography, 17, 145–151. Lobo, J.M. & Martín-Piera, F. (2002) Searching for a predictive
model for species richness of Iberian dung beetles based on spatial and environmental variables. Conservation Biology, 16, 158–173.
Lomolino, M.V. (2004) Conservation biogeography. Frontiers of
biogeography: new directions in the geography of nature (ed. by
M.V. Lomolino and L.R. Heaney), pp. 293–296. Sinauer Asso-ciates, Inc, Sunderland, Massachusetts.
López Martínez, N. (2008) The lagomorph fossil record and the origin of the European rabbit. Lagomorph biology: evolution,
ecology, and conservation (ed. by P.C. Alves, N. Ferrand and K.
Hackländer), pp. 27–46. Springer-Verlag, Berlin, Germany. Lukacs, P.M., Thompson, W.L., Kendall, W.L., Gould, W.R.,
Doherty, P.F. Jr, Burnham, K.P. & Anderson, D.R. (2007) Concerns regarding a call for pluralism of information theory and hypothesis testing. Journal of Applied Ecology, 44, 456 –460. Metz, C.E. & Kronman, H.B. (1980) Statistical significance tests for binormal ROC curves. Journal of Mathematical Psychology,
22, 218 –243.
Montero de Burgos, J.L. & González-Rebollar, J.L. (1974)
Diagramas bioclimáticos. ICONA, Madrid, Spain.
Muñoz, A.R., Real, R., Barbosa, A.M. & Vargas, J.M. (2005) Model-ling the distribution of Bonelli’s eagle in Spain: implications for conservation planning. Diversity and Distributions, 11, 477–486.
Nowell, K. & Jackson, P. (1996) Wild cats. Status survey and
R. Real et al.
Palomares, F., Delibes, M., Revilla, E., Calzada, J. & Fedriani, J.M. (2001) Spatial ecology of Iberian lynx and abundance of European rabbits in southwestern Spain. Wildlife Monographs,
148, 1–36.
Palomares, F., Gaona, P., Ferreras, P. & Delibes, M. (1995) Positive effects on game species of top predators by controlling smaller predator populations: an example with lynx, mongooses and rabbits. Conservation Biology, 9, 295–305.
Palomares, F. & Rodríguez, A. (2004) ¿Cuál es la situación real de las poblaciones de lince? Los retos medioambientales del siglo
XXI. La conservación de la biodiversidad en España (ed. by
M. Gomendio), pp. 63–76. Fundación BBVA, Bilbao, Spain. Palomo, L.J. & Gisbert, J., eds (2002) Atlas de los mamíferos
terrestres de España. Dirección General de Conservación de la
Naturaleza-SECEM-SECEMU, Madrid, Spain.
Real, R., Barbosa, A.M., Porras, D., Kin, M.S., Márquez, A.L., Guerrero, J.C., Palomo, L.J., Justo, E.R. & Vargas, J.M. (2003) Relative importance of environment, human activity and spatial situation in determining the distribution of terrestrial mammal diversity in Argentina. Journal of Biogeography, 30, 939–947.
Real, R., Barbosa, A.M. & Vargas, J.M. (2006) Obtaining environ-mental favourability functions from logistic regression.
Environmental and Ecological Statistics, 13, 237–245.
Real, R., Márquez, A.L., Estrada, A., Muñoz, A.R. & Vargas, J.M. (2008) Modelling chorotypes of invasive vertebrates in mainland Spain. Diversity and Distributions, 14, 364–373. Rodríguez, A. & Delibes, M. (1990) El lince Iberico en España.
Distribucion y problemas de conservacion. Colección Técnica,
ICONA, Madrid, Spain.
Rodríguez, A. & Delibes, M. (2002) Internal structure and patterns of contraction in the geographic range of the Iberian lynx.
Ecography, 25, 314–328.
Rodríguez, A. & Delibes, M. (2003) Population fragmentation and extinction in the Iberian lynx. Biological Conservation,
109, 321–331.
Rodríguez, A. & Delibes, M. (2004) Patterns and causes of non-natural mortality in the Iberian lynx during a 40-year period of range contraction. Biological Conservation, 118, 151– 161.
Sarmento, P., Cruz, J., Monterroso, P., Tarroso, P., Ferreira, C. & Negrões, N. (2005) Iberian lynx conservation in Portugal: dilemmas and solutions. Wildlife Biology in Practice, 1, 156– 162.
Spellerberg, I.F. & Sawyer, J.W.D. (1999) An introduction to
applied biogeography. Cambridge University Press, Cambridge,
UK.
Stephens, P.A., Buskirk, S.W., Hayward, G.D. & Martinez del Rio, C. (2005) Information theory and hypothesis testing: a call for pluralism. Journal of Applied Ecology, 42, 4 –12.
Stephens, P.A., Buskirk, S.W., Hayward, G.D. & Martinez del Rio, C. (2007) A call for statistical pluralism answered. Journal of
Applied Ecology, 44, 461– 463.
US Geological Survey (1996) Gtopo30. Land Processes Distributed Active Archive Center. http://edcdaac.usgs.gov/gtopo30/ gtopo30.asp.
Villafuerte, R., Calvete, C., Blanco, J.C. & Lucientes, J. (1995) Incidence of viral hemorrhagic disease in wild rabbit popula-tions in Spain. Mammalia, 59, 651–659.
Villafuerte, R., Viñuela, J. & Blanco, J.C. (1998) Extensive predator persecution caused by population crash in a game species: the case of red kites and rabbits in Spain. Biological Conservation,
84, 181–188.
Whittaker, R.J., Araújo, M.B., Jepson, P., Ladle, R.J., Watson, J.E.M. & Willis, K.J. (2005) Conservation biogeography: assessment and prospect. Diversity and Distributions, 11, 3–23. Yager, R.R. & Zadeh, L., eds (1992) An introduction to fuzzy logic applications in intelligent systems. The international
series in engineering and computer science, Vol. 165. Kluwer
Academic Publishing, Boston, Massachusetts. Editor: David Richardson