ABSTRACT: The flowering time is regarded as an important factor that affects yield in various crops. In order to understand how the molecular basis controlling main components of earli-ness in tomato (Solanum lycopersicum L.), and to deduce whether the correlation between fruit weight, days to flowering and seed weight, is caused by pleiotropic effects or genetic linkage, a QTLs analysis was carried out using an F2 interspecific population derived from the cross of S. lycopersicum and S. pimpinellifolium. The analysis revealed that most of the components related to earliness were independent due to the absence of phenotypic correlation and lack of co-localization of their QTLs. QTLs affecting the flowering time showed considerable variation over time in values of explained phenotypic variation and average effects, which suggested dominance becomes more evident over time. The path analysis showed that traits such as days to flowering, seed weight, and length of the first leaf had a significant effect on the expression of fruit weight, confirming that their correlations were due to linkage. This result was also confirmed in two genomic regions located on chromosomes 1 and 4, where despite showing high co-localization of QTLs associated to days to flowering, seed weight and fruit weight, the presence and absence of epistasis in dfft1.1 × dftt4.1 and fw1.1 × fw4.1, suggested that the linkage was the main cause of the co-localization.
Keywords: Solanum lycopersicum, QTLs, epistasis, days to flowering, path analysis 1College of Postgraduate – Dept. of Genetic Resources and
Productivity-Genetics, km 36.5 – Carr. México-Texcoco – 56230 – Texcoco, Estado de México – Mexico.
2Autonomous University of Puebla/School of Biology, Blvd. Valsequillo y Av. San Claudio – 72570 – 14 Puebla, Puebla – Mexico.
3CIIDIR/National Polytechnic Institute, Oaxaca. Hornos No. 1003 – 71230 – Santa Cruz Xoxocotlán, Oaxaca – Mexico. 4College of Postgraduate – Dept. of Socioeconomics – Statistics and Informatics.
*Corresponding author <rlobato@colpos.mx>
Edited by: Leonardo Oliveira Medici
Quantitative trait locus mapping associated with earliness and fruit weight in tomato
Aurelio Hernández-Bautista1, Ricardo Lobato-Ortiz1*, José Jesús García-Zavala1, Fernando López-Fortoso2, Serafín Cruz-Izquierdo1, José Luis Chávez-Servia3, Marisol Cadeza-Espinosa4
Received June 08, 2015 Accepted November 07, 2015
Introduction
Earliness is a characteristic that has grown in im-portance over the course of the history of plant breeding. This trait has been managed with great success due to its intermediate-high heritability (Banerjee, 1989; Kemble and Gardner, 1992), which has led to plant breeders ob-taining earlier crops with high efficiency (Foolad, 2007). During the domestication process of tomato (So-lanum lycopersicum L.), the selection of large fruit has brought genetic changes in certain components of ear-liness. For example, genotypes with large fruit often present a longer flowering period than the wild ances-tor species S. pimpinellifolium L. (Grandillo and Tanks-ley, 1996). Several correlations between flowering time and other traits have been reported by classical and molecular studies (Sumugat et al., 2010; Grandillo and Tanksley, 1996; Doganlar et al., 2002; Georgelis et al., 2004; Monamodi et al., 2013). Such studies showed that the number of leaves produced before the floral transi-tion plays an important role during the time required by tomato plants to develop their first flower (Samach and Lotan, 2007). This effect has been demonstrated in mutants such as FALSIFLORA (fa) and SINGLE FLOWER TRUSS (sft) where a mutation in one of their floral path-way integrators caused an increase in the flowering pe-riod due to an increased number of leaves formed in the initial simpodial segment (Molinero-Rosales et al., 1999; Molinero-Rosales et al., 2004).
The co-localization of QTLs associated with days to flowering of the first truss and fruit size on chromo-somes 1, 4 and 6 has revealed a number of causes of the positive association identified in several types of
map-ping populations (e.g., F2, inbred backcross lines, near isogenic lines and recombinant inbred lines)(Grandillo and Tanksley, 1996; Doganlar et al., 2002; Monforte and
Tanksley, 2000; Yates et al., 2004; Sumugat et al., 2010).
However, it is not clear if the cause is due to pleiotropic effects or to gene linkage.
Recently in tomato, several studies have reported the influence of epistasis on fruit shape, locule number, seed size and fruit weight during the process of domes-tication (Lippman and Tanksley, 2001; van der Knaap et al., 2002; Khan et al., 2012). In few studies have the epi-static interactions between the components of earliness and fruit weight been examined, and it is equally un-clear if tomato earliness is controlled by a single genetic mechanism or something more complex. Therefore, this work focused on the identification of QTLs affecting the main components of earliness and fruit weight. Further-more, we were interested in identifying the epistatic in-teractions between these QTLs. Such information was useful for determining if the positive associations of fruit weight with the period of flowering and seed weight were due to pleiotropic effects or to gene linkage.
Materials and Methods
Mapping population
produce the F2 population. LOR82 is a local cultivar from the state of Puebla, Mexico. This line produces large fruits with characteristics similar to the Saladette type tomato and it is locally known as “Chino Criollo”. S. pimpinellifo-lium is a wild relative of tomato and has a small rounded fruit. A number of 172 F2 plants were evaluated along with the parents and the F1 generation, under a random-ized complete block design with four replications. The evaluation of the experiment was conducted under green-house conditions during the 2012 spring-summer growing season in Texcoco (19°28'4.26" N, 98°53'42.18" W, 2250 m.a.s.l.), state of Mexico, Mexico.
Phenotypic characterization
Individual F2 plants were evaluated for eleven quantitative traits. Fruit weight (FW), in grams, was scored as the average weight of five fruits per plant; number of flowers per truss (NFT) was measured by av-eraging the number of flowers from the third and fourth trusses; days to emergence (DE), in days, were obtained as the amount of time each plant took to emerge from planting date; days to flowering of the first (DFFT), sec-ond (DFST) and third truss (DFTT), were determined as the number of days elapsed from the date of sowing until the opening of the first flower in the first, second and third truss. Days to ripening (DR) were obtained by counting the days elapsed from the date of sowing to production of the first ripe fruit. Seed weight (SW), in grams, was estimated as the average weight of 100 seeds harvested of each F2 plant. This score was used to esti-mate the weight of 1,000 seeds. Finally, the traits seed-ling height (SH), width and length of the first leaf (WFL and LFL, respectively) were measured at 25 days after planting; plant height was measured as the length of the stem while leaf length and leaf width as the horizontal and vertical length of the first true leaf, respectively.
Genotypic analysis
DNA extraction was performed according to the protocol established by Bernatzky and Tanksley (1986). A total of 61 molecular markers located on twelve chro-mosomes were scored for construction of the linkage map. These SSR markers were obtained from Tomato Mapping Resource Database (http://164.107.85.47:8003) and Sol Genomics Network (http://solgenomics.net/) based on their map positions. Each PCR reaction con-taining a final volume of 25 µL was prepared with the following final concentrations: PCR Buffer (1X), MgCl2 (1.5 mM), dNTP's (0.1 mM by nucleotide), F and R Prim-er (0.4 µM), Taq PolymPrim-erase (0.1 u µL−1) and DNA (1.6
ng µL−1). Finally, the PCR products were run on
acryl-amide gels as described by Creste et al. (2001).
Data analysis
Means, normality test (Anderson-Darling's test), tests for homogeneity of variance (Bartlett's test) and Pearson's correlation, were calculated for each trait us-ing R software version 3.0.1 (R Core Team, 2013).
Sig-nificant differences between the generation means were estimated using one-way ANOVA followed by a Tukey test. Path analysis was carried out to estimate the di-rect and indidi-rect effects of each earliness component on fruit weight according to the procedures described by McGiffen et al. (1994). This analysis is employed to elucidate how other variables mediate the relationship formed by two traits (McGiffen et al., 1994).
The linkage map was constructed using the Map-Disto software version 1.7.7 under a LOD of 3, and the Kosambi mapping function (Kosambi, 1944) was em-ployed to convert the recombination frequencies into map units expressed in centimorgans (cM). The location of linkage groups was based on the genetic map published by Robbins et al. (2011). QTL analysis and phenotypic variance were performed using the mapping software Windows QTL Cartographer 2.5. Putative QTLs were detected employing composite interval analysis (Jansen and Stam, 1994; Zeng, 1994) where the significance level to claim a QTL was determined using 1,000 permuta-tions. For genomic scan a window size of 10 cM and walk speed of 1 cM were used. The dominance degree of al-leles for a QTL was estimated based on the ratio |d/a|, where d = (LP)-1/2(LL+PP), a = (LL)-1/2(LL+PP), LP = frequency of heterozygotes individuals, LL = frequency of S. lycopersicum homozygote individuals and PP = fre-quency of S. pimpinellifolium homozygote individuals, thus when |d/a| < 0.2 the trait was considered additive, 0.2 ≤ |d/a| < 0.8 partially dominant, 0.8 ≤ |d/a| < 1.2 com-pletely dominant and |d/a| ≥ 1.2 overdominant (Stuber et al., 1987). The average effects of the L and P alleles for each QTL were estimated according to: q[a + d(q-p)] for L and -q[a + d(-qp)] for P, where p and q = gene frequency of the L and P alleles, respectively (Falconer and Mackay, 1996).
Finally, epistatic interactions were identified by the following factorial design with two factors: y = m + Mi +Mj + (MM)ij + eijk, where Mi = effect of marker i, Mj = effect of marker j, (MM)ij = interaction between markers i and j and eijk = residual error. Thus, where (MM)ij was significant (p < 0.05), epistasis was claimed. Broad-sense heritability was calculated using the equation H2 = σ2
g / (σ 2
g +σ 2
e) where σ 2
g is the genetic
variance and σ2
e is the environmental variance estimated
with the ANOVA error term.
Results
Phenotypic distributions and correlations between quantitative traits
adjusted with log10 or square root transformations. The phenomenon of transgressive segregation was observed in most of the variables (NFT, DE, DFFT, DFST, DFTT, DR, SW, SH, WFL and LFL) (Table 1), where interest-ingly some plants expressed a shorter flowering period to that of S. pimpinellifolium (Table 1).
Several significant positive and negative correla-tions (p < 0.002) between traits were observed in the F2 population (Figure 2). NFT showed a significant negative correlation with FW (-0.34), DFFT (-0.24), DFST (-0.29), DFTT (-0.40), SW (-0.35) and SH (-0.26). On the other hand, DE only had a negative correlation (p < 0.001) with WFL and LFL, whose values were less than 0.35. In addition, we found statistically significant correla-tions between DFFT and five other variables (FW, DFST, DFTT, SW and SH). Likewise, flowering traits such as DFST and DFTT variables showed significant correla-tions with FW, SW and SH, whose association values were below 0.5. Seed weight (SW) presented six corre-lations with other traits, some of which resulted from the association with FW (0.43), NFT (-0.35), DFST (0.30), DFTT (0.34) and LFL (0.34). Finally, LFL also showed significant correlation with SH (0.34) and WFL (0.47).
Direct and indirect effects of the components of earliness on fruit weight
A path analysis was conducted to identify the di-rect and indidi-rect effects of the components of earliness affecting fruit size. Due to the high correlation between DFFT, DFST and DFTT, we only used DFTT as the flowering variable affecting fruit weight. The analysis showed to DFTT, SW and LFL as the main components of earliness affecting to FW (p < 0.05), where their path coefficients for the direct effects were 0.31, 0.31 and 0.24, respectively (Figure 3).
Although we observed an association between FW with NFT and SH in the correlation analysis (p < 0.002), these characteristics showed no effect on FW in the path analysis.
QTL analysis
The map spanned 815.71 cM of the tomato ge-nome with an average marker spacing of 13.37 cM. A total of 27 QTLs were identified in eight of the eleven traits evaluated. Out of the 27 QTLs identified, only two (de8.1 and dr7.1) showed an opposite effect (Table 2 and Figure 4) and dftt1.1 had the highest value (25 %) in the individual explained variance (R2). The trait that
present-ed the highest value of total explainpresent-ed variance (TEV) was SW with 43 % while DE had the lowest value of 2 %. Additionally, seed weight was the trait that presented the highest number of QTLs identified by trait, where a set of seven QTLs governing this quantitative trait was detected on chromosomes 1 (sw1.1 and sw1.2), 2 (sw2.1), 3 (sw3.1 and sw3.2), 4 (sw4.1) and 7 (sw7.1).
Epistatic interactions
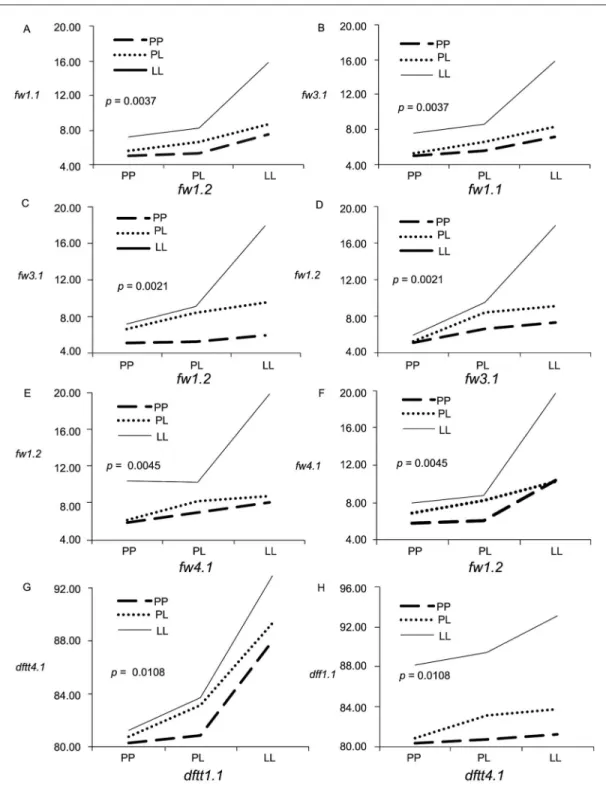
As the square root transformation reduced skew-ness in FW, we performed the analysis using transformed data for all traits; however, non-transformed data have been used in the epistasis schemes to improve the obser-vation of the interactions. Based on the results of the two-way analysis of variance, four significant interactions be-tween QTLs (p < 0.05) were identified for FW and DFTT variables (Figure 5). For FW, three significant interactions were detected: fw1.1 × fw3.1, fw3.1 × fw1.2 and fw1.2 × fw4.1. As regards the fw3.1 × fw1.1 interaction, the two loci under a homozygous condition (LL) expressed a dis-proportionate increase in the expected phenotypic value. However, this increase was greater when fw1.1 was se-lected as the independent variable, since the phenotypic variation between homozygous genotypes (LLLL and PPLL) (Figure 5A) was greater (8.65 g) than that of the reciprocal scheme (Figure 5B). This result indicated that fw1.1 had a greater effect on increasing fruit weight when fw3.1 S. lycopersicum alleles had been previously fixed in the individuals. Figure 5C and Figure 5D show that the interaction fw3.1 × fw1.2 had a similar effect on the two genotypes LLLL and PPLL compared to the effect gen-Table 1 − Mean phenotypic values, standard deviations for parents, F1 and F2 population.
Traita S. lycopersicum S. pimpinellifolium F1 F2 P-valueb MSDc
Mean Mean Mean Mean ± SE Min max
FW 128.1 ad 0.7 b 6.6 b 8.4 ± 0.44 b 1.0 40.0 *** 11.4
NFT 5.7 c 25.7 a 9.5 cb 11.0 ± 0.23 b 5.0 23.0 *** 4.7
DE 7.8 a 8.3 a 7.4 a 7.8 ± 0.10 a 5.0 15.0 ns 2.1
DFFT 77.1 a 60.6 b 65.7 b 66.1 ± 0.43 b 54.0 86.0 *** 9.2
DFST 96.0 a 69.9 b 76.2 b 77.9 ± 0.35 b 67.0 91.0 *** 9.4
DFTT 106.7 a 76.1 b 84.4 b 84.7 ± 0.46 b 72.0 103.0 *** 9.4
DR 140.6 a 124.2 b 119.4 b 121.7 ± 0.40b 108.0 142.0 *** 8.1
WS 4.0 a 1.3 c 2.7 b 2.5 ± 0.04 b 0.4 3.7 *** 0.8
SH 4.5 a 2.7 b 4.1 a 2.8 ± 0.04 b 1.5 4.3 *** 0.8
WFL 0.79 a 0.72 ba 0.87 ba 0.66 ± 0.01 b 0.20 0.90 *** 0.18
LFL 3.5 a 2.0 bc 3.0 ba 2.5 ± 0.03 c 0.6 3.3 *** 0.6
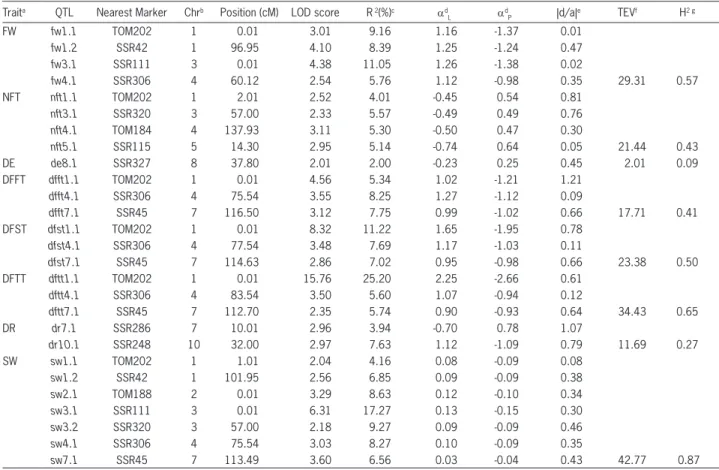
Table 2 − Significant QTLs associated with earliness traits and fruit weight detected on F2 population.
Traita QTL Nearest Marker Chrb Position (cM) LOD score R2(%)c ad
L adP |d/a|e TEVf H2 g
FW fw1.1 TOM202 1 0.01 3.01 9.16 1.16 -1.37 0.01
fw1.2 SSR42 1 96.95 4.10 8.39 1.25 -1.24 0.47
fw3.1 SSR111 3 0.01 4.38 11.05 1.26 -1.38 0.02
fw4.1 SSR306 4 60.12 2.54 5.76 1.12 -0.98 0.35 29.31 0.57
NFT nft1.1 TOM202 1 2.01 2.52 4.01 -0.45 0.54 0.81
nft3.1 SSR320 3 57.00 2.33 5.57 -0.49 0.49 0.76
nft4.1 TOM184 4 137.93 3.11 5.30 -0.50 0.47 0.30
nft5.1 SSR115 5 14.30 2.95 5.14 -0.74 0.64 0.05 21.44 0.43
DE de8.1 SSR327 8 37.80 2.01 2.00 -0.23 0.25 0.45 2.01 0.09
DFFT dfft1.1 TOM202 1 0.01 4.56 5.34 1.02 -1.21 1.21
dfft4.1 SSR306 4 75.54 3.55 8.25 1.27 -1.12 0.09
dfft7.1 SSR45 7 116.50 3.12 7.75 0.99 -1.02 0.66 17.71 0.41
DFST dfst1.1 TOM202 1 0.01 8.32 11.22 1.65 -1.95 0.78
dfst4.1 SSR306 4 77.54 3.48 7.69 1.17 -1.03 0.11
dfst7.1 SSR45 7 114.63 2.86 7.02 0.95 -0.98 0.66 23.38 0.50
DFTT dftt1.1 TOM202 1 0.01 15.76 25.20 2.25 -2.66 0.61
dftt4.1 SSR306 4 83.54 3.50 5.60 1.07 -0.94 0.12
dftt7.1 SSR45 7 112.70 2.35 5.74 0.90 -0.93 0.64 34.43 0.65
DR dr7.1 SSR286 7 10.01 2.96 3.94 -0.70 0.78 1.07
dr10.1 SSR248 10 32.00 2.97 7.63 1.12 -1.09 0.79 11.69 0.27
SW sw1.1 TOM202 1 1.01 2.04 4.16 0.08 -0.09 0.08
sw1.2 SSR42 1 101.95 2.56 6.85 0.09 -0.09 0.38
sw2.1 TOM188 2 0.01 3.29 8.63 0.12 -0.10 0.34
sw3.1 SSR111 3 0.01 6.31 17.27 0.13 -0.15 0.30
sw3.2 SSR320 3 57.00 2.18 9.27 0.09 -0.09 0.46
sw4.1 SSR306 4 75.54 3.03 8.27 0.10 -0.09 0.35
sw7.1 SSR45 7 113.49 3.60 6.56 0.03 -0.04 0.43 42.77 0.87
aFW = fruit weight (g); NFT = Number of flowers per truss; DE = Days to emergence; DFFT = Days to flowering in first truss; DFST = Days to flowering in second truss; DFTT = Days to flowering in third truss; DR = Days to ripening; SW = Weight of 1000 seed (g); bChromosome on which QTL was detected; cPercentage of phenotypic variation explained by the QTL; dAverage allelic effect provided by S. lycopersicum and S. pimpinellifolium, respectively; eDegree of dominance expressed by the QTL; fTotal explained variance by all QTL in each trait; gBroad-sense heritability.
Figure 2 − Pearson's coefficient of correlations between trait pairs in the F2population. FW = fruit weight; NFT = Number of flowers per truss; DE = Days to emergence; DFFT = Days to flowering in first truss; DFST = Days to flowering in second truss; DFTT = Days to flowering in third truss; DR = Days to ripening; SW = Weight of 1000 seed; SH = Seedling height; WFL = Width of the first leaf; LFL = Length of the first leaf; ns = non-significant; *,**,*** = significant at p < 0.05, 0.01, 0.001, respectively.
NFT DE DFFT DFST DFTT DR SW SH WFL LFL
FW –0.34*** 0.01 ns 0.28*** 0.33*** 0.42*** –0.02 ns 0.43*** 0.24** –0.05 ns 0.17*
NFT 0.06 ns –0.24** –0.29*** –0.40*** 0.04 ns –0.35*** –0.26*** 0.02 ns –0.11 ns
DE 0.11 ns 0.07 ns 0.04*** 0.02 ns –0.09 ns –0.19* –0.34*** –0.30***
DFFT 0.50*** 0.64*** 0.16* 0.27*** 0.26*** –0.15* –0.19**
DFST 0.79*** 0.16* 0.30*** 0.35*** –0.18* –0.15 ns
DFTT 0.16* 0.34*** 0.41*** –0.22*** –0.08 ns
DR 0.01 ns –0.03 ns 0.02 ns –0.11 ns
SW 0.28*** 0.03 ns 0.04*
SH 0.08 ns 0.34***
WFL 0.47***
erated for fw3.1 × fw1.1. However, the effect shown by fw1.2 was higher considering a background already fixed for LL alleles at fw3.1. In fw1.2 × fw4.1, the greatest effect was caused by fw4.1, indicating that the fw4.1 S. lycop-ersicum alleles were subsequently selected over those of fw1.2 (Figure 5E and Figure 5F).
Finally, for DFTT only one partially dominant × additive interaction was observed between dftt1.1 × dftt4.1. In this interaction, a disproportionate increase is observed when both loci are homozygous for LL alleles, which evidenced the phenomenon of epistasis (Figure 5G and Figure 5H).
Discussion
Different genetic pathways controlling earliness
During the study, a considerable phenotypic varia-tion was found between parents and the F2 population. On the other hand, the absence of correlation between DE and DR indicated that the first emerging plants were
not the first to produce the first ripe fruit. This same trend in reproductive development was observed during the period from DFTT to DR, where the plants which showed an earlier anthesis did not form their first fruit as quickly. Similar results were obtained by Burdick (1954), who evaluated eight tomato inbred-lines and 28 F1 genotypes obtained under a diallel cross and, found that some F1 hybrids were later than S. pimpinellifolium during the period between days to emergence and days to flowering to first truss, but were earlier in the last stage (days to first truss-days to maturity). In contrast, the close relationship between DFFT and WS caused by the co-localization of their QTLs indicated that plants derived from seeds with more weight expressed a later floral transition than those emerging from seeds with less weight. Similar associations were also obtained be-tween DFST and DFTT with WS, which suggested that seed weight showed a positive effect on the development time of sympodial units formed after the floral transi-Figure 3 − Direct and indirect effects of the earliness components over fruit weight identified by the path analysis. NFT = Number of flowers per truss; DE = Days to emergence; DFTT = Days to flowering in third truss; DR = Days to ripening; SW = Weight of 1000 seed; SH = Seedling height; WFL = Width of the first leaf; LFL = Length of the first leaf. The direct effects are indicated in bold type. ns = non-significant; * = significant at p < 0.05.
Indirect effects
NFT DR DFTT DR SW SH WFL LFL
Dir
ect ef
fects
NFT –0.10 ns 0.00 –0.12 0.00 –0.11 0.02 0.00 –0.03
DE –0.01 0.07 ns 0.01 0.00 –0.03 0.01 0.03 –0.07
DFTT 0.04 0.00 0.31** –0.01 0.10 –0.03 0.02 –0.02
DR 0.00 0.00 0.05 –0.04 ns 0.00 0.00 0.00 –0.03
SW 0.03 –0.01 0.10 0.00 0.31*** –0.02 0.00 0.01
SH 0.03 –0.01 0.13 0.00 0.09 –0.06 ns –0.01 0.08
WFL 0.00 –0.02 –0.07 0.00 0.01 0.00 –0.07 ns 0.12
LFL 0.01 –0.02 –0.02 0.00 0.01 –0.02 –0.04 –0.24**
Correlation –0.34*** 0.01 ns 0.42 –0.02 ns 0.43*** 0.24** –0.05 ns 0.17*
Figure 5 − Interaction plots for fruit weight (FW) (A - F) and days to flowering to third truss (DFTT) (G and H). The reciprocal plots are shown on the right column.
tion due to gene linkage. In this regard, similar effects caused by the seed size and weight in tomato seedlings were reported by Khan et al. (2012), who concluded that effects on seedling growth were due to the genetic varia-tion in the amount of food reserve (starch) and maternal effects. In addition to seed weight, various factors such as the number of leaves produced before the first
To date, several mapping studies have been con-ducted in characteristics related to earliness of tomato (Grandillo and Tanksley, 1996; Doganlar et al., 2002; Ca-gas et al., 2007; Sumugat et al., 2010). However, there is no path analysis for earliness which can identify the progress of the effects of QTLs controlling earliness in each component. In this study, analyzing various com-ponents of earliness, a total of 27 QTLs were identified, where most of these QTLs were identified in regions where previously, several studies had reported QTLs associated to earliness (Grandillo and Tanksley 1996; Doganlar et al., 2002; Cagas et al., 2007; Jimenez-Gomez et al., 2007; Sumugat et al., 2010). In general, most QTLs identified were unique to each stage of earliness, except for dftt1.1, dftt4.1 and dftt7.1, which were consistent in the three stages of flowering evaluated (DFFT, DFST, DFTT). These results were similar to those reported by Grandillo and Tanksley (1996) and Doganlar et al. (2002), who observed no co-localization between QTLs for days to flowering and days to fruit ripening. Finally, the lack of correlation and localization between QTLs as-sociated with DE and DR, as well as with flowering vari-ables (DFFT, DFST and DFTT) suggests that earliness is controlled by different genetic mechanisms.
Genetic variation in truss production over time is affected by dominance
In spite of the strong correlation, same number and co-localization of the QTLs identified for DFFT, DFST and DFTT, differences in the phenotypic variation of their QTLs were observed, as well as changes in the average effect of their alleles. The QTL located on chromosome 1 (dftt1.1) showed an increasein its phenotypic variance in each sympodial segment, while dftt4.1 and dftt7.1 exhib-ited a decrease per truss. These changes in allelic effects were attributed to the increase (in dftt1.1) and decrease (in dftt4.1 and dftt7.1) of genotypic range established by the two homozygous genotypes at each stage, where the dominance of S. pimpinellifolium alleles was the main factor influencing this variation of the genotypic range. These findings support the idea proposed by Burdick (1954), who found that the dominance of S. pimpinellifo-lium alleles is more evident over time. On the other hand, the major effect and dominance expressed by dftt1.1 sup-ports the hypothesis suggested by Buckler et al. (2009), who proposed that the flowering time in cross-pollinated species is controlled by genes with small additive effects, while in autogamous species, such as tomato, it is affected by genes with large effects and dominance action.
The QTL named here as dftt1.1 has been the most frequently mapped in most mapping populations, indi-cating that due to its major effect on the floral transi-tion, it can be detected under different environments. This observation supports the general conclusion arrived at by Tanksley (1993), who concluded that QTLs show-ing major effects have a null genotype × environment interaction. However, our study is the first reporting a major effect of dftt1.1 on flowering time (> 2 days),
which could be identified with such magnitude due to the contrast shown by progenitors conforming the map-ping population. Furthermore, we observed that despite the large physical distance between the marker TOM202 and PHYB1 gene, the dftt1.1 effect could be caused by PHYB1, due to a low recombination reported in this re-gion (Gonzalo and van der Knaap, 2008); however, ad-ditional NILs populations are required to demonstrate this idea.
Gene linkage: leading cause of association fruit size-flowering period and fruit size–seed size
During the domestication process of tomato, se-lection of plants with larger fruit has indirectly caused changes in the flowering period, number of flowers per truss and seed weight. Genetic linkage and pleiotropic effects have been proposed as the main causes of the indirect effects on some quality traits (Paterson et al., 1991). However, in a number of chromosomal regions located in the final part of chromosome 1, it has not been possible to discern whether the effect shown for several characteristics such as fruit weight and external color of the fruit is caused by pleiotropic effects or gene linkage (Monforte and Tanksley, 2000).
Acknowledgments
We would like to thank The College of Postgradu-ate- LPI-6 (Texcoco/state of Mexico/Mexico) and The Na-tional Council of Science and Technology (Mexico City/ DF/Mexico) for financing this work.
References
Banerjee, M.K. 1989. The inheritance of earliness and fruit weight in crosses between cultivated tomatoes and two wild species of Lycopersicon. Plant Breeding 102: 148-152.
Buckler, E.S.; Holland, J.B.; Bradbury, P.J. 2009. The genetic architecture of maize flowering time. Science 325: 714-718. Burdick, A.B. 1954. Genetics of heterosis for earliness in the tomato.
Genetics 39: 488-505.
Cagas, C.C.; Lee, O.N.; Nemoto, K.; Sugiyama, N. 2007. Quantitative
trait loci controlling flowering time and related traits in a Solanum
lycopersicum × S. pimpinellifolium cross. Scientia Horticulturae 116: 144–151.
Creste, S.; Tulmann-Neto, A.; Figueira, A. 2001. Detection of single sequence repeat polymorphisms in denaturing polyacrylamide sequencing gels by silver staining. Plant Molecular Biology Reporter 19: 299–306.
Dieleman, J.A.; Heuvelink, E. 1992. Factors affecting the number of leaves preceding the first inflorescence in the tomato. The Journal of Horticultural Science & Biotechnology 67: 1–10.
Doganlar, S.; Frary, A.; Ku, H.M.; Tanksley, S.D. 2002. Mapping
quantitative trait loci in inbred backcross lines of Lycopersicon
pimpinellifolium (LA1589). Genome 45: 1189-1202.
Falconer, D.S.; Mackay, T.F.C. 1996. Introduction to quantitative genetics. 4ed. Longmans Harlow, UK.
Foolad, M.R. 2007. Genome mapping and molecular breeding of tomato. International Journal of Plant Genomics 2007: 1-52. Georgelis, N.; Scott, J.W.; Baldwin, E.A. 2004. Relationship of tomato
fruit sugar concentration with physical and chemical traits and linkage of RAPD markers. Journal of the American Society for Horticultural Science 129: 839-845.
Grandillo, S.; Tanksley, S.D. 1996. QTL analysis of horticultural traits differentiating the cultivated tomato from the closely
related species Lycopersicon pimpinellifolium. Theoretical Applied
Genetics 92: 935-951.
Gonzalo, M.J.; Van der Knaap, E. 2008. A comparative analysis into the genetic bases of morphology in tomato varieties exhibiting elongated fruit shape. Theoretical Applied Genetics 116: 647-656. Jansen, R.C.; Stam, P. 1994. High resolution of quantitative trait loci
into multiple loci via interval mapping. Genetics 136: 1447-1455. Jimenez-Gomez, J.M.; Alonso-Blanco, C.; Borja, A.; Anastasio, G.;
Angosto, T.; Lozano, R.; Martinez-Zapater, J.M. 2007. Quantitative genetic analysis of flowering time in tomato. Genome 50: 303–315. Kemble, J.M.; Gardner, R.G. 1992. Inheritance of shortened fruit
maturation in the cherry tomato Cornell 871213-1 and its relation to fruit size and other components of earliness. Journal of the American Society for Horticultural Science 117: 646-650.
Khan, N.; Kazmi, R.H.; Willems, L.A.; Van Heusden, A.W.; Ligterink, W.; Hilhorst, H.W. 2012. Exploring the natural variation for seedling traits and their link with seed dimensions in tomato. PLoS ONE 7: e43991.
Kosambi, D.D. 1944. The estimation of map distances from recombination values. Annals of Eugenics 12: 172–175.
Lippman, Z.; Tanksley, S.D. 2001. Dissecting the genetic pathway to extreme fruit size in tomato using a cross between the
small-fruited wild species Lycopersicon pimpinellifolium and L. esculentum
var. Giant Heirloom. Genetics 158: 413–422.
McGiffen, M.E.; Pantone, D.J.; Masiunas, J.B. 1994. Path analysis of tomato yield components in relation to competition with black and eastern black nightshade. Journal of the American Society for Horticultural Science 119: 6-11.
Molinero-Rosales, N.; Jamilena, M.; Zurita, S.; Gomez, P.; Capel, J.; Lozano, R. 1999. FALSIFLORA, the tomato orthologue of FLORICAULA and LEAFY, controls flowering time and floral meristem identity. The Plant Journal 20: 685–693.
Molinero-Rosales, N.; Latorre, A.; Jamilena, M.; Lozano, R. 2004. SINGLE FLOWER TRUSS regulates the transition and maintenance of flowering in tomato. Planta 218: 427–434. Monamodi, E.L.; Lungu, D.M.; Fite, G.L. 2013. Analysis of fruit
yield and its components in determinate tomato (Lycopericon lycopersci). Botswana Journal of Agriculture and Applied Sciences 9: 29-40.
Monforte, A.J.; Tanksley, S.D. 2000. Fine mapping of a quantitative trait locus (QTL) from Lycopersicon hirsutum chromosome 1 affecting fruit characteristics and agronomic traits: breaking linkage among QTLs affecting different traits and dissection of heterosis for yield. Theoretical Applied Genetics 100: 471-479.
Paterson, A.H.; Damon, S.; Hewitt, J.D.; Zamir, D.; Rabinowitch, H.D.; Lincoln, S.E.; Lander, E.S.; Tanksley, S.D. 1991. Mendelian factors underlying quantitative traits in tomato: comparison across species, generations, and environments. Genetics 127: 181-197. R Core Team. 2013. R: A Language and Environment for Statistical
Computing. R Foundation for Statistical Computing, Vienna, Austria.
Robbins, M.D.; Sim, S.C.; Yang, W.; Van Deynze, A.; Van der Knaap, E.; Joobeur, T.; Francis, D.M. 2011. Mapping and linkage disequilibrium analysis with a genome-wide collection of SNPs that detect polymorphism in cultivated tomato. Journal of Experimental Botany 6: 1831-1845.
Samach, A.; Lotan, H. 2007. The transition to flowering in tomato. Plant Biotechnology 24: 71-82.
Stuber, C.W.; Edwards, M.D.; Wendel, J.F. 1987. Molecular marker-facilitated investigation of quantitative trait loci in maize. II. Factors influencing yield and its component traits. Crop Science 27: 639-648.
Sumugat, M.R.; Lee, O.; Nemoto, K.; Sugiyama, N. 2010. Quantitative trait loci analysis of flowering-time-related traits in tomato. Scientia Horticulturae 123: 343-349.
Tanksley, S.D. 1993. Mapping polygenes. Annual Review of Genetics 27: 205-233.
Van der Knaap, E.; Lippman, Z.B.; Tanksley, S.D. 2002. Extremely elongated tomato fruit controlled by four quantitative trait loci with epistatic interactions. Theoretical Applied Genetics 104: 241–247. Yates, H.E.; Frary, A.; Doganlar, S.; Frampton, A.; Eannetta, N.T.;
Uhlig, J.; Tanksley, S.D. 2004. Comparative fine mapping of fruit quality QTLs on chromosome 4 introgressions derived from two wild tomato species. Euphytica 135: 283-296.