Crop Breeding and Applied Biotechnology 11: 157-164, 2011 Brazilian Society of Plant Breeding. Printed in Brazil
Molecular markers detect stable genomic regions
underlying tomato fruit shelf life and weight
Guillermo Raúl Pratta1*, Gustavo Rubén Rodriguez1, Roxana Zorzoli2, Estela Marta Valle3 and Liliana Amelia Picardi2
Received 30 September 2010
Accepted 6 January 2011
ABSTRACT- Incorporating wild germplasm such as S. pimpinellifolium is an alternative strategy to prolong tomato fruit shelf life (SL) without reducing fruit quality. A set of recombinant inbred lines with discrepant values of SL and weight (FW) were derived by antagonistic-divergent selection from an interspecific cross. The general objective of this research was to evaluate Genotype x Year (GY) and Marker x Year (MY) interaction in these new genetic materials for both traits. Genotype and year principal effects and GY interaction were statistically significant for SL. Genotype and year principal effects were significant for FW but GY interaction was not. The marker principal effect was significant for SL and FW but both year principal effect and MY interaction were not significant. Though SL was highly influenced by year conditions, some genome regions appeared to maintain a stable effect across years of evaluation. Fruit weight, instead, was more independent of year effect.
Key words: amplified fragment length polymorphism; plant breeding; plant genetic resources; Solanum section Lycopersicon; quantitative genetics.
INTRODUCTION
Fruit shelf life (SL) is a ripening associated trait important for determining the tomato fresh marketability (Schuelter et al. 2002). Though genetic engineering and spontaneous ripening mutants have been used to modify metabolic pathways involved in prolonging SL, such approaches were not commercially well-accepted by consumers (Bartoszewski et al. 2003). Wild species of
Solanum section Lycopersicon were included in breeding programs as a source of disease resistance and adverse environment tolerance genes, and also have valuable genetic variability for fruit quality traits (Galiana-Balaguer
et al. 2006). Among them, S. pimpinellifolium (the currant tomato) produces small and high nourishing quality fruits, and it is easily crossed to the cultivated tomato (Zuriaga et al. 2009). Zorzoli et al. (2000) found that some accessions of this wild germplasm had a longer SL than commercial tomato varieties, and began a breeding program in the segregating generations of an interspecific cross among cv. Caimanta (S. lycopersicum) and LA722 (S. pimpinellifolium). Sixteen elite tomato recombinant inbred lines (RILs) with discrepant values of SL and fruit weight (FW) were obtained (Rodriguez et al. 2006).
Genotypes in multiple environments, such as different years of evaluation, can react differently to
1 Universidad Nacional de Rosario, Facultad de Ciencias Agrarias, Cátedra de Genética-Consejo Nacional de Investigaciones Científicas y Técnicas, CC14, CP 2125,
Zavalla, Santa Fe, Argentina. *E-mail: [email protected]
2 Universidad Nacional de Rosario, Facultad de Ciencias Agrarias, Cátedra de Genética-Consejo de Investigaciones de la Universidad Nacional de Rosario, CC14,
CP 2125, Zavalla, Santa Fe, Argentina
3 Consejo Nacional de Investigaciones Científicas y Técnicas- Universidad Nacional de Rosario, Instituto de Biología Molecular y Celular de Rosario- Facultad
environmental variation. Genotype x Year (GY) interaction is a common feature for quantitative traits, and has been a subject of great concern for breeding programs since it may modify important genetic parameters such as heritability and genetic correlation among traits (Kearsey and Pooni 1996). Through the use of molecular markers, the GY interaction can be further dissected into components of Marker x Year (MY) interaction. MY interaction has great importance in marker-assisted selection since it may distort the expected results of crop genetic improvement (Liu et al. 2006, Emrich et al. 2008, Backes and Østergård 2008). When GY is significant but MY is not, stable genomic regions underlying a given trait are detected which become highly valuable for breeding programs (Kearsey and Pooni 1996).
The aim of this research was to evaluate both GY and MY interactions that could modify the genetic effects underlying SL and FW in a set of new tomato genotypes developed by Rodriguez et al. (2006).
MATERIALS AND METHODS
Phenotypic evaluation
Sixteen tomato recombinant inbred lines (RILs) derived from an interspecific hybrid between Caimanta (S. lycopersicum) and LA722 (S. pimpinellifolium) after five cycles of antagonic and divergent selection for fruit shelf life and fruit weight were field assayed across two cycles of crops (CI and CII) at the Experimental Station “José F. Villarino” (lat 33º S and long 61º W, Universidad Nacional de Rosario). In both years, seeds of the 16 RILs and their parents were germinated in seedling trays at the end of June and transplanted in the field after a month in a completely randomized design. Though the number of different genotypes was small, they represent the selected extremes for both traits. Therefore, this experiment could be considered as a selective genotypying approach (Liu 2004).
The total number of plants was 162 in CI, with a mean of 9 plants per genotype (RILs and parents). The total number of plants was 198 in CII, with a mean of 11 plants per genotype. The total number of harvested fruits was 3114 in CI (approximately 20 per plant) and 2958 in CII (approximately 15 per plant). Fruits at the breaker stage were evaluated for fruit weight (FW, in grams) and fruit shelf life (SL) in days from harvest to the beginning of fruit softening (Schuelter et al. 2002)
Molecular characterization
After transplanting in the field, young leaves were harvested from three random plants of each RIL and the parents. Genomic DNA was extracted with a commercial kit. AFLP profiles were generated according to the standard protocol (Blears et al. 1998) with minor changes. DNA (0.375 mg) was digested with 1.25 units of EcoRI and 2 units of MseI in a final volume of 12.5 mL and then incubated at 37 ºC for two hours. Ligation of the digested fragments to the specific double strand sequences 5´-GACTGCGTACCAATTC-3´ (EcoRI adapter, final concentration 0.025 µM), and 5´-GATGAGTCCTGAGTAA-3´ (MseI adapter, final concentration 0.25 µM) was achieved by incubation at 37 ºC for two hours with 0.75 units of T4 ligase in a final volume of 15 mL. The digested-ligated solution was 1:5 diluted with sterilized water. The pre-amplification samples were prepared with 5 mL of this dilution plus 75 ng of each primer+1 (EcoRI+1: GACTGCGTACCAATTCA-3´ and MseI+1: 5´-GATGAGTCCTGAGTAAC-3´), 0.2 mM dNTPs and 1 unit of Taq-polimerase in a final volume of 25 mL. The PCR conditions were 30 cycles of 30 seconds at 94 ºC, 1 minute at 56 ºC and one minute at 72 ºC each one. Once pre-amplified, the solution was 1:10 diluted with sterilized water. The selective amplification samples were prepared with 5 mL of this dilution and the same components above mentioned. In this step, both primers had two additional nucleotides (EcoRI+3 and MseI+3), with the three following primer combinations being employed:
- A combination: 5´-GACTGCGTACCAATTCAGA / GATGAGTCCTGAGTAACTA-3´
- B combination: 5´-GACTGCGTACCAATTCAGC / GATGAGTCCTGAGTAACAT-3´
- N combination: 5´-GACTGCGTACCAATTCATC / GATGAGTCCTGAGTAACAT-3´.
procedure. Fragments were identified with a capital letter corresponding to the primer combination and a number indicating their relative position in the gel, and their molecular weights were calculated in relation to the MWM. Fragments whose sizes varied among 500 and 100 bp were considered for statiscal analysis.
Statistical analysis
The normality of both trait distributions was verified with the Shapiro-Wilk test (Shapiro and Wilk 1965). Comparisons among genotypes were made by a one-way ANOVA for each cycle. Then, genotype by year (GY) interaction was estimated by two-way ANOVA, the statistical model being:
Yijk = µ + τi + ωj + τi * ωj + εijk
where Yijk: phenotypic value of SL or FW, µ: general mean,
τi: genotype principal effect, ùj: year principal effect, τi *
ωj: GY interaction, εijk: experimental error.
Narrow sense heritability (h2) of both traits and the
genetic correlation among them were calculated from the mean square of ANOVA and ANCOVA respectively, only including the 16 RILs for CI and CII (Kearsey and Pooni 1996).
For the molecular characterization, the AFLP profiles were firstly compared among plants within genotypes (RILs and parents). Only replicated fragments were retained. To analyze each primer combination, the total number of amplified fragments, the number of polymorphic fragments and the polymorphism percentage were calculated. The polymorphism was expressed as the presence or absence of a given fragment. Polymorphic fragments present in a given genotype were assigned 1, and those absent were assigned 0. The χ2 (Chi-square) test was used to verify the
1:1 mendelian segregation of each polymorphic fragment (Kearsey and Pooni 1996). Fragments showing a distorted segregation were discarded in further analysis. For each combination of pairs of fragments segregating 1:1, the χ2
test was applied to analyze the independence among them. Associations among the polymorphic fragments showing the expected segregation and FW and SL traits were detected by the ANOVA single point analysis (Liu 2004). The presence / absence of each polymorphic fragment was the source of variation and p < 0.05 was considered the mark of significant differences among the mean value of the trait in the group of RILs. The R2 value was used to
evaluate the percentage of phenotypic variance explained by the effect of the fragment. The fragments associated to
both traits were considered as pleiotropic, which is one of the possible causes of genetic correlation. The Marker x Year (MY) interaction was estimated by a two-way ANOVA, in which the presence / absence of the fragment and CI / CII were the source of variations. The statistical model was:
Yijk = µ + τi + ωj + τi * ωj + εijk
where Yijk: phenotypic value of SL or W, µ: general mean,
τi: marker principal effect, ωj: year principal effect, τi + ωj:
MY interaction, εijk: experimental error.
RESULTS AND DISCUSSION
Phenotypic characterization
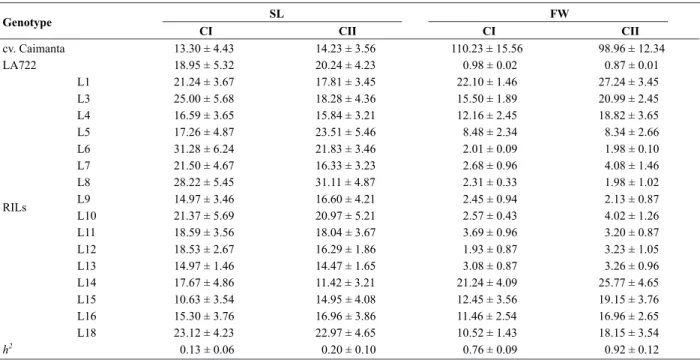
Both traits had a normal distribution according to Shapiro-Wilk’s test (W > 0.95, ns). Mean values of the SL and FW and their corresponding h2 (narrow sense heritability)
are shown in Table 1. Differences among genotypes and among years were highly significant (p < 0.01). A greater proportion of non-additive variance was found for SL indicating that random drift of genic frequencies would have contributed more significantly to determine the genotype and phenotype of these RILs. However, as it was verified by the h2 value, differences for SL are still
found among RILs. Nevertheless, the genetic variability for SL was smaller than for W. Given that values of h2 were
different among cycles of evaluation either for SL and W, an important effect of year variances could be detected.
Though no RIL had a weight similar to ‘Caimanta’, significant differences among lines were found for this trait. RILs 1, 3, 4, 14, 15, 16 and 18 had the highest values for FW, while RILs 6, 7, 8, 9, 10, 11, 12 and 13 had the lowest. RIL 5 had an intermediate FW, very close to that of the F1 (Caimanta x LA722) (10.08 ± 1.56 g according to Rodriguez et al. 2006). Regarding the fruit shelf life (SL), it was not possible to unequivocally identify two well defined groups as it was for FW. Two of these lines (6 and 8) represented fixed transgressive variants, in the sense reported by de Vicente and Tanksley (1993) because they have SL mean values higher than LA722 (the parent with the longest SL). Along five cycles of selection, Rodriguez et al. (2006) detected a considerable proportion of additive variance for FW, which allowed having a significant positive and negative response to the selection in the set of lines compared to the mean F2 value. Genetic correlation
In respect to the GY interaction (Table 2), the sources of variation genotype, year and interaction were all significant for SL (p < 0.05). For FW, the effects of genotype and year were both significant (p < 0.05), but the interaction among these effects was not significant (Table 3). These results indicate that, even though both traits are affected by year variations; the ranking of RILs according to FW was maintained across both cycles. On the other hand, the ranking of RILs according to SL changed both cycles of evaluation.
adjusted to 1:1 (B6, N18, B36, B25, B38, B23, B39 and A10) did not show an independent segregation but formed an important linkage group, which is a common fact when dealing with interspecific hybridizations (Lecomte et al. 2004). For this group, B36, B38 and B39 were carried by LA722, while N18 and A10 were carried from Caimanta. For analysis of association, just N18, B36, B38 and A10 were considered since they segregated independently at this linkage group and were differentially contributed by Caimanta and LA722. Another group was formed by B4,
Table 1. Mean values of the 16 tomato Recombinant Inbred Lines (RILs) and their parents (Solanum lycopersicum cv. Caimanta and
S. pimpinellifolium LA722) for fruit shelf life (SL, in days) and fruit weight (FW, in g) in two crop cycles
h2
: narrow sense heritability, CI: first crop cycle, CII: second crop cycle.
Table 2. Two-way analysis of variance for evaluating the genotype x year (GY) interaction for fruit shelf life
Adjusted R2: 0.36.
Molecular characterization and QTLs detection
Amplifications with the three primer combinations revealed a total of 97 fragments, of which 70 (72 %) were polymorphic among the characterized RILs. Thirty nine
B11 and B35. The first two fragments were carried by Caimanta while B35 was contributed by LA722. Both B4 and B35 were considered for association analysis since they were contributed by different parents.
Two fragments associated to SL were detected in the first cycle of evaluation and five fragments associated to SL were detected in the second cycle of evaluation (Table 4). Only one of them (N18) was significant in both cycles of evaluation but had an R2 value quite different
among years (29.00 % vs. 44.72 %). This fact might be attributable to the high environmental influence proper of each year on SL, as previously discussed. However, mean values of the groups of lines in which N18 was present or absent were similar across years (Table 4). The shortest SL parent Caimanta carried N18, which could explain the transgressive segregation fixed in some lines. According to de Vicente and Tanksley (1993), any parent having the lowest value for a given trait could carry alleles that enlarge it, but such genes would only express in an adequate genetic background when recombining with the genes from the other parent. This fact would have occurred with the QTLs prolonging SL that are contributed by Caimanta and marked by N18. When N18 combined with QTLs contributed by LA722 such as B36 and B38, SL had the highest values. Though these fragments were only significant in CII, they also prolonged SL. The other fragments contributed by Caimanta (B21 and A25) had an expected performance since they were associated to a reduction in SL. Since different markers were associated to SL in both cycles, the expression of distinct genes according to environment conditions would be the main cause of GY interaction. This statement is supported by the fact that the marker N18 maintained the same effect over both cycles.
Fruit weight had the greatest number of associated fragments. In the first cycle of evaluation, 9 AFLP had a significant effect on FW, while 8 were associated to FW in the second cycle. All fragments had an expected effect,
i.e. those carried by Caimanta increased FW while those carried by LA722 reduced FW. However, the mean values
varying among cycles but agreeing with the lack of transgressive segregant individuals for this trait. B4 was present in those lines having higher FW values and absent in those having lower ones. This fragment was associated to FW on CI and CII with high R2 values (greater than 0.70
in both cycles). Lippman and Tanksley (2001) reported at least 5 major QTLs associated to fruit weight. Given the high markers’ conservation among Lycopersicon section (Paterson et al. 1991), it should be postulated that most of the QTLs detected in this research agree to those already described.
A small number of fragments displaying pleiotropic effects were detected. B36 and B38 showed simultaneous association with FW and SL in the second cycle of evaluation, so that they would have pleiotropic effects over both traits though less marked than the previous mentioned, and also year-dependent. Hence, the low genetic correlation among FW and SL detected by classical quantitative methods and above discussed could be explained by this weak molecular association. Even so, it would be remarked that B36 and B38 both carried by LA722 are linked with N18 carried by Caimanta and also associated to SL but not to FW. Thus, an early recombination event in that chromosome region might explain the higher genetic correlation detected in the F2 generation (Rodriguez et al.
2006) but not noticeable in the RILs.
The two-way ANOVA to detect marker x year interaction for FW and SL showed that N18 maintained the significant effect on SL whereas both the year principal effect and the interaction were not significant (Table 5). As it was above mentioned, both the year principal effect and the interaction were significant in the two-way ANOVA when RILs were included as the source of variation. This contrasting result would indicate that if the whole genome is tested, there is a joint dependence of genotype and year in determining the SL expression. On the other hand, when the genome is dissected in chromosome regions highly involved in the expression of SL, such as those marked by N18, the genetic variation for SL is independent
Table 3. Two-way analysis of variance for evaluating the genotype x year (GY) interaction for fruit weight
Table 4. Association among Mendelian segregant AFLP and fruit shelf life (SL, in days) and fruit weight (FW, in g) in two crop cycles
R2: percentage of phenotypic variation explained by each associated fragment, CI: first crop cycle, CII: second crop cycle.
of the year variation. This fact agrees with the hypothesis previously proposed; i.e. the chromosome region marked by N18 and contributed by Caimanta had a high influence in determining SL though it greatly interacted with other chromosomic regions contributed by LA722, and also with the environmental conditions proper of each year, which provokes the broad phenotypic (though limited genotypic) variability observed for this trait.
For FW, none of the bifactorial models (neither those using RILs nor those using markers as a source of variation)
detected a significant interaction which agrees with the higher stability among years for this trait compared to SL, as well as the higher R2 values of their respective models.
As an example, Table 6 shows the two-way ANOVA for B4. The year principal effect was evidenced by the differences in mean values for FW that RILs showed according to the presence / absence of the associated markers among cycles of evaluation, but the ranking of RILs by FW was conserved in CI and CII.
Table 5. Two-way analysis of variance for evaluating the marker x year (MY) interaction among fragment N18 and the fruit shelf life
Adjusted R2: 0.37.
Table 6. Two-way analysis of variance for evaluating the marker x year (MY) interaction among fragment B4 and the fruit weight
CONCLUSIONS
Tomato fruit shelf life appeared to be prolonged by genes carried by both parents (the shortest and the longest shelf life genotypes), which explains the transgressive segregation detected in some RILs and in early segregation in the F2 for this trait. Fruit shelf life was highly affected
by environmental conditions proper of each year of evaluation but some chromosomic regions appeared to maintain a stable effect across two crop cycles. On the contrary, fruit weight was more independent of year effect than fruit shelf life.
Marcadores moleculares detectam regiões genômicas
estáveis condicionantes de vida de prateleira e peso de
fruto em tomate
RESUMO- A incorporação de germoplasma selvagem tal como S. pimpinellifolium é uma estratégia alternativa para prolongar a vida de prateleira de frutas do tomate (VP), sem reduzir a qualidade de frutas. Um conjunto de linhas puras recombinantes com valores discrepantes de VP e peso (PE) foi derivado por seleção antagônica divergente de um cruzamento interespecífico. O objectivo geral desta pesquisa foi avaliar a interação genótipo x ano (GA) e marcador x ano (MA) neste novo material para ambas as características. Os efeitos principais de genótipo e de ano e a interação GA foram estatisticamente significativas para VP. Os efeitos principais de genótipo e de ano foram significativos para PE, mas não a interação GA. O efeito principal marcador foi significativo para VP e PE, mas o efeito principal de ano e de interação não. Embora VP tenha sido muito influenciado pelas condições de ano, algumas regiões do genoma pareceram manter efeito estável em anos de avaliação. Peso de frutos, em vez disso, foi mais independente do efeito ano.
Palavras-chave: amplified fragment length polymorphism; melhoramento genético vegetal; recursos genéticos; Solanum seção
Lycopersicon; genética quantitativa.
REFERENCES
Backes G and Østergård H (2008) Molecular markers to exploit genotype-environment interactions of relevance in organic growing systems. Euphytica 163: 523–531
Bartoszewski G, Niedziela A, Szwacka M and Niemirowicz-Szczytt K (2003) Modification of tomato taste intransgenic plants carrying a thaumathin gene from Thaumatococcus daniellii
Benth. Plant Breeding 122: 347–351
Blears MJ, De Grandis SA, Lee H and Trevors JT (1998) Amplified fragment length polymorphism (AFLP): a review of the procedure and its applications. Jounal of Industrial Microbiology and Biotechnology 21: 99-114
de Vicente MC and Tanksley SD (1993) QTL analysis of transgresive segregation in an interspecific tomato cross. Genetics 134: 585-596
Emrich K, Price A and Piepho HP (2008) Assessing the importance of genotype 3 environment interaction for root traits in rice using a mapping population III: QTL analysis by mixed models. Euphytica 161: 229–240
Galiana-Balaguer L, Rosello S and Nuez F (2006) Characterization and selection of balanced sources of variability for breeding tomato (Lycopersicon) internal quality. Genetic Resources and Crop Evolution53: 907–923
Kearsey MJ and Pooni HS (1996) The genetical analysis of quantitative traits. Chapman and Hall, London, 381p.
Lecomte L, Duffe P, Buret M, Servin B, Hospital F and Causse M (2004) Marker-assisted introgression of five QTLs controlling fruit quality traits into three tomato lines revealed interactions between QTLs and genetic backgrounds. Theoretical and Applied Genetics 109: 658-668
Lippman Z and Tanksley SD (2001) Dissecting the genetic pathway to extreme fruit size in tomato using a cross between the small-fruit wild species Lycopersicon pimpinellifolium and L.
esculentum var. Giant Heirloom. Genetics 158: 413-422
Liu BH (2004) Statistical genomics: linkage, mapping, and QTL analysis. CRC Press, New York, 610p.
Paterson AH, Damon S, Hewitt JD, Peterson S, Lincoln SA and TanksleySD (1991) Mendelian factors underlying quantitative traits in tomato: comparison across species, generations, and environments. Genetics127: 181-197
Rodriguez GR, Pratta GR, Zorzoli R and Picardi LA (2006) Recombinant lines obtained from an interspecific cross among
Lycopersicon species selected by fruit weight and fruit shelf
life. Journal of the American Society for Horticultural Science 131: 651-656
Schuelter AR, Finger FL, Casali VWD, Brommonschenkel SH and Otoni WC (2002) Inheritance and genetic linkage analysis of a firm-ripening tomato mutant. Plant Breeding 121: 338-342
Tanksley SD (1993) Mapping polygenes. Annual Reviews of Genetics 27: 205-233
Zorzoli R, Pratta G and Picardi LA (2000) Variabilidad para la vida postcosecha y el peso de los frutos en tomate para familias F3 de un híbrido interespecífico. Pesquisa Agropecuaria Brasileira 35: 2423-2427
Zuriaga E, Blanca JM, Cordero L, Sifres A, Blas-Cerdan WC, Morales R and Nuez F (2009) Genetic and bioclimatic variation in
Solanum pimpinellifolium. Genetic Resources and Crop