raimundoi (Freitas and Penny, 2001), C. genanigra (Freitas, 2003) and C. externa (Hagen,1861), which shows its greatest geographical distribution among all four and is not restricted to Brazil.
Molecular data – nuclear or mitochondrial genes – have been used to study phylogeny of both Chrysopidae family and Chrysoperla species (Haring and Aspock, 2004; Winterton and Freitas, 2006; Haruyama et al., 2008a, b); notwithstanding, the population structures of Chrysopidae species as a whole are still very poorly understood. In a study
1. Introduction
Among the so-called green lacewings (Neuroptera: Chrysopidae), the species of the genus Chrysoperla are well known as beneficial species in the biological control of agricultural pests (Senior and McEwen, 2001). The family Chrysopidae contains over 1,200 species and subspecies divided into at least 80 genera and subgenera distributed around the world on all continents, except Antarctica (Brooks and Barnard, 1990; Brooks, 1997). The genus Chrysoperla contains 36 species and four species can be found in Brazil: C. defreitasi (Brooks, 1994), C.
Chrysoperla externa (Neuroptera: Chrysopidae) from different
environments in Jaboticabal, state of São Paulo, southeastern Brazil
Morales, AC.
*
, and Freitas, S.
*
Departamento de Fitossanidade, Faculdade de Ciências Agrárias e Veterinárias – FCAV,
Universidade Estadual Paulista – UNESP, Rod. Paulo Donato Castellane, s/no, CEP 14884-900, Jaboticabal, SP, Brazil
*e-mail: dri_morales@yahoo.com.br, serfre@fcav.unesp.br
Received October 19, 2009 – Accepted February 23, 2010 – Distributed November 30, 2010 (With 2 figures)
Abstract
The green lacewings (Chrysopidae) belong to the Order Neuroptera and are described as voracious predators in the larval stage and sometimes also in their adulthood. They are an important group used in integrated biological control in field and horticultural crops. Individuals of Chrysoperla externa were collected during 2007 until March 2008 in five different locations in Jaboticabal, SP, with all the seasons sampled. Thirty six sequences with 805 pairs of bases for the gene mitochondrial Citochrome Oxidase I (COI) were analysed. The genetic parameters revealed 24 haplotypes for this population, a total of 36 mutations and haplotype diversity of 0.956. The data of genetic distance and population structure calculated for this population considering the different areas and seasons, revealed a great genetic similarity and high degree of genetic sharing between individuals sampled. It showed that the species Chrysoperla externa from Jaboticabal, SP, is a single population, without genetic structure neither due to the area of origin nor to the seasons of the year.
Keywords:Chrysoperla externa, green lacewing, mitochondrial DNA, population structure.
Caracterização haplotípica mitocondrial de
Chrysoperla externa
(Chrysopidae: Neuroptera)
em distintos ambientes de Jaboticabal, Estado de São Paulo, Sudeste do Brasil
Resumo
As espécies de crisopídeos pertencem à Ordem Neuroptera e são caracterizados como vorazes predadores na fase larval e algumas vezes também na fase adulta. Trata-se de um importante grupo usado no controle biológico de pragas da agricultura. Indivíduos de Chrysoperla externa foram coletados ao longo do ano de 2007 até março de 2008 em cinco locais distintos da localidade de Jaboticabal, SP, de modo que todas as estações do ano foram amostradas. Analisaram-se 36 sequências com 805 pares de bases para o gene mitocondrial Citocromo Oxidase I (COI). Os parâmetros genéticos de variação intrapopulacional revelaram 24 haplótipos para esta população, num total de 36 mutações e diversidade haplotípica de 0,956. Os dados de distância genética e de estrutura populacional calculados para esta população, considerando os distintos locais e as estações do ano, revelaram uma grande similaridade genética e alto grau de compartilhamento genético entre os indivíduos amostrados. Ficou evidente que a espécie Chrysoperla externa em Jaboticabal, SP está constituída de uma só população, não apresentando estruturação genética nem em função dos locais de coleta nem em função da sazonalidade.
population will only be established if the environmental pressure factors are matched by their corresponding support capacities. Therefore, knowing their genetic structure is of paramount importance in the process of choosing pest controlling populations to be field released.
2. Materials and Methods
2.1. Biological material
The thirty six specimens used in this study were collected in five places throughout 2007 until March 2008. All the seasons were sampled in an area of approximately 504 ha (Table 1), containing both wild and cultivated vegetation, located in the municipality Jaboticabal, in the state of São Paulo, Brazil (21º 15’ 22” S and 48º 18’ 58” W). The different collection places were chosen according to their different vegetation culture characteristics plus geographical location, so that the areas chosen were not neighbouring areas.
Thus, the selected places for sampling were: P1 – experimental nursery, area of native vegetation type, inside a stream riparian vegetation; P2 – green house, place of cultivation of various fruit trees, such as some citrus, cashew, passion fruit, coconut, and also corn and sunflower seed; P3 – mixed orchard, an area which cultivates only citrus species, such as oranges, lemons and tangerines; P4 – monoculture orchard, an area which cultivates only guava and; P5 – an area of eucalyptus, a eucalyptus cultivation (Figure 1). The identification of individuals was performed performed by Lourenço et al. (2006) using two populations
of the Brazilian species Chrysoperla externa, the results showed that the two populations were genetically distinct, suggesting the existence of a genetic structure in populations of the species in question.
However, until now, very little has been done in terms of describing and understanding the intraspecific and interspecific variation among these distinct populations of Chrysoperla externa, despite these parameters being very important to reach a correct specific taxonomic identification, which guarantees success in programs of biological control, in addition to allowing the proper understanding of gene flow process and population structure among sub-populations. In molecular methods, mitochondrial DNA is generally considered an excellent marker for genealogical inferences at the intraspecific level and particularly so, the gene cytochrome oxidase I (COI), which is one of the genes more widely utilised in systematic and populational studies (Avise, 2004).
Thus, the purpose of this research is the investigation of Chrysoperla externa’s genetic diversity, genetic and population structure in the study area, utilising mitochondrial gene markers. The importance of the present study is derived from the well known fact that the adaptability of any given population is dependent on its phenotypic and ecological plasticity as well, and that the pest control field success of a biological agent – in this case, green lacewings –, is directly dependent on the choice of the population chosen to be released in the field. Obviously, the introduced pest controlling
a b
belonged. Among-haplotype comparisons were based on Φ-analogues of Wright’s (1965) F-statistics. Significance was determined using 1,000 permutations with statistical significance of 5%.
3. Results
3.1. mtDNA haplotype diversity
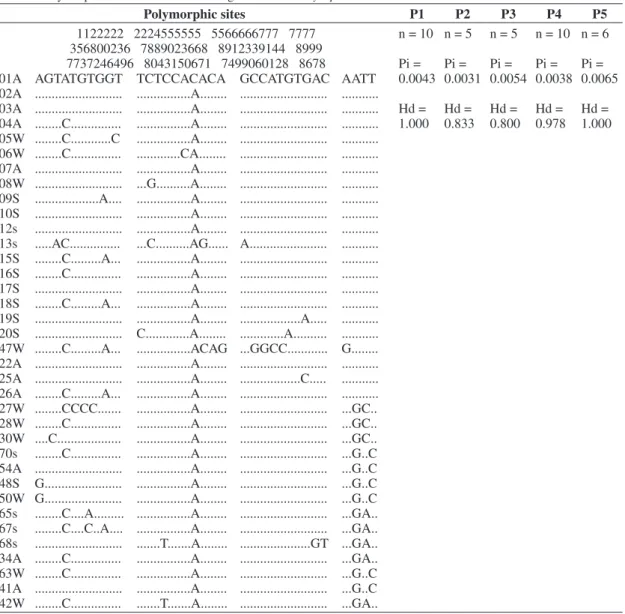
A 805-bp fragment was used in all the analyses of the 36 individuals, including 10 individuals from P1 locality, five individuals from P2, five individuals from P3, 10 individuals from P4 and six individuals from P5. No insertions, deletions or stop codons were detected in the analyses. The average percentage base composition was 42.7% thymine, 29.4% adenine, 13.5% cytosine and 14.4% guanine. Overall, 34 polymorphic sites were observed, defining 24 haplotypes, with an overall diversity (h) of 0.956 ± 0.023. Nucleotide diversity was lower (Pi) than 0.00462 ± 0.00065, the total number of mutations (η) was 36 and the average number of nucleotide differences (k) was 3.722 (Table 2).
3.2. Data analysis
The genetic distance was calculated for the total population distributed among distinct localities and seasons of the year, using the model of Kimura 2-parameter (Kimura, 1980). For the population as a whole, the highest value of genetic distance was 0.043, found between individuals from the place P1 and P5 (experimental nursery and area of eucalyptus, respectively). In both groups, individuals collected in the same locality and season of the year presented the same value of genetic distance, which was 0.005 (Tables 3 and 4). A dendrogram was produced using the Neighbor-Joining (Saitou and Nei, 1987), and it was tested by 1,000 random permutations using bootstrap, with the values on the basal nodes. The analysis of molecular variance calculated for the sample partitioned in five localities and the four seasons showed values of FST = 0.000 and 100% of genetic variation is intrapopulational, these values were significant (p = 0.000) only when the five collecting localities were jointly analysed (Table 5).
by genitalia (Freitas and Penny, 2001) and all specimens were stored in absolute alcohol for molecular analysis and numerically coded – voucher number. All the biological material used in the analysis is deposited in the Laboratório de Biologia Molecular de Crisopídeos do Departamento de Fitossanidade da FCAV-UNESP.
2.2. Total DNA extraction, polymerase chain reaction (PCR) and sequencing
The total DNA was extracted from a single individual preserved in ethanol, using the set of reagents Wizard™ Genomic DNA Purification Kit (Promega), supplemented with 20 mg/ml Proteinase K, following the manufacturer’s protocols with some small changes. The homogenate individuals were incubated at 55° C for 3 hours. A fragment of the mitochondrial gene encoding the first subunit of COI (cytochromo oxidase) was amplified via PCR (Mullins and Faloona, 1987) using the primers C1-J-2183 (5’ CAACATTTATTTTGATTTTTTGG 3’) and TL2–N-3014 (5’ TCCATTGCACTAATCTGCCATATTA 3’) (Simon et al.,1994). PCR was performed in 25 µL reactions containing 2 µL 10X buffer, 1.5 mm MgCl2, 0.4 µm dNTPs, 0.4 µm each primer, 1.5 unit Taq polymerase. The thermal cycling conditions were: initial denaturation at 94° C (2 minutes), 35 cycles of 94° C (40 seconds), 55° C (50 sec.), 72° C (1 second) and 72° C (10 minutes) for final annealing. Parts of the PCR products were run on 1% agar electrophoresis gel to check the amplification of DNA. All reaction products were purified by using the set of reagents Wizard® SV Gel and PCR Clean-Up System (Promega), following the manufacturer’s protocols. Purified PCR products were sequenced using the same primers used in PCR directly using BigDye™ Terminator version 3.1 (Perkin- Elmer Applied Biosystems). Sequencing was performed on an ABI Prism 3100 Genetic Analyzer, with the same conditions on PCR. After the sequencing, the fragment was submitted to several washes with isopropanol 75% followed by centrifugation.
2.3. Analysis of the sequences
The raw sequence chromatographs were edited using the program Chromas version 1.55© (Technelysium Pty Ltd, 1998), and aligned using the program BioEdit v. 5.0.9 (Hall, 1999). Nucleotide diversity (Pi, Nei 1987, Eq. 10.5 or 10.6), haplotype diversity (Hd, Nei 1987, Eq. 8.4 and 8.12), total number of mutations Eta (η, Nei 1987, Eq. 10.3), average number of nucleotide differences (k) and number of polymorphic (segregating) sites (S) were calculated with DnaSP v. 4.00 for the specimens as a whole (Rozas et al. 2003).The average percentage of bases in all sequences of DNA samples was estimated using the program MEGA v.4 (Tamura et al., 2007). In order to estimate the levels of genetic distance, a distance matrix was calculated through the model of Kimura 2-parameter (Kimura, 1980), and the dendrogram was obtained using Neighbor-Joining (Saitou and Nei, 1987). It was tested by 1,000 random permutations using the MEGA v.4 (Tamura et al., 2007) program. The Arlequin v. 2.000 (Schneider et al., 2000) program estimated the hierarchical analysis of molecular variance (AMOVA, Excoffier et al., 1992), between the distinct places and seasons in which the individuals
Table 1. Sample areas, identification codes (Voucher) and number of Chrysoperla externa individuals (N) analysed in Jaboticabal, SP.
Places Codes – voucher N P1 1, 5, 9, 15, 16, 27, 28, 34, 50, 63 10
P2 2, 3, 6, 22, 30 5
P3 7, 10, 25, 47, 54 5
P4 4, 8, 17, 18, 19, 20, 26, 41, 42, 48 10
P5 12, 13, 65, 67, 68, 70 6
Total 36
Table 3. Nei’s genetic distance calculated for five places of origin of Chrysoperla externa from Jaboticabal, SP.
P1 P2 P3 P4 P5
P1 – – – – –
P2 0.004 – – – –
P3 0.004 0.003 – – –
P4 0.004 0.002 0.003 – –
P5 0.006 0.005 0.006 0.005 –
P1 - experimental nursery; P2 - green house; P3 - mixed orchard; P4 - monoculture orchard; P5 - area of eucalyptus.
Table 4. Nei’s genetic distance calculated for seasons of years of Chrysoperla externa from Jaboticabal, SP.
Spring Summer Autumn Winter
Spring – – – –
Summer 0.005 – – –
Autumn 0.003 0.005 – –
Winter 0.005 0.006 0.005 –
Table 2. Polymorphic sites for mitochondrial gene COI of Chrysoperla externa.
Polymorphic sites P1 P2 P3 P4 P5
1122222 2224555555 5566666777 7777 356800236 7889023668 8912339144 8999 7737246496 8043150671 7499060128 8678
01A AGTATGTGGT TCTCCACACA GCCATGTGAC AATT 02A ... ...A... ... ... 03A ... ...A... ... ... 04A ...C... ...A... ... ... 05W ...C...C ...A... ... ... 06W ...C... ...CA... ... ... 07A ... ...A... ... ... 08W ... ...G...A... ... ... 09S ...A.... ...A... ... ... 10S ... ...A... ... ... 12s ... ...A... ... ... 13s ...AC... ...C...AG... A... ... 15S ...C...A... ...A... ... ... 16S ...C... ...A... ... ... 17S ... ...A... ... ... 18S ...C...A... ...A... ... ... 19S ... ...A... ...A... ... 20S ... C...A... ...A... ... 47W ...C...A... ...ACAG ...GGCC... G... 22A ... ...A... ... ... 25A ... ...A... ...C... ... 26A ...C...A... ...A... ... ... 27W ...CCCC... ...A... ... ...GC.. 28W ...C... ...A... ... ...GC.. 30W ....C... ...A... ... ...GC.. 70s ...C... ...A... ... ...G..C 54A ... ...A... ... ...G..C 48S G... ...A... ... ...G..C 50W G... ...A... ... ...G..C 65s ...C....A... ...A... ... ...GA.. 67s ...C....C..A.... ...A... ... ...GA.. 68s ... ...T...A... ...GT ...GA.. 34A ...C... ...A... ... ...GA.. 63W ...C... ...A... ... ...G..C 41A ... ...A... ... ...G..C 42W ...C... ...T...A... ... ...GA..
n = 10
Pi = 0.0043
Hd = 1.000
n = 5
Pi = 0.0031
Hd = 0.833
n = 5
Pi = 0.0054
Hd = 0.800
n = 10
Pi = 0.0038
Hd = 0.978
n = 6
Pi = 0.0065
Hd = 1.000
n = sample size; Hd = Haplotype diversity; Pi = Nucleotide diversity (per site). S – Spring, s – Summer, A – Autumn and W – Winter.
4. Discussion and Conclusions
As has been said before, correct specific identification is essential for success in programs of biological control and therefore the knowledge of intraspecific variation
Table 5. ANOVA analysis of Chrysoperla externa in five places. Source of
variation
Sum of squares
Variance components
Percentage of variation
Fixation indices
Among populations 2,000 0.0000 Va 0.000 FST: 0.0000
Within groups 15,000 0.5000 Vb 100.00 –
Total 17,500 0.5000 – –
Figure 2. Dendrogram generated from the method of Neighbor-Joining with mitochondrial sequences of the Cytochrome
considerations of Mackauer (1976). Thus, the populational genetic structure of the species was examined, from five different places of collection and in all seasons of the year, utilising 36 individuals, which were sequenced and had a total of 805 nucleotide sites examined.
During this study, it was possible to infer that the genetic distance is extremely low, with values that approximate 0.005 independently of the type of analysis — including either the total population, distinct collecting localities or season of the year. This indicates a great genetic similarity in this population of Chrysoperlaexterna in terms of sharing of haplotypes. Low values of genetic distance were also found for the group of cryptic species of the group Chrysoperla carnea (Lourenço et al., 2006), studied using four different gene markers, as was also the case in a study, using isozymes, performed utilising seven populations of green lacewings of the genus Chrysoperla (Wells, 1994).
This great genetic similarity found for the species Chrysoperla externa from Jaboticabal, SP highlights its genetic mitochondrial integrity, which independent of the collection locations and the season of the year sampled, still generated results indicating that it is the same population. This can be viewed in the dendrogram generated by the Neighbor-Joining method, which has three major branches, supported by the values of “bootstrap” (Figure 2). Each of the three branches contains results derived from individuals collected in all five localities and four seasons of the year uniformly distributed. Thus, it is not possible to identify a structure in this population, neither geographical nor seasonal. The absence of structure in this population may be due to the high degree of gene flow (indicated by the value of FST = 0,000) among the individuals from distinct places, leading to the genetic homogeneity.
Therefore, is possible to conclude that the species Chrysoperla externa from Jaboticabal, SP, to this genetic marker – COI – forms a single population and that in the use of samples of this population for biological control, neither the collection location, within the general study area, nor the seasons of the year when the samples were collected, will interfere in the establishment of mass rearing of individuals for posterior field release. However, to understand the species as a whole, more studies are necessary, sampling additional populations from different localities and also utilising other, genetic and morphological markers, not only to understand each in situ population, but also to understand the evolutionary and systematic pattern of each one of them based on their respective genetic variability.
Acknowledgements — The authors thank Ana Paula M. B. Battel for helping with the collections of green lacewings, Taís C. Lavagnini and Mariah V. Baggio for the useful comments on earlier versions. Research supported by CNPq – ProTax (Proc. n° 150150/2007-5) and Fapesp (Proc. n°2006/03494-0).
References
AVISE, JC., 2004. Molecular markers, Natural history and Evolution. Sunderland: Sinauer, 684 p.
BROOKS, SJ. and BARNARD, PC., 1990. The green lacewings of the world: a generic review (Neuroptera: Chrysopidae). Bulletin of the British Museum Natural History (Entomology), vol. 59, no. 2, p. 117-286.
BROOKS, SJ., 1994. A taxonomic review of the common green lacewing genus Chrysoperla (Neuroptera: Chrysoperla). Bulletin of the British Museum Natural History (Entomology), vol. 63, no. 2, p. 137-210.
-, 1997. An Overview of the Current Status of Chrysopidae (Neuroptera) systematics. Deutsche Entomologische Zeitschrift, vol.44, no. 2, p. 267-275.
FREITAS, S. and PENNY, ND., 2001. The green lacewings (Neuroptera: Chrysopidae) of Brazilian agroecosystems. Proceedings of the California Academy of Sciences, vol. 52, no. 19, p. 245-395.
FREITAS, S., 2003. Chrysoperla Steinmann, 1964 (Neuroptera: Chrysopidae): descrição de uma nova espécie do Brasil. Revista Brasileira de Entomologia, vol. 47, no. 3, p. 385-387.
HAGEN, H., 1861. Synopsis of the Neuroptera of North America, with a list of the South American species. Smithsonian Miscellaneous Collections, vol. 49, p. 1-347.
HALL, TA., 1999. BioEdit: A user-friendly biological sequence alignment editor and analysis program for Windows 95/98/NT. Nucleic Acids Symposium Series, vol. 41, p. 95-98.
HARING, E. and ASPOCK, U., 2004. Phylogeny of the Neuropterida: a first molecular approach. Systematic Entomology, vol. 29, no. 3, p. 415-430.
HARUYAMA, N., MOCHIZUKI, A. and DUELLI, P., 2008a. Green lacewing phylogeny, based on three nuclear genes (Chrysopidae, Neuroptera). Systematic Entomology, vol. 33, no. 2, p. 275-288.
HARUYAMA, N., NAKA, H. and MOCHIZUKI, A., 2008b. Mitochondrial Phylogeny of Cryptic Species of the Lacewing Chrysoperla nipponensis (Neuroptera: Chrysopidae) in Japan. Annals of the Entomological Society of America, vol. 101, no. 6, p. 971-977.
HORNE, PA., NEW, TR. and PAPACECK, D., 2001. Preliminary notes on Mallada signatus (Chrysopidae) as a predator in field crops in Australia. In MCEWAM, PK., NEW, TR. and WHITTINGTON, A. (Eds.). Lacewings in the Crop Environment. Cambridge, UK: Cambridge University Press, p. 395-397.
KIMURA, M., 1980. A simple method for estimating evolutionary rate of base substitutions through comparative studies of nucleotide sequences. Journal of Molecular Evolution, vol. 16, no. 2, p. 111-20.
LOURENÇO, P., BRITO, C., BACKELJAU, T., THIERRY, D. and VENTURA, MA.,2006. Molecular systematics of the Chrysoperla carnea group (Neuroptera: Chrysopidae) in Europe. Journal of Zoological Systematics and Evolutionary Research, vol. 44, no. 2, p. 180-184.
MULLINS, KB. and FALOONA, FA., 1987. Specific synthesis of DNA in vitro via a polymerase-catalysed chain reaction. Methods in Enzymology, vol. 155, p. 335-350.
NEI, M., 1987. Molecular Evolutionary Genetics. New York: Columbia University Press.
ROZAS, J., SÁNCHEZ-DELBARRIO, J. C., MESSEGUER, X. and ROZAS, R. 2003. DnaSP, DNA polymorphism analyses by the coalescent and other methods. Bioinformatics, vol. 19, p. 2496-2497.
SAITOU, N. and NEI, M., 1987. The neighbor-joining method: a new method for reconstructing phylogenetics trees. Molecular Biology and Evolution, vol. 4, p. 406-425.
SCHNEIDER, S., ROESSLI, D. and EXCOFFIER, L., 2000. ARLEQUIN: A Software for Population Genetics Data Analysis. Version 2.000. Geneva: Genetics and Biometry Laboratory, Department of Anthropology, University of Geneva.
SENIOR, LJ. and MCEWEN, PK., 2001. The use of lacewings in biological control. In McEWAM, PK., NEW, TR. and WHITTINGTON, AE. (Eds.). Lacewings in the Crop Environment. Cambridge, UK: Cambridge University Press, p. 395-397.
SIMON, C., FRATI, F., BECKENBACH, A., CRESPI, B., LIU, H. and FLOOK, P., 1994. Evolution, weighting, and phylogenetic utility of mitochondrial gene sequences and a compilation of conserved Polymerase Chain Reaction primers. Annals of the Entomological Society of America, vol. 87, no. 6, p. 651-701. TAMURA, K., DUDLEY, J., NEI, M. and KUMAR, S., 2007. MEGA4: Molecular Evolutionary Genetics Analysis (MEGA) Software Version 4.0. Molecular Biology and Evolution., vol. 24, no. 8, p. 1596-1599.
Technelysium Pty Ltd. 1998. CHROMAS 1.55 Queensland, Australia. Available from: <http://www. Technelsysium.com. au/chromas.html>.
WELLS, MM., 1994. Small genetics distances among populations of green lacewings of the genus Chrysoperla (Neuroptera: Chrysopidae). Annals of the Entomological Society of America, vol. 87, no. 6, p. 737-744.
WINTERTON, S. and FREITAS, S., 2006. Molecular phylogeny of the green lacewings (Neuroptera: Chrysopidae). Australian Journal of Entomology, vol. 45, no. 3, p. 235-243.