Sitodiplosis mosellana
in Northern China
Yun Duan1,2, Yu-qing Wu1*, Li-zhi Luo2*, Jin Miao1, Zhong-jun Gong1, Yue-li Jiang1, Tong Li1
1Institute of Plant Protection, Henan Academy of Agricultural Sciences, Key Laboratory of Crop Pest Control of Henan Province, Key Laboratory of Crop Integrated Pest Management of the Southern of North China, Ministry of Agriculture of the People’s Republic of China, Zhengzhou, China,2Institute of Plant Protection, Chinese Academy of Agricultural Sciences, State Key Laboratory for Biology of Plant Diseases and Insect Pests, Beijing, China
Abstract
The wheat midge, Sitodiplosis mosellana, is an important pest in Northern China. We tested the hypothesis that the population structure of this species arises during a range expansion over the past 30 years. This study used microsatellite and mitochondrial loci to conduct population genetic analysis ofS. mosellanaacross its distribution range in China. We found strong genetic structure among the 16 studied populations, including two genetically distinct groups (the eastern and western groups), broadly consistent with the geography and habitat fragmentation. These results underline the importance of natural barriers in impeding dispersal and gene flow ofS. mosellanapopulations. Low to moderate genetic diversity among the populations and moderate genetic differentiation (FST= 0.117) between the two groups were also found. The populations in the western group had lower genetic diversity, higher genetic differentiation and lower gene flow (FST= 0.116,Nm= 1.89) than those in the eastern group (FST= 0.049,Nm= 4.91). Genetic distance between populations was positively and significantly correlated with geographic distance (r= 0.56,P,0.001). The population history of this species provided no evidence for population expansion or bottlenecks in any of these populations. Our data suggest that the distribution of genetic diversity, genetic differentiation and population structure of S. mosellana have resulted from a historical event, reflecting its adaptation to diverse habitats and forming two different gene pools. These results may be the outcome of a combination of restricted gene flow due to geographical and environmental factors, population history, random processes of genetic drift and individual dispersal patterns. Given the current risk status of this species in China, this study can offer useful information for forecasting outbreaks and designing effective pest management programs.
Citation:Duan Y, Wu Y-q, Luo L-z, Miao J, Gong Z-j, et al. (2013) Genetic Diversity and Population Structure ofSitodiplosis mosellanain Northern China. PLoS ONE 8(11): e78415. doi:10.1371/journal.pone.0078415
Editor:Joa˜o Pinto, Instituto de Higiene e Medicina Tropical, Portugal
ReceivedMay 15, 2013;AcceptedSeptember 20, 2013;PublishedNovember 12, 2013
Copyright:ß2013 Duan et al. This is an open-access article distributed under the terms of the Creative Commons Attribution License, which permits unrestricted use, distribution, and reproduction in any medium, provided the original author and source are credited.
Funding:This work was sponsored by the China Agricultural Research System (CARS-03). The funders had no role in study design, data collection and analysis, decision to publish, or preparation of the manuscript.
Competing Interests:The authors have declared that no competing interests exist.
* E-mail: yuqingwu36@hotmail.com (YQW); lzluo@ippcaas.cn (LZL)
Introduction
The wheat midge (Ge´hin) Sitodiplosis mosellana (Diptera: Cecidomyiidae) is one of the most destructive pests of wheat, and is distributed in most wheat-producing regions of the world, including Europe, Asia, and North America [1–3].S. mosellanawas first detected in China in the early 1310s. This species has one generation per year. Females live for 3–7 days and lay 60–80 eggs. The larvae hatch after 4–7 days, crawl into the floret and feed on the surface of developing wheat kernels for 2–3 weeks. Once moist conditions are detected, the mature larvae drop to the ground, burrow into the soil and overwinter as diapausing cocooned larvae. Most overwintering larvae may remain in diapause for 1–2 years, though a few can maintain diapause for up to12 years [4]. Wheat midge infestation can result in kernels shriveling, cracking and deformity, and finally reduce crop yields and lower the grade of harvested grain [5]. In China, wheat midge outbreaks have occurred many times in the past 60 years, causing economic damage to wheat yields, especially in northern China [3].
Northern China is the major wheat-producing area in China, and is a region with complex topography (including plateaus, plains, rivers, lakes, basins, foothills and mountains) and variable climate. This region is also the main distribution area of S.
mosellana. The geographical distribution ofS. mosellanaover the past 30 years has shifted to the northeast of about 400 km [6]. Continuing significant changes are expected during the coming decades. Since the beginning of the 21st century, S. mosellana
outbreaks have continued to affect certain wheat fields [6]. For example, in 2005–2007, Henan and Hebei, which are the main wheat-growing areas in China, experienced serious damage with the loss of more than 2 million hectares of wheat. Its widespread agricultural impact and rapidly expanding range mean that althoughS. mosellanahas been effectively controlled, it still remains a serious pest in some regions of China [3,7].
Genetic diversity and population structure are important aspects of the population genetics of agricultural insects. Comparative studies of these aspects can therefore help to elucidate the factors affecting their population levels. The results of previous studies have shown that the genetic diversity and population structure of a species may be affected by several factors, such as climate change, environmental and ecological factors, natural barriers, human activities, migration and gene flow, and that these factors often act in combination [3,8–11].
Molecular genetic techniques, such as simple sequence repeat and mtDNA analyses, can be used to conduct a genetic analysis of
information for understanding possible local adaptation and dispersal patterns, and for further clarifying the relationship between genetic variation and outbreaks of wheat midge in China. However, the limited number of markers available for analyzing geographic populations and individuals means that few population genetic studies of S. mosellana have been conducted [5,12–15]. Previous studies showed genetic variation and genetic differenti-ation among geographical populdifferenti-ations of this species, and some degree of population structure. However, these studies covered a relatively small geographic area (not including populations from new outbreak areas) and a much smaller population (only 2–10 individuals), and used a limited number of molecular markers and limited statistical analyses [5,12–15]. These results provided insufficient information for a clear understanding of the genetic diversity and population structure of this species.
Based on background knowledge, we used two molecular markers (microsatellites and mtDNA) that have been widely used in many insect population genetic studies [16–19] to detect the genetic diversity, genetic differentiation and population structure
ofS. mosellanaacross a broad geographic area in northern China.
This is the first study to investigate the population genetics ofS.
mosellana comprehensively, and the results may provide more
useful data for forecasting outbreaks and managing this species in China (e.g. by breeding resistant wheat varieties). These findings may also have significant implications for other regions where this species occurs.
Materials and Methods
Ethics statement
Sitodiplosis mosellanais a pest insect of wheat. The study of this pest is welcomed by farmers because understanding the behavior of this pest may be helpful to protect their wheat from pest damage. Thus, no specific permits were required for the described field studies.This study was carried out on private land, and we had got permission from the owners of these sites to conduct this study. Additionally, the field studies did not involve endangered or protected species.
Sample collection and preparation
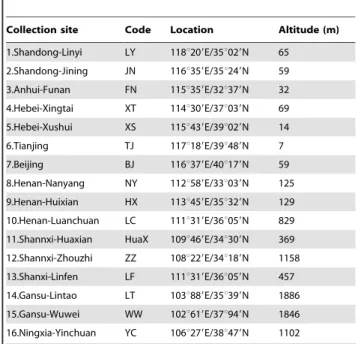
Soil samples containing larvae ofS. mosellanawere collected from 16 geographic sites in northern China from May to Sep. in 2009– 2011 (Table 1), ranging from the east coast, the North China Plain to the Northwest Plateau (102u–118uE; 32u–40uN; spanning 16u
longitude and 8ulatitude and including an altitude gradient). Soil samples from five sites in a field, representing one geographical population of S. mosellana, were collected (each site, 10610620 cm) and then mixed together. Larvae (still in the soil) were maintained at 2261uC, 70–75% relative humidity and a photoperiod of 14-h light:10-h dark through pupation and adult emergence stages. Adults from each site were collected daily and stored individually in 75% ethanol at 220uC until DNA extraction was performed according to Collins et al. [20].
Microsatellite analysis
All individuals were genotyped at four microsatellite loci: EW353, EW548, EW892 and Tig99 [21]. Forward primers were labeled with fluorescent dye (Sangon Biotech Co., Ltd., Shanghai, China). The primers used were: EW353-F: FAM-GAGTGG-CAGGAAACAAGAGC, EW353 -R: TCATTGATGGAA-GACTCACTT; EW548-F: ROX-TGCGAATCGATACCA-TAGGC, EW548-R: ATTGCCTGGAATTTTCCCTC; EW892-F: ROX-CCTCTCATTGATGCGTGTCT, EW892R: TTGAGTACCAGATTGCATTTCA; Tig99-F:
FAM-GTGGAAATACGGTGCCATTT, Tig99-R: TCTTTCTCTCTCTCTGGCGG, respectively. The PCR reac-tions were carried out in a 20-mL reaction mixture containing 20– 40 ng total DNA, 2.0mL of 106Taq DNA polymerase reaction buffer (Mg2+ free), 1.8
mL of 25 mmol/L Mg2+, 2mL of 0.5 mmol/L dNTPs, 1.0mL of 10 pmol/mL each primer, 11mL ddH2O, 0.2mL of Taq E (5 U/mL) (Takara, Shiga, Japan) and 2mL of DNA template. Reactions were carried out using a SensoQuest LabCycler 2.2 (SensoQuest GmbH, Go¨ttingen, Germany) thermocycler for 35 cycles. After initial denaturation for 3 min at 95uC, each cycle comprised denaturation at 94uC for 1 min, 45 s at the annealing temperature of each primer, 50 s extension at 72uC, with a final extension at 72uC for 10 min. Annealing temperatures varied from 55uC for EW353, 56uC for EW548 and Tig99 to 57uC for EW892. Following amplification, the products were visualized at Sangon Biotech Co., Ltd. (Shanghai, China) using an ABI 3730XL automated sequencer (Applied Biosystems, Foster City, CA, USA). Microsatellite alleles were analyzed using GeneMapper4.0 software (Applied Biosys-tems). Microsatellite data were checked for errors and null alleles with MICROCHECKER V2.2.3 [22].
Mitochondrial DNA amplification and sequencing Polymerase chain reaction (PCR) was used to amplify the target sequences from ND4 and COX3 mtDNA using the following primers developed in this study: ND4-F (59- GAAATAGGAG-AAGATATATT-39), ND4-R (59 -TTGAAATAAGAT-TAATTCCTAC-39); COX3-F (59 -ACGA-GATGTAACTCGA-GAAAG-39), COX3-R (59 -ATCAAGCTGCAGCTTCAAATC-39). Annealing temperatures were 45uC for ND4 and 52uC for
COX3. Following amplification, the products were sequenced by Sangon Biotech Co., Ltd. using the ABI-PRISM 3730 genetic analyzer (Applied Biosystems) using the same primers. The obtained sequence chromatograms were read with Chromas 2.33 (Technelysium Pty. Ltd., South Brisbane, Australia). All
Table 1.Locations of 16 populations ofS. mosellana collected in China.
Collection site Code Location Altitude (m)
1.Shandong-Linyi LY 118u209E/35u029N 65 2.Shandong-Jining JN 116u359E/35u249N 59
3.Anhui-Funan FN 115u359E/32u379N 32
4.Hebei-Xingtai XT 114u309E/37u039N 69 5.Hebei-Xushui XS 115u439E/39u029N 14
6.Tianjing TJ 117u189E/39u489N 7
7.Beijing BJ 116u379E/40u179N 59 8.Henan-Nanyang NY 112u589E/33u039N 125
9.Henan-Huixian HX 113u459E/35u329N 129
10.Henan-Luanchuan LC 111u319E/36u059N 829 11.Shannxi-Huaxian HuaX 109u469E/34u309N 369
12.Shannxi-Zhouzhi ZZ 108u229E/34u189N 1158
13.Shanxi-Linfen LF 111u319E/36u059N 457
14.Gansu-Lintao LT 103u889E/35u399N 1886 15.Gansu-Wuwei WW 102u619E/37u949N 1846
16.Ningxia-Yinchuan YC 106u279E/38u479N 1102
haplotypes have been submitted to GenBank (Accession numbers: KF030063–KF030131).
Data analysis
Midges collected from each sampling site were assumed to represent local populations for the purposes of statistical analyses. To investigate the hypothesis that ecological, geographic and climatic factors may affect genetic variation, gene flow and population structure in this species, samples were divided into two groups throughout the region: the eastern group, including 10 populations (LY, JN, FN, XT, XS, TJ, BJ, NY, HX and LC); and the western group including six populations (HuaX, ZZ, LF, LT, WW and YC).
Genetic diversity
For microsatellites, linkage disequilibrium was tested among all pairs of loci across all populations using GenePop 4.0 [23] and exact probability tests. An exact test for Hardy-Weinberg equilibrium (HWE) was conducted per locus and over all loci in each population using the same program. Corrections for multiple tests were performed by Bonferroni corrections. The extents of differences within and among populations were evaluated by basic statistical analyses including effective number of alleles (Ne), observed heterozygosity (Ho) and expected heterozygosity (He) for each population, calculated using PopGen 32 (version 1.31) [24]. The number of alleles, allelic richness and gene diversity were calculated using FSTAT version 2.9.3.2 [25]. Correlation analyses of genetic diversity characteristics (allelic richness, expected heterozygosity and gene diversity) and their associations with latitude, longitude and altitude were conducted to test for possible clinal relationships.
Sequence data for mtDNA were assembled and aligned using Clustalx2 (version 2.0.12) [26] and MEGA 5 [27] and verified visually. DnaSP version 4.0 [28] was used to determine the number of variable sites, identify haplotypes, and calculate genetic diversity (haplotype diversity (HD) and nucleotide diversity (p) as defined by Nei [29].
Genetic differentiation and gene flow among populations
For microsatellites,FSTandNmbased on allele frequencies were calculated to estimate the degree of genetic differentiation over all populations using PopGen32. Pairwise FST values were used to estimate and assess the magnitude of differentiation among geographic populations using Arlequin v 3.5.1.2 [30] and tested for significant differences using 10,000 permutations. PairwiseDest values [31] for each population were also calculated using the web based resource SMOGD v1.2.5 [32]. We used 1,000 bootstrap replicates and the harmonic mean ofDestacross loci. For mtDNA
ND4, pairwise FST values based on haplotype frequencies were calculated using the program Arlequin v 3.5.1.2.
Haplotype diversity (HD), intrapopulation diversity (HS), total genetic diversity (HT), population differentiation (GST) and gene flow (Nm) were also compared in DnaSP between the eastern and western groups ofS. mosellana.
To determine if genetic and geographic distances between populations were significantly correlated, isolation by distance (IBD) was examined by testing the correlation between pairwise
FST and geographical distance using the Mantel test [33] (using GENEPOP 4.0 for microsatellites). IBD was also tested between the eastern and western populations. The linear distances between sampling sites were estimated using Google Earth (http://earth. google.com) with their coordinates. For testing of statistical
significance, 10,000 permutations in Mantel tests were used to test the null hypothesis that genetic distance and geographical distance were independent. These results were plotted in SPSS 12.0 for Windows (SPSS Inc., Chicago, IL, USA).
Population genetic structure
The Bayesian approach implemented in STRUCTURE version 2.2.3 [34] was used to analyze the geographic structures of S.
mosellana populations using multilocus genotype data. This
program uses a coalescent genetic approach to cluster similar multilocus genotypes intoKclusters, regardless of an individual’s geographical origin. We conducted eight independent runs for each value ofKranging from 1–12 using the admixture model and correlated allele frequencies. To detect the true K present in microsatellite data, an ad-hoc measureDK[34] fromK1–K12 was used across all runs. Each run consisted of a burn-in of 10,000 steps, followed by 20,000 Markov chain Monte Carlo repetitions. To apportion variance between the eastern and western groups of 16 S. mosellana populations identified by pairwise FST and STRUCTURE, hierarchical analysis of molecular variance (AMOVA) [35] based on FST (using mtDNA ND4 haplotype frequencies) was carried out using Arlequin. The AMOVA program allows the hierarchical partitioning of the variance components into three components: within populations, among populations within groups and among groups. Significance of fixation indices was also tested using a nonparametric permutation approach with 2,000 permutations using the same software.
Individual assignment and migrant detection
Each individual was assigned to a group (K= 2), previously inferred by STRUCTURE software using the Bayesian approach. Individuals were assigned to a group if the proportion ancestry $0.7; when no group was$0.7, the individual was unassigned and considered to be of mixed ancestry. Population assignment tests were also performed across all sites in this software (K= 5). Due to generally high levels of admixture, a threshold value of 70% was used when assigning membership of the sampling sites in the determined groups.
Assignment of individuals to their most likely population of origin was also performed with GENECLASS2 software [36]. This software was also used to identify S. mosellana first-generation migrant individuals using a partially Bayesian method [37] and Monte Carlo resampling algorithm [38] with 10,000 simulated individuals and type I error of 0.01. The probability that a certain individual came from a particular population was calculated using theLh/Lmaxlikelihood test statistic to determine the critical value of Lh/Lmax beyond which individuals were assumed to be migrants.
Phylogenetic relationships among populations and haplotypes
In order to explore the hierarchical relationships among S.
mosellanapopulations further, POPTREE 2 software [39] was used
to construct an unrooted neighbor-joining (NJ) tree based on values of Nei’s genetic distance [40] calculated in the same software by 1,000 bootstraps. MEGA 5 was used to construct an unrooted NJ tree based on values of genetic distance betweenND4
haplotypes by 1,000 bootstraps.
defined five groups of S. mosellana populations according to the results of STRUCTURE (K= 5) (group A: LY, JN, FN, XT, XS, TJ, BJ, NY and HX; group B: LC; group C: HuaX and ZZ; group D: LF and LT; group E: WW and YC).
Population demographic history and neutrality test Demographic history changes were analyzed for S. mosellana
using two neutrality tests (Tajima’sD[42] and Fu’sFS[43]) across 16 geographic populations and pairwise mismatch distributions for all populations combined and two groups separately using mtDNA. We calculated neutrality-test statistics in these popula-tions with 1,000 permutapopula-tions in Arlequin and DnaSP. Neutrality tests were used as an indication of recent population expansion when the null hypothesis of neutrality was rejected due to significant negative values (P,0.05 for D and FS). According to coalescent theory, a population usually exhibits a unimodal mismatch distribution following a recent population demographic or range expansion [44].
The program BOTTLENECK v1.2.02 [45] was used to look for genetic signatures of a recent bottleneck in each population. The Wilcoxon’s signed rank test [46] using three mutation models (e.g. the infinite allele model (IAM), the strict stepwise mutation model (SMM), and the two-phase model (TPM)) recommended by Piry et al. [47] was applied with 10,000 replications. A qualitative descriptor of the allele frequency distribution (mode-shift indicator) which discriminates between bottlenecked and stable populations was also used.
Results
The four microsatellites were amplified in 374 individuals. Considerable variation was observed at all microsatellite loci. All four loci investigated were polymorphic both within and among populations. There was no evidence for linkage disequilibrium within any of the four loci (P.0.002 for all after Bonferroni corrections). Most populations deviated significantly from HWE (P,0.01) (excluding LY, FN, XT and LC). Microchecker confirmed the presence of null alleles in three out of four loci (EW353, EW548 and EW892). Single locus deviations from HWE (after Bonferroni corrections with P,0.001) were attributed to heterozygote deficiency in 21 out of 64 tests. However, these loci did not show consistent deviations across all populations. We therefore assumed that processes causing this nonequilibrium were specific to those populations, and we thus continued to include those loci in subsequent analyses.
For mtDNA, the sequence alignment length of 16 populations
ofS. mosellanawas reduced to 603 forND4and 472 forCOX3to
ensure no missing data across 320 samples. No insertions or deletions were detected in any of the sequences. In total, 42 haplotypes forND4and 27 haplotypes forCOX3were identified in these populations. Populations in the eastern and western groups exhibited haplotype polymorphism for each of the two genes.
Population genetic diversity
Basic summary statistics of genetic diversity are presented in Table 2. Analysis showed that these populations of S. mosellana
contained a substantial fraction of genetic variation. The mean allele number (A) values across microsatellite loci ranged from 3.50 in WW to 7.00 in HuaX, with a mean value of 5.75. Observed heterozygosity (Ho) values and expected heterozygosity (He) values across loci ranged from 0.32–0.79 and 0.45–0.72, respectively. Excluding four populations of ZZ, LF, WW and YC, observed heterozygosity (Ho) values were lower than expected heterozygos-ity (He) values. Allelic richness (Ar) per population ranged from
3.09–6.64. The mean gene diversity across loci was 0.64 with the lowest in WW (0.44) and the highest in ZZ (0.72), indicating a high level of information of the chosen microsatellite. The inbreeding coefficient (Fis) ranged from 0.02–0.61. Combining ND4 and
COX3, 15 out of 16 populations exhibited comparatively high haplotype diversity (excluding WW). The haplotype diversity and nucleotide diversity of these populations ranged from 0.2860.016 to 0.8260.025 and 0.001360.0005 to 0.005860.0004, respec-tively. Reduced levels of mtDNA genetic diversity were observed in three populations of LT, WW and YC compared with the other 13 populations.
The present microsatellite data indicated that many populations (12 out of 16 populations) had a deficiency of heterozygotes with significantly positive F values (P,0.001). More generally, the eastern populations showed higher genetic diversity (mean allele number: 6.28, mean effective number of alleles: 3.92, mean alleles richness: 5.68) compared with the western populations (mean allele number: 4.88, mean effective number of alleles: 2.82, mean alleles richness: 4.52). This phenomenon was supported by mtDNA analysis.
Analysis of correlations between geographic variables and diversity parameters indicated that allelic richness, expected heterozygosity and genetic diversity were all negatively correlated with altitude (r=20.629, P,0.01; r=20.601, P,0.05;
r=20.588, P,0.05) and positively correlated with longitude (r= 0.569,P,0.05;r= 0.562,P,0.05;r= 0.553,P,0.05). Altitu-dinal trends were usually stronger than longituAltitu-dinal ones, especially in terms of allelic richness measures. There were no remarkable correlations (P.0.05) between latitude and several diversity parameters in this study.
Genetic differentiation and gene flow among populations
Genetic differentiation of all populations was measured using two different statistics (FST andDest) based on microsatellite data (Table 3). There was significant genetic differentiation among populations based onFSTestimates. The results indicated that 10 populations in the eastern region were completely different from six populations in the western part. PairwiseFST values ranged from 0.006–0.265 (mean 0.095), and pairwiseDestvalues ranged from 0.000–0.431 (mean 0.157). The pairwiseDestvalues showed an overall similar pattern to the pairwiseFST values, though the
Destvalues were on average slightly higher. An overall random-ization test of population differentiation was significant for all loci combined (P,0.001).
Pairwise FST values among the eastern group ranged from 0.014–0.107, and among the western group from 0.021–0.267, suggesting significant genetic differentiation and low levels of gene flow (FST= 0.116, Nm= 1.891) among the western populations compared with the eastern populations (FST= 0.046,Nm= 4.907). The meanFSTvalue between the eastern and western groups was 0.117. All the investigated loci contributed to this population differentiation (each individual locusP,0.001).
populations (P,0.001), among the eastern populations (HD= 0.767, HS= 0.693, HST= 0.099) and among the western populations (HD= 0.691, HS= 0.570, HST= 0.182). Although comparison of gene flow between the eastern and western groups
was significant (Nm.1), there was insufficient evidence to prevent genetic differentiation.
Applying the Mantel test, significant positive relationships between genetic and geographic distances were found over the
Table 2.Genetic diversity based on four microsatellite loci (using PopGen 32) from 374 samples and mtDNA sequences (ND4and COX3) (using FSTAT v2.9.3.2) from 320 samples ofS. mosellana.
Code Microsatellite loci mtDNA (ND4+COX3)
N A Ne Ho He Ar GD Fis N Hd p
1.LY 24 5.25 3.07 0.52 0.62 4.69 0.62 0.23 21 0.76(60.018) 0.0044(60.0004)
2.JN 24 6.75 4.57 0.32 0.71 6.03 0.65 0.33 21 0.72(60.021) 0.0039(60.0003) 3.FN 24 7.50 4.68 0.56 0.69 6.64 0.70 0.04 21 0.54(60.023) 0.0037(60.0002)
4.XT 24 6.00 3.81 0.45 0.71 5.50 0.71 0.22 23 0.67(60.014) 0.0045(60.0005)
5.XS 24 6.50 3.72 0.60 0.71 6.06 0.71 0.46 21 0.72(60.017) 0.0045(60.0003) 6.TJ 24 6.25 3.99 0.47 0.67 5.61 0.67 0.20 24 0.64(60.025) 0.0038(60.0004)
7.BJ 24 5.50 3.61 0.55 0.62 5.10 0.64 0.30 23 0.66(60.011) 0.0039(60.0002)
8.NY 24 6.75 4.30 0.58 0.66 5.96 0.65 0.40 20 0.68(60.013) 0.0038(60.0005)
9.HX 24 6.25 4.08 0.52 0.71 5.81 0.70 0.32 20 0.69(60.019) 0.0040(60.0004) 10.LC 24 6.00 3.35 0.40 0.62 5.36 0.64 0.02 22 0.82(60.025) 0.0055(60.0003)
11.HuaX 24 7.00 3.86 0.54 0.69 6.31 0.68 0.33 20 0.66(60.023) 0.0038(60.0002)
12.ZZ 24 5.75 3.99 0.72 0.72 5.23 0.72 0.61 21 0.53(60.009) 0.0058(60.0004) 13.LF 24 4.25 2.20 0.79 0.53 3.92 0.53 0.60 23 0.68(60.018) 0.0045(60.0004)
14.LT 14 5.00 2.58 0.55 0.61 5.00 0.61 0.27 14 0.61(60.015) 0.0013(60.0005)
15.WW 24 3.50 1.86 0.75 0.45 3.09 0.44 0.46 20 0.28(60.016) 0.0018(60.0002) 16.YC 24 3.75 2.43 0.65 0.58 3.58 0.58 0.39 23 0.64(60.021) 0.0027(60.0003)
N: sample size; A: mean allele number; Ne: effective number of alleles; Ho: observed heterozygosity; He: expected heterozygosity; Ar: allele richness; GD: mean Nei’s genetic diversity; Fis: inbreeding coefficient; Hd: haplotype diversity;p: nucleotide diversity.
doi:10.1371/journal.pone.0078415.t002
Table 3.Pairwise genetic distances across all populations ofS. mosellanabased on microsatellite data.
Code 1 2 3 4 5 6 7 8 9 10 11 12 13 14 15 16
1.LY 0.000 0.016 0.037 0.039 0.087 0.020 0.024 0.036 0.144 0.165 0.307 0.472 0.447 0.236 0.333 0.424
2.JN 0.012 0.000 20.025 0.019 0.031 0.000 0.040 0.024 0.111 0.107 0.239 0.359 0.339 0.186 0.280 0.359 3.FN 0.022 0.010 0.000 0.002 0.027 0.000 0.028 0.039 0.150 0.097 0.229 0.329 0.337 0.171 0.301 0.34
4.XT 0.037 0.017 0.004 0.000 0.008 0.000 0.037 0.043 0.125 0.055 0.255 0.373 0.310 0.116 0.321 0.294
5.XS 0.057* 0.023 0.018 0.011 0.000 0.000 0.083 0.043 0.044 0.041 0.201 0.364 0.188 0.070 0.218 0.208 6.TJ 0.019 0.000 20.006 0.000 0.002 0.000 0.006 0.010 0.078 0.021 0.210 0.357 0.276 0.131 0.268 0.334
7.BJ 0.027 0.021 0.022 0.018 0.039 0.013 0.000 0.028 0.095 0.105 0.278 0.431 0.325 0.163 0.246 0.318
8.NY 0.030 0.012 0.019 0.029 0.032 0.007 0.023 0.000 0.043 0.046 0.075 0.302 0.269 0.103 0.178 0.245 9.HX 0.084* 0.066* 0.061* 0.057* 0.043 0.052* 0.061* 0.031 0.000 0.032 0.106 0.234 0.114 0.061 0.113 0.141
10.LC 0.109** 0.070* 0.059* 0.051* 0.053* 0.043 0.069* 0.029 0.028 0.000 0.072 0.154 0.137 0.027 0.106 0.173
11.HuaX 0.160** 0.120** 0.107** 0.120** 0.107** 0.113** 0.139** 0.077* 0.061* 0.045 0.000 0.066 0.114 0.095 0.135 0.155 12.ZZ 0.205** 0.176** 0.146** 0.145** 0.136** 0.156** 0.174** 0.141** 0.108** 0.107** 0.048 0.000 0.256 0.225 0.296 0.311
13.LF 0.266** 0.199** 0.180** 0.183** 0.140** 0.176** 0.214** 0.168** 0.104** 0.091* 0.097* 0.143** 0.000 0.076 0.114 0.149
14.LT 0.170** 0.110** 0.103** 0.101** 0.056* 0.093** 0.116** 0.086* 0.059* 0.047 0.081* 0.129** 0.075* 0.000 0.025 0.021 15.WW 0.270** 0.213** 0.210** 0.232** 0.188** 0.211** 0.217** 0.170** 0.133** 0.140** 0.147** 0.223** 0.190** 0.064* 0.000 0.013
16.YC 0.250** 0.190** 0.177** 0.178** 0.139** 0.182** 0.193** 0.159** 0.115** 0.131** 0.124** 0.172** 0.150** 0.031 0.035 0.000
PairwiseDest(using SMOGD v1.2.5) estimates are presented above the diagonal, andFST(using Arlequin v3.5.1.2) estimates are presented below it. Significance of comparisons indicated as follows:
*P,0.05; **P,0.001.
16 S. mosellana populations (FST vs km; r= 0.56 and P,0.001) (Figure 1A) and within the western group of six populations (Figure 1B) (FST vs km;r= 0.573 andP= 0.025), suggesting that the genetic population differentiation (gene flow) of this species may follow an IBD pattern. However, there was no evidence to indicate a correlation between genetic and geographic distances within the eastern group of 10 populations (FSTvs km;r= 0.131 andP= 0.389) (Figure 1C).
Population genetic structure
To investigate the natural population structure and infer the relationships among S. mosellana populations, we used an admixture model implemented in STRUCTURE software to explore different numbers of populations K to the population structure based on microsatellite data. Considerable population structure was detected with LY+JN+FN+XS+XT+TJ+BJ
+-NY+HX+LC and HuaX+ZZ+LF+LT+WW+YC as two indepen-dent groups atK= 2, which was consistent with the hypothesis that these populations could be divided into two groups (the eastern and western groups), broadly corresponding to the two geograph-ical areas (Figure 2A). Further structuring indicated divergence of HuaX and ZZ from the other western populations atK= 3. With
K= 4, the eastern populations were apparently divided into two groups. The Bayesian clustering method detected significant genetic clusters among the western populations, with locations of
HuaX and ZZ comprising one cluster, LF and LT comprising the second cluster, and WW and YC comprising the third cluster at
K= 5. OptimalKestimated the most likely number of populations atK= 5 and most populations had a clear allocation to one of the five groups. A more fine-grained population structure was present atK= 5, and the subdivision still closely followed the geography (Figure 2B). The geographical structuring of mtDNA haplotypes among these populations was significant between the eastern and western groups.
Assuming that the genetic groups inferred from the Bayesian analysis represented two gene pools, we performed AMOVA for these populations. Similar results were also obtained when AMOVA was carried out considering the eastern and western groups based on mtDNA analysis, showing significant variation (50.14%; wCT= 0.501, P,0.001) among groups and within populations (43.73%; wST= 0.563, P,0.001), while variation among populations within groups was 6.13% (wSC= 0.123,
P,0.001) (Table S2). Overall, population differentiation using mtDNA was significant among the two groups, and was also significant when comparing the western and eastern populations (AMOVA,P,0.0001).
Individual assignment and migrant detection
Individual assignment by STRUCTURE analysis indicated that 65–100% of the individuals from 15 populations (excluding LC) were assigned with membership probabilities of$70% (Table 4). A total of 327 out of 374 (87.4%) individuals were correctly assigned to a group (K= 2), with 176 individuals assigned to the eastern group and 123 individuals retained in the western group. Twenty-eight individuals were identified as migrants and 47 individuals as of mixed ancestry. Compared to the western populations (mean 81.3%), the eastern populations (mean 74.5%) tended to have lower assignment accuracy on average. The assignment test was successful for some populations (e.g. 100% assigned for WW and YC populations). Furthermore, with membership probabilities of $70%, the LC population was a mixture of insects from two groups, and may represent an intermediate type between the eastern and western populations.
The detection of migrants using GENECLASS produced very similar results to that using STRUCTURE. Twenty-four individ-uals were identified as migrants (P,0.01), with 18 out of 134 (13.4%) from the western populations as present-generation migrants, while only six out of 216 (2.7%) from the eastern populations (excluding LC) were identified as migrants. No migrants originating from the WW and YC populations were detected in other populations.
Phylogenetic relationships among populations and haplotypes
The unrooted NJ dendrogram obtained from Nei’s genetic distance (Figure 3) showed that 16 populations ofS. mosellanawere clearly segregated into two discrete groups (the eastern and western groups), which was consistent with the results analyzed by STRUCTURE. LC was separated from other nine populations in the eastern group with 78% bootstrap support, and significant clustering was observed among the western populations.
The unrooted NJ tree of 42 haplotypes ofND4(Figure S1) and haplotype network analyses forND4andCOX3(K= 5) (Figure 4), showed that the haplotypes of the two genes were divided into two clades, while that from LC was divided into two groups. mtDNA relationships showed that haplotypes in the first clade were all from the eastern populations, while those in the second clade were divided into two branches; one branch from the eastern group and the other from the western group.
Figure 1. Relationships between pairwise FST values and geographical distances forS. mosellana populations.(A) 16 S. mosellana populations (r= 0.560, P,0.001). (B) 10 S. mosellana
Population demographic history and neutrality test Neutrality tests were applied in grouped and non-grouped S.
mosellanapopulations using mtDNAND4. Tajima’sDand Fu’sFS
tests were not significant (P.0.05) for all populations (Table S3) and the model of population expansion could be rejected, suggesting that these populations had not experienced rapid expansion. However, the model of population expansion could not be rejected using Fu’sFStests (P,0.05) for the eastern and western groups, and when all populations were combined. The mismatch distribution analysis of overall populations ofS. mosellanatended to be unimodal (Figure S2). Separate analyses of the mismatch distribution of the eastern and western groups yielded similar results. These results indicated that this species had recently undergone a rapid expansion in China.
Bottleneck analysis indicated that no population ofS. mosellana
displayed significant heterozygosity excess (P.0.05) (Table S3) using Wilcoxon’s signed rank tests with three mutation models of SMM, IAM and TPM, suggesting no genetic bottleneck in these populations caused by mutation-drift equilibrium. In addition, no shift in the frequency distribution of alleles and a normal L-shaped curve also indicated that the studied populations had not undergone bottleneck events in their recent history.
Discussion
Recent advances in statistics and population genetics make it possible to investigate how geographical (e.g. landscape, latitude, longitude and altitude) and environmental (e.g. temperature and precipitation) factors affect the genetic diversity and population structure of a species [48,49].S. mosellana is widely distributed in Northern China, which includes many different geographic and biogeographic areas and can be divided into eastern and western regions according to geographic position. The results of the
Table 4.Assignment of individuals from 16 populations ofS. mosellanato the eastern and western groups through Bayesian analysis (K= 2).
Code N East group Western group NA %A
1.LY 24 21 2 1 88
2.JN 24 17 2 5 71
3.FN 24 20 2 2 84
4.XT 24 20 3 1 84
5.XS 24 17 3 4 71
6.TJ 24 18 1 5 75
7.BJ 24 20 2 2 83
8.NY 24 15 3 6 63
9.HX 24 18 4 2 75
10.LC 24 10 7 7 42
11.HuaX 24 2 18 4 75
12.ZZ 24 2 18 4 75
13.LF 24 1 22 1 92
14.LT 14 1 10 3 71
15.WW 24 0 24 0 100
16.YC 24 0 24 0 100
Each cell contains the number of individuals from each population assigned to the group with q$0.70. NA: not assigned = number of individuals not assigned to any group; A%: percent assigned to a genetic group.
doi:10.1371/journal.pone.0078415.t004
Figure 3. Neighbor-joining tree of 16 populations ofS. mosellanabased on Nei’s genetic distances using allele frequencies of the four microsatellite loci.Bootstrap support above 50% (10,000 replicates) is indicated by gray branches.
present study indicated that S. mosellana populations across its geographic distribution could also be divided into eastern and western groups in terms of their adaptations to different geographical and ecological environments in northern China. Significant differences in geographical and environmental factors between the two regions have led to great differences in genetic diversity, genetic differentiation and population structure of S.
mosellana, which has been demonstrated at several scales.
Genetic diversity
Genetic diversity is the basis of an organism’s ability to adapt to changes in its environment, and can be affected by many factors [50]. Previous studies showed evidence of genetic variation among S.
mosellana populations [5,14]. However, they provided insufficient
information regarding the genetic diversity of this species and the relationships between geographic variables and genetic diversity. The present study revealed that the studied populations ofS. mosellana
Figure 4. Median-joining network showing phylogeographic structure for the mtDNAND4 (A) andCOX3 (B) haplotypes ofS.
mosellana.Inferred median vectors are switched off for clarity. Each circle represents a haplotype, and circle size is proportional to haplotype
frequency. Colors indicate the proportion of individuals sampled in different populations within the study area. Branch lengths are proportional to the number of S substitutions per nucleotide site. Group A: LY+JN+FN+XT+XS+TJ+BJ+NY+HX; Group B: LC; Group C: HuaX+ZZ; Group D: LF+LT; Group E: WW+YC.
(excluding WW) harbor moderate to high genetic diversity, indicating their ability to adapt to varying environmental conditions. The eastern populations exhibit a higher degree of genetic diversity than the western populations, suggesting that fragmented habitats, migration (decreased or eliminated) between populations and genetic drift have probably contributed to the loss of diversity of the populations in the western region (especially in WW and YC).S.
mosellana has recently undergone a substantial northeastern range
expansion in China, including recent establishments in Tianjing and Beijing, which may be a cause of the low levels of genetic variation among the eastern populations. Analyses of the relationships between geographic variables (longitude and altitude) and genetic diversity (allelic richness, expected heterozygosity and gene diversity) showed that the former are important factors leading to differences in genetic diversity amongS. mosellanapopulations.
Genetic differentiation and gene flow among populations
Previous studies found obvious genetic differentiation between spring wheat-region and winter wheat-region groups among S. mosellanapopulations [5,14]. The results of this study indicate thatS. mosellanapopulations exhibit significant genetic differentiation, with
FSTvalues ranging from low to high among these populations. IBD tests identified a positive correlation between genetic and geo-graphic distances in the populations, especially among the western group, suggesting that these populations are differentiated by a process of IBD, and that genetic drift is a much stronger force than gene flow. The present findings are partly consistent with those of prior studies [5,14]. However, no IBD pattern was detected among the eastern populations, which may be due to region-wide expansion and stronger gene flow among these populations.
TheFST (Dest) values also revealed significant genetic differen-tiation between the eastern and western groups (FST= 0.11), indicating that they are in two different gene pools and have evolved independently for several hundreds of thousands of years. AMOVA analysis based on mtDNA data indicated high genetic differentiation among populations, with about 50% of the genetic diversity that existed among groups.
Compared to the eastern populations, higher genetic differentiation and lower gene flow were detected among the western populations, which may be the result of broken topography with numerous mountains and small plateaus characterized by very diverse climates in this area, leading to predominantly small-scale wheat growing. The populations of YC and WW had substantially higher levels ofFST, implying that drift may play a much larger role in determining allele frequencies in these populations than in other populations.
The geographical structuring of haplotypes was significantly different between the eastern and western groups, which could be divided into two groups. The results suggest that mountains (e.g. the Taihang mountains, which were formed during the mountain-building processes of the Jurassic period and have historically formed an obstacle to movement between Shanxi and Hebei) have been a major geographic barrier limiting gene flow between the eastern and western groups in this species, with significant isolation between the populations on either side of the Taihang mountains. The geographic barrier to gene flow in S. mosellana represented by the Taihang mountains may reflect this organism’s dispersal ability and its adaptation to climatic variables. Mountains have also been shown to act as geographic barriers shaping the population structure of the other terrestrial speciesLocusta migratoria[51] andPaeonia rockii[52].
Population structure
We tested the hypothesis that the population structure of S.
mosellanaarises during range shift in Northern China. A previous
study found thatS. mosellanacould be divided into three groups: a spring wheat-region group, a winter wheat-region group and a mixed winter and spring wheat-region group [5]. Our results provide new insights into the population structure of this species and suggest that the populations can be divided into two groups: the eastern group and the western group. In this study, various analyses indicated that these populations exhibited significantly different population structures, reflecting the ancient polymorphisms of this species. The results also indicated that the range-wide phylogeographical structure of S.
mosellana was mainly characterized by geographic isolation. The
Bayesian clustering method revealed the presence of two distinct (eastern and western) lineages ofS. mosellana, corresponding largely to patterns of habitat fragmentation and geographic origin.
The weak signal for division into five groups, combined with the high frequency of accurate assignments, suggests that fragmentation of theS. mosellanapopulations is not static. Compared with the eastern populations, the western S. mosellana populations are significantly differentiated from each other and more substructured. This study indicates that the complex and diverse topographic configuration in northern China (especially in the western region) might have played an important role in shaping the genetic divergence and population structure ofS. mosellana. The mountains in particular have played a more significant role in the genetic substructuring of S. mosellana
populations than linear distance, and the current results suggest that the Taihang and Qinling mountains may be considered as isolated management units in terms of control efforts.
Detection of migrants and admixed individuals
Migration analyses detected a high number of potential migrants mainly among the western populations (excluding the populations of WW and YC), indicating asymmetric migration from the western populations to the eastern populations. However, this is apparently not sufficient to overwhelm the effect of drift in the isolated areas and to maintain genetic similarity across the western range ofS. mosellana. Notably, the present study identified the presence of admixed individuals in most of these populations, suggesting that migration ofS. mosellanaoccurred historically, and that this species is not only able to move between localities on occasion, but is also able to reproduce in the new area, thereby contributing to the genetic diversity of subpopulations.
This study indicates that the migration of S. mosellanamay be affected by topography, wind, water and human activities. Our data also showed that the Qinling mountains could be considered as an important dispersal corridor allowing genetic exchange, as well as identifying isolated areas. The relatively strong global population structure and low degree of genetic variation within populations suggest thatS. mosellanahas a low capacity for active dispersal, but can disperse passively over long distances by wind, water and human-mediated transport [53].
Conclusions
The widespread agricultural impact and rapid range expansions
of S. mosellana make it necessary to understand its population
native range means that it shows strong regional subdivision in China. More detailed inferences about its phylogenetic and phylogeographic patterns are likely to be studied in the future, and require further sampling throughout China.
Supporting Information
Figure S1 Neighbor-joining tree of haplotypes ofND4based on genetic distances. Bootstrap support above 50% (10,000 replicates) is indicated by gray branches.
(TIF)
Figure S2 Mismatch distributions of pairwise nucleo-tide differences for total populations of S. mosellana
using gene sequences ofND4(A) andCOX3(B).Solid lines
show the observed frequency distributions and dashed lines show the distribution expected under the sudden-expansion model. (TIF)
Table S1 Pairwise genetic distances across all popula-tions of S. mosellana based on mtDNA ND4 using
Arlequin v3.5.1.2.
(DOC)
Table S2 Analysis of molecular variance ofS. mosellana
based on mtDNAND4(K= 2).
(DOC)
Table S3 Analyses of natural tests of Tajima’s D and
Fu’sFs and bottlenecks in 16 populations of S. mosel-lana.
(DOC)
Acknowledgments
We thank those who contributed to sampling ofSitodiplosis mosellanafor this research, including Qing-lin Lu, Sheng-hai Xu, Zhong-long Du, Yi-qin Wei, Zhen-sheng Kang, Fei Liu, Jia-dai Su, Ding-yi Zhang, Chang-qing Mu, Dong-lin Jing, Ming-sheng Cai, Chang-ying Liu, Jie Zhang, Qian-qian Wang and Zhen-xing Yu.
Author Contributions
Conceived and designed the experiments: YQW LZL YD. Performed the experiments: YD. Analyzed the data: YD. Contributed reagents/ materials/analysis tools: YD YQW JM ZJG YLJ TL. Wrote the paper: YD YQW LZL.
References
1. Berzonsky WA, Ding HJ, Haley SD, Harris MO, Lamb RJ, et al. (2003) Breeding wheat for resistance to insects. Plant Breed Rev 22: 221–296. 2. Doane JF, Olfert O (2008) Seasonal development of wheat midge,Sitodiplosis
mosellana(Gehin) (Diptera: Cecidomyiidae), in Saskatchewan, Canada. Crop Prot 27: 951–959.
3. Yuan F (2004) The wheat blossom midges Sitodiplosis mosellana(Gehin) and Contarinia tritici(Kirby): their plague principle and control. Science Press, Beijing. 4. Hu ML, Zhang KB (1995) Studies on diapause habits ofSitodiplosis mosellana
(Gehin). Entomological Knowledge 1: 13–16.
5. He H, Yuan XQ, Wei C, Yuan F (2006) Genetic variation of the mitochondrial ND4region among geographical populations of Sitodiplosis mosellana (Gehin) (Diptera: Cecidomyiidae) in China. Journal of the Kansas Entomology Society 79: 211–221.
6. Wu YQ, Miao J, Duan Y, Jiang YL, Gong ZJ (2011) Research and control of orange wheat blossom midge, Science Press, Beijing.
7. Wu YQ, Zhao WX, Jiang YL, Duan Y (2009) Monitoring on adults ofSitodiplosis mosellana(Gehin) with yellow sticky traps. Acta Phytophyl Sin 36: 381–382. 8. Fairley TL, Renaud TM, Conn JE (2000) Effects of local geographic barriers
and latitude on population structure inAnopheles punctipennis(Diptera: Culicidae). J Med Entomol 5: 754–60.
9. Prugh LR, Hodges KE, Sinclair ARE, Brashares JS (2008) Effect of habitat area and isolation on fragmented animal populations. Proc Natl Acad Sci U S A 52: 20770–20775.
10. Pauls SU, Nowak C, Ba´lint M, Pfenninger M (2013) The impact of global climate change on genetic diversity within populations and species. Mol Ecol 22(4): 925–946.
11. Nater A, Arora N, Greminger MP, van Schaik CP, Singleton I (2013) Marked population structure and recent migration in the critically endangered sumatran orangutan (Pongo abelii). J Hered 1: 2–13.
12. He CG, Yuan F (2001a) Esterase variation and genetic structure in three geographic populations ofSitodiplosis mosellana(Ge´hin) (Diptera: Cecidomyiidae) in western China. Entomologia Sinica 1: 73–80.
13. He CG, Yuan F (2001b) RAPD analysis of population genetic structure of Sitodiplosis mosellana (Ge´hin) (Diptera: Cecidomyiidae) in western China. Entomotaxonomia 2: 124–129.
14. He CG, Yuan F (2003) Analysis on geographic population ofSitodiplosis mosellana (Ge´hin) (Diptera: Cecidomyiidae) by RAPD and its gene flow. Acta Entomologica Sinica 2: 124–129.
15. He H, Yuan F (2004) Genetic variation on geographical population in western China. Entomotaxonomia 2: 124–129. (In English, with Chinese summary) 16. Zeinab A, Patrick D, Francisco JA, Ce´line A, Parfait AA, et al. (2007) Population
genetic structure ofPlasmodium falciparum in the two main African vectors, Anopheles gambiaeandAnopheles funestus. Proc Natl Acad Sci U S A 19: 7987–7992. 17. Dyer NA, Lawton SP, Ravel S, Choi KS, Lehane MJ, et al. (2008) Molecular phylogenetics of tsetse flies (Diptera:Glossinidae) based on mitochondrial (CO1, 16S,ND2) and nuclear ribosomal DNA sequences, with an emphasis on the palpalisgroup. Mol Phylogenet Evol 49: 227–239.
18. Wellenreuther M, Sa´nchez-Guille´n RA, Cordero-Rivera A, Svensson EI, Hansson B (2011) Environmental and climatic determinants of molecular diversity and genetic population structure in a coenagrionid damselfly. PLoS One 5: e20440.
19. Ambrose L, Riginos C, Cooper RD, Leow KS, Ong W, et al. (2012) Population structure, mitochondrial polyphyly and the repeated loss of human biting ability in anopheline mosquitoes from the southwest Pacific. Mol Ecol 17: 4327–4343. 20. Collins FH, Mendez MA, Rasmussen MO, Mehaffey PC, Besansky NL, et al. (1987) A ribosomal RNA gene probe differentiates member species of theAn. Gambiae complex. Am J Trop Med Hyg 37: 37–41.
21. Duan Y, Wu RH, Luo LZ, Wu YQ, Jiang YL, et al. (2011) Characterization of SSRs from the ESTs in the wheat midge,Sitodiplosis mosellana(Gehin) (Diptera: Cecidomyiidae). Acta Entomologica Sinica 10: 1147–1154.
22. Van Oosterhout C, Hutchinson WF, Wills DP, Shipley P (2004) MICRO-CHECKER : Software for identifying and correcting genotyping errors in microsatellite data. Mol Ecol 4: 535–538.
23. Rousset F (2008) Genepop’007: a complete reimplementation of the Genepop software for Windows and Linux. Mol Ecol Resour 8: 103–106.
24. Yeh F C, Yang RC, Boyle T (1999) POPGENE, Version 1.31 edition. University of Alberta, Edmonton, AB, Canada.
25. Goudet J (2002) FSTAT, a program to estimate and test gene diversities and fixation indices (version 2.9.3.2). Available: http://www2.unil.ch/popgen/ softwares/fst at.htm. Accessed 2012 Sep 9.
26. Larkin MA, Blackshields G, Brown NP, Chenna R, McGettigan PA, et al. (2007) Clustal W and Clustal X version 2.0, Bioinformatics 23: 2947–2948. 27. Kumar S, Nei M, Dudley J, Tamura K (2008) MEGA: a biologist-centric
software for evolutionary analysis of DNA and protein sequences. Brief Bioinform 9: 299–306.
28. Rozas J, Sanchez-DelBarrio JC, Messeguer X, Rozas R (2003) DnaSP, DNA polymorphism analyses by the coalescent and other methods. Bioinformatics 19: 2496–2497.
29. Nei M (1987) Molecular Evolutionary Genetics. New York: Columbia University Press.
30. Excoffier L, Lischer HEL (2010) Arlequin suite ver 3.5: a new series of programs to perform population genetics analyses under Linux and Windows. Mol Ecol Resour 3: 564–567.
31. Jost L (2008) GST and its relatives do not measure differentiation. Mol Ecol 17: 4015–4026.
32. Crawford NG (2010) SMOGD: Software for the measurement of genetic diversity. Mol Ecol Resour 10: 556–557.
33. Mantel N (1967) The detection of disease clustering and a generalized regression approach. Cancer Res 27: 209–220.
34. Evanno G, Regnaut S, Goudet J (2005) Detecting the number of clusters of individuals using the software STRUCTURE: a simulation study. Mol Ecol 8: 2611–2620.
35. Excoffier L, Smouse PE, Quattro JM (1992) Analysis of molecular variance inferred from metric distances among DNA haplotypes: application to human mitochondrial DNA restriction data. Genetics 131: 479–491.
36. Piry S, Alapetite A, Cornuet J, Baudoin L, Estoup A (2004) GeneClass2: A software for genetic assignment and first generation migrants detection. J Hered 6: 536–539.
37. Rannala B, Mountain JL (1997) Detecting immigration by using multilocus genotypes. Proc Natl Acad Sci U S A 94: 9197–9201.
39. Takezaki N, Nei M, Tamura K (2010) POPTREE2: Software for constructing population trees from Allele frequency data and computing other population statistics with windows interface. Mol Biol Evol 4: 747–752.
40. Nei M (1978) Estimation of average heterozygosity and genetic distance from a small number of individuals. Genetics 89: 583–590.
41. Bandelt H, Forster P, Rohl A (1999) Median-joining networks for inferring intraspecific phylogenies. Mol Biol Evol 16: 37–48
42. Tajima F (1989) Statistical method for testing the neutral mutation hypothesis by DNA polymorphism, Genetics 123: 585–595.
43. Fu XY (1997) Statistical tests of neutrality of mutations against population growth, hitchhiking and background selection. Genetics 147: 915–925. 44. Rogers AR, Harpending H (1992) Population growth makes waves in the
distribution of pairwise genetic differences. Mol Biol Evol 9: 552–569. 45. Cornuet JM, Luikart G (1996) Description and power analysis of two tests for
detecting recent population bottlenecks from allele frequency data. Genetics 144: 2001–2014.
46. Luikart G, Allendorf FW, Cornuet JM, Sherwin WB (1998) Distortion of allele frequency distributions provides a test for recent population bottlenecks, J Hered 89: 238–247.
47. Piry S, Luikart G, Cornuet JM (1999) BOTTLENECK: a computer program for detecting recent reductions in the effective population size using allele frequency data. J Hered 90: 502–503.
48. Pauls SU, Nowak C, Balint M, Pfenninger M (2013) The impact of global climate change on genetic diversity within populations and species. Mol Ecol 22: 925–946.
49. Wellenreuther M, Sa´nchez-Guille´n RA, Cordero-Rivera A, Svensson EI, et al. (2011) Environmental and climatic determinants of molecular diversity and genetic population structure in a Coenagrionid damselfly. PLoS ONE 6: e20440. 50. Amos W, Harwood J (1998) Factors affecting levels of genetic diversity in natural
populations. Philos T Roy Soc B 1366: 177–186.
51. Chapuis MP, Lecoq M, Michalakis Y, Loiseau A, Sword GA, et al. (2008) Do outbreaks affect genetic population structure? A worldwide survey inLocusta migratoria, a pest plagued by microsatellite null alleles. Mol Ecol 16: 3640–53. 52. Yuan JH, Cheng FY, Zhou SL (2012) Genetic structure of the tree peony (Paeonia
rockii) and the Qinling Mountains as a geographic barrier driving the fragmentation of a large population. PLoS One 4: e34955.