ACPD
9, 5785–5808, 2009Data assimilation of CALIPSO aerosol
observations
T. T. Sekiyama et al.
Title Page
Abstract Introduction
Conclusions References
Tables Figures
◭ ◮
◭ ◮
Back Close
Full Screen / Esc
Printer-friendly Version
Interactive Discussion Atmos. Chem. Phys. Discuss., 9, 5785–5808, 2009
www.atmos-chem-phys-discuss.net/9/5785/2009/ © Author(s) 2009. This work is distributed under the Creative Commons Attribution 3.0 License.
Atmospheric Chemistry and Physics Discussions
This discussion paper is/has been under review for the journalAtmospheric Chemistry and Physics (ACP). Please refer to the corresponding final paper inACPif available.
Data assimilation of CALIPSO aerosol
observations
T. T. Sekiyama1, T. Y. Tanaka1, A. Shimizu2, and T. Miyoshi3,* 1
Meteorological Research Institute, Tsukuba, Japan
2
National Institute for Environmental Studies, Tsukuba, Japan
3
Japan Meteorological Agency, Tokyo, Japan
*
now at: University of Maryland, USA
Received: 17 December 2008 – Accepted: 19 February 2009 – Published: 4 March 2009
Correspondence to: T. T. Sekiyama ([email protected])
ACPD
9, 5785–5808, 2009Data assimilation of CALIPSO aerosol
observations
T. T. Sekiyama et al.
Title Page
Abstract Introduction
Conclusions References
Tables Figures
◭ ◮
◭ ◮
Back Close
Full Screen / Esc
Printer-friendly Version
Interactive Discussion
Abstract
We have developed an advanced data assimilation system for a global aerosol model with a four-dimensional ensemble Kalman filter in which the Level 1B data from the Cloud-Aerosol Lidar and Infrared Pathfinder Satellite Observations (CALIPSO) were successfully assimilated for the first time, to the best of the authors’ knowledge. A
one-5
month data assimilation cycle experiment for dust, sulfate, and sea-salt aerosols was performed in May 2007. The results were validated via two independent observations: 1) the ground-based lidar network in East Asia, managed by the National Institute for Environmental Studies of Japan, and 2) weather reports of aeolian dust events in Japan. Detailed four-dimensional structures of aerosol outflows from source regions
10
over oceans and continents for various particle types and sizes were well reproduced. The intensity of dust emission at each grid point was also globally corrected. These results are valuable for the comprehensive analysis of aerosol behavior as well as aerosol forecasting.
1 Introduction
15
Natural and anthropogenic aerosols have a considerable impact on air quality and cli-mate. Large uncertainty, however, still exists in our estimates of aerosol emission and distribution. To improve our understanding of aerosol behavior, further observations and better numerical simulations are essential. Moreover, data assimilation must make optimal use of both observations and numerical simulations to obtain the best
pos-20
sible estimate of aerosol behavior. Data assimilation has played an essential role in numerical weather predictions (NWP), generating accurate initial conditions for better forecasts. Compared with the long history and solid examination of data assimilation in operational NWP, data assimilation methods have only recently been applied to aerosol studies. The European Centre for Medium-Range Weather Forecasts (ECMWF) has
25
ACPD
9, 5785–5808, 2009Data assimilation of CALIPSO aerosol
observations
T. T. Sekiyama et al.
Title Page
Abstract Introduction
Conclusions References
Tables Figures
◭ ◮
◭ ◮
Back Close
Full Screen / Esc
Printer-friendly Version
Interactive Discussion data (GEMS) project, in which a four-dimensional variational (4D-Var) data assimilation
system is adapted to monitor and forecast sea-salt, dust, organic, and black-carbon aerosols (Hollingsworth et al., 2008). The observations used in the GEMS project are retrieved aerosol optical depth data from the Moderate Resolution Imaging Spectro-radiometer (MODIS) onboard the Terra and Aqua satellites. Zhang et al. (2008)
re-5
ported their 3D-Var data assimilation system for aerosol, using MODIS optical depth observations, to improve Naval Research Laboratory (NRL) aerosol analysis and pre-diction. A major limitation of the previous studies is that, because the MODIS aerosol optical depth is a column-integrated amount, the observational information does not include aerosol vertical profiles. In addition, MODIS observations cannot discriminate
10
the type, size, and shape of the aerosols.
Dust aerosol in East Asia, where severe dust storms are frequent, was explored early using data assimilation methods. Yumimoto et al. (2007, 2008) developed a 4D-Var data assimilation system for Asian dust (yellow sand, or Kosa) with a regional chemistry-transport model and extinction coefficient data retrieved from ground-based
15
lidar observations of several observatories in Japan. Niu et al. (2008) reported their dust storm forecast over China using a 3D-Var data assimilation system. They com-piled two sets of observations for the data assimilation; one is a satellite-retrieved in-dex of column amounts of dust aerosol; the other is the surface visibility observed by the meteorological stations of the Chinese Meteorological Administration (CMA). Lin
20
et al. (2008a, b) developed an Ensemble Kalman Filter (EnKF) data assimilation sys-tem for Asian dust storms and have demonstrated the usefulness of EnKF in aerosol studies. These pioneering works (Yumimoto et al., 2007, 2008; Niu et al., 2008; Lin et al., 2008a, b), however, cover only the East Asian region and are not applicable to aerosols other than dust. Furthermore, the available observational data are very
25
sparse and probably contain retrieval errors.
Polariza-ACPD
9, 5785–5808, 2009Data assimilation of CALIPSO aerosol
observations
T. T. Sekiyama et al.
Title Page
Abstract Introduction
Conclusions References
Tables Figures
◭ ◮
◭ ◮
Back Close
Full Screen / Esc
Printer-friendly Version
Interactive Discussion tion (CALIOP) carried by CALIPSO provides continuous global measurements using
a two-wavelength and polarization-sensitive backscattering lidar with very high verti-cal and horizontal resolution. The CALIPSO polar orbit passes through a longitudinal interval of approximately 1000 km per day at mid-latitudes. These measurements are sufficient to discriminate the type, size, and shape of the aerosols. The CALIPSO
in-5
formation released to the public as Level 1B data (http://www-calipso.larc.nasa.gov/) contains the total attenuated backscattering coefficients at 532/1064 nm and the vol-ume depolarization ratio at 532 nm, and these values are not contaminated by re-trieval errors due to low-accuracy rere-trieval algorithms. On the basis of the availability of CALIPSO data, we developed an advanced data assimilation system for aerosol,
10
which consists of a global chemistry-transport model (cf. Tanaka et al., 2003), a four-dimensionally expanded EnKF (cf. Miyoshi and Yamane, 2007, and references therein), and an observational operator for the CALIPSO Level 1B data.
In contrast with other data assimilation schemes, the EnKF explicitly and contin-uously provides a flow- and time-dependent approximation of the background error
15
statistics to integrate the observations into model simulations. Other schemes, such as optimal interpolation and 3D-Var, assume that the background error statistics are spatially homogeneous, horizontally isotropic, and temporally stationary. This assump-tion conflicts with the actual errors that are significantly flow- and time-dependent. Al-though the 4D-Var implicitly evolves the background error statistics, the evolution is
20
effective only during each assimilation time window. Additionally, the 4D-Var involves the complexity of constructing the adjoint matrix, and assumes model linearity dur-ing its iteration process, which is unnecessary for the EnKF. The EnKF requires only forward model integrations. These are clear advantages of EnKF when it is applied to atmospheric chemistry analyses, such as aerosol studies. Furthermore, the
four-25
dimensionally expanded EnKF used in this study works as a pseudo Ensemble Kalman Smoother (EnKS), which will provide more reliable reanalyses and emission estimates of aerosol via application of both past and future observations.
ex-ACPD
9, 5785–5808, 2009Data assimilation of CALIPSO aerosol
observations
T. T. Sekiyama et al.
Title Page
Abstract Introduction
Conclusions References
Tables Figures
◭ ◮
◭ ◮
Back Close
Full Screen / Esc
Printer-friendly Version
Interactive Discussion periments for dust, sulfate, and sea-salt aerosols. To the authors’ knowledge, this is the
first attempt to perform state-of-the-science data assimilation with CALIPSO aerosol observations. The assimilation results were validated by two independent observa-tions: data obtained from the ground-based lidar network (Shimizu et al., 2004) in East Asia, which is managed by the National Institute for Environmental Studies of Japan
5
(NIES), and weather reports regarding aeolian dust events. The next section details our data assimilation system and experiments. The results of the data assimilation are discussed in Sect. 3, taking May 2007 as an example. The summary and future perspectives are presented in Sect. 4.
2 Description of the data assimilation system
10
2.1 Observational data
CALIPSO was launched on 28 April 2006 as part of the NASA A-train (cf. Winker et al., 2007). All satellites of the A-train are in a 705-km sun-synchronous polar orbit be-tween 82◦N and 82◦S with a 16-day repeat cycle, which is an approximately 1000-km
longitudinal interval per day at mid-latitudes. The primary instrument CALIOP carried
15
by CALIPSO was the first satellite lidar to be optimized for aerosol and cloud measure-ments. During both day and night, the CALIOP continuously provides vertical profiles of the total attenuated backscattering coefficientβ′λ(ζ) at 532 and 1064 nm and the vol-ume depolarization ratio (δ=β′λ(ζ)perpendicular/β′λ(ζ)parallel) at 532 nm, with a horizontal resolution of 1/3–1 km and a vertical resolution of 30–60 m in the troposphere. The
20
attenuated backscattering coefficientβ′λ(ζ) at wavelengthλis expressed as follows:
β′λ(ζ)=ζ2Pλ(ζ)/Cλ =(βλ,m(ζ)+βλ,p(ζ))Tλ,m2 (ζ)Tλ,p2 (ζ)
wherePλ(ζ) is the raw signal intensity from altitude ζ, and Cλ is the instrument
con-stant. Backscattering coefficients are represented byβ(ζ), and the two-way transmit-tance due to scattering (or absorbing) species is given byT2(ζ); the subscriptsmand
ACPD
9, 5785–5808, 2009Data assimilation of CALIPSO aerosol
observations
T. T. Sekiyama et al.
Title Page
Abstract Introduction
Conclusions References
Tables Figures
◭ ◮
◭ ◮
Back Close
Full Screen / Esc
Printer-friendly Version
Interactive Discussion p specify the molecular and particulate (either aerosol or cloud), respectively,
contri-butions to the signal. In the present study, we assimilated the value β′λ(ζ) and its
depolarization ratioδ(ζ) to a global chemistry-transport model. This direct assimila-tion prevents unnecessary and unnatural errors due to data retrieval processes. In contrast, extinction coefficients and optical thickness, which have been generally used
5
for aerosol assimilation studies, require erroneous assumptions or prior estimations to be retrieved from “raw” measurement data, and thus these secondary quantities are contaminated by retrieval errors.
The values of β′λ(ζ) and δ(ζ) are contained in CALIPSO Level 1B data with their
time-references and geo-locations. In this study, we used version 2.01 of CALIPSO
10
Level 1B data and assumed the measurement uncertainties to be 20%, in reference to Winker et al. (2007). The data products generated from the CALIPSO/CALIOP mea-surements are not only Level 1B data but also Level 2 data, which include geophysical variables derived from Level 1B data by the CALIPSO science team. Version 2.01 of the Level 2 data (http://www-calipso.larc.nasa.gov/) includes Cloud-Aerosol
Discrimi-15
nation (CAD) scores (Liu et al., 2004) with 5-km horizontal resolution. The CAD score is an indicator that enables discrimination of target contents between aerosols and clouds as an integer value ranging from−100 (most likely to be aerosols) to+100 (most likely to be clouds). To identify the aerosol signals and screen out cloud signals, we used CAD scores withβ′λ(ζ) andδ(ζ) measurements. These measurements were selected
20
only when the CAD score was less than or equal to−33, and then the selected mea-surements were horizontally and vertically averaged to model resolution prior to data assimilation. This data selection markedly decreased the number of measurements used for data assimilation. After selection and averaging the total number ofβ′λ=532, β′λ=1064, and δλ=532 measurements to be assimilated was 15 000–25 000 points per
25
ACPD
9, 5785–5808, 2009Data assimilation of CALIPSO aerosol
observations
T. T. Sekiyama et al.
Title Page
Abstract Introduction
Conclusions References
Tables Figures
◭ ◮
◭ ◮
Back Close
Full Screen / Esc
Printer-friendly Version
Interactive Discussion 2.2 EnKF method
The basic idea of the EnKF is that the Monte Carlo ensemble of state vectors repre-sents the probability distribution function of the system’s state. The EnKF is theoret-ically equivalent to the 4D-Var under the following three conditions: 1) the simulation model is linear, 2) the 4D-Var employs an infinite assimilation time-window, and 3) the
5
EnKF employs an infinite ensemble size (e.g., Bouttier and Courtier, 1999). As in the 4D-Var or 3D-Var, the EnKF can treat nonlinear observational operators, which enables direct assimilation of measured physical quantities (e.g., satellite-measured radiances) that are generally nonlinear with respect to the model variables (e.g., aerosol concen-trations or extinction coefficients).
10
Research examining the EnKF technique was initiated by Evensen (1994), and the first application to an atmospheric system was conducted by Houtekamer and Mitchell (1998). Their method is classified as a perturbed-observation EnKF, and the perturbed observations are a source of sampling errors. Whitaker and Hamill (2002) then proposed a Square Root Filtering (SRF) method of EnKF to avoid perturbing the
15
observations. Tippett et al. (2003) summarized several methods of ensemble SRF (EnSRF), all of which are efficient only when the observations are serially assimilated. Alternatively, Ott et al. (2002, 2004) proposed a Local Ensemble Kalman Filter (LEKF), a kind of EnSRF, which simultaneously assimilates the observations within a spatially local volume. Since analysis at each grid point is conducted independently of that of the
20
other grid points, the LEKF promotes computational efficiency with parallel implemen-tation. Furthermore, Hunt et al. (2007) applied the Ensemble Transform Kalman Filter (ETKF, developed by Bishop et al., 2001) approach to LEKF; this method is known as a Local Ensemble Transform Kalman Filter (LETKF; cf. Harlim, 2006). The computational cost of LETKF is much lower than that of the original LEKF because the former does
25
ACPD
9, 5785–5808, 2009Data assimilation of CALIPSO aerosol
observations
T. T. Sekiyama et al.
Title Page
Abstract Introduction
Conclusions References
Tables Figures
◭ ◮
◭ ◮
Back Close
Full Screen / Esc
Printer-friendly Version
Interactive Discussion use future observations as with an Ensemble Kalman Smoother (EnKS) or 4D-Var.
As these EnKF techniques improved and became a viable choice in the field of oper-ational NWP, the Japan Meteorological Agency (JMA) developed a four-dimensionally expanded LETKF (4D-LETKF) and applied it experimentally to NWP models (Miyoshi and Aranami, 2006; Miyoshi and Sato, 2007; Miyoshi and Yamane, 2007; Miyoshi et
5
al., 2007a, b). In principle, EnKF core modules are applicable to any numerical mod-els, including not only NWP models but also aerosol models. In this study, we applied the 4D-LETKF of JMA to an aerosol chemistry-transport model, the Model of Aerosol Species in the Global Atmosphere (MASINGAR), which was developed by the Meteoro-logical Research Institute (MRI) of Japan (cf. Tanaka et al., 2003). In order to assimilate
10
attenuated backscattering and its depolarization measured by CALIPSO/CALIOP, we used an observational operator that emulates atmospheric optics induced by molecules (Rayleigh scattering), particles such as sulfate and sea-salt aerosols (Mie scattering), and dust particles. The dust extinction coefficient is empirically approximated from the Mie scattering theory, and the dust backscattering coefficient is estimated with the
ex-15
tinction coefficient divided by an empirical value of 50 sr. In this observational operator, it is assumed that depolarization of the 532-nm backscattering is induced only by dust aerosol, and that the depolarization ratioδis equal to 0.35 (Shimizu et al., 2004).
2.3 Experimental design
The global chemistry-transport model MASINGAR has been successfully used for
20
aerosol studies (Tanaka et al., 2005, 2007; Tanaka and Chiba, 2005, 2006; Uno et al., 2006). MASINGAR includes the emission, advection, diffusion, gravitational settling, wet/dry deposition, and chemical processes of SO2, dimethyl sulfide (DMS), sulfate aerosol, sea-salt aerosol (partitioned into 10 size bins), and dust aerosol (partitioned into 10 size bins) in this study. The meteorological field in MASINGAR is nudged to
25
ACPD
9, 5785–5808, 2009Data assimilation of CALIPSO aerosol
observations
T. T. Sekiyama et al.
Title Page
Abstract Introduction
Conclusions References
Tables Figures
◭ ◮
◭ ◮
Back Close
Full Screen / Esc
Printer-friendly Version
Interactive Discussion sigma-pressure coordinate from the earth’s surface to the stratopause (approximately
7 layers below 800 hPa and 15 layers above 150 hPa). We incorporated MASINGAR with the 4D-LETKF data assimilation system having approximately 2.8◦
×2.8◦horizontal resolution (T42 spectrum truncation). Details of this model are described by Tanaka et al. (2003).
5
We applied this 4D-LETKF data assimilation system to the global aerosol analysis of May 2007. Data assimilation was initiated at 00:00 UTC on 1 May and terminated at 00:00 UTC on 1 June. A total of 918 CALIPSO orbit paths from pole to pole were ob-tained and used for this one-month analysis period; each path contains approximately 50 min long data. The initial conditions at 00:00 UTC on 1 May were prepared by a
10
2-year simulation that was carried out by MASINGAR without any aerosol assimilation as a spin-up. The time window of the 4D-LETKF is 48 h long, and consists of 49 slots with a 1-h interval. The analysis target time is chosen to be at the center of the 48-h window. Namely, an analysis is performed within the past 24-h and future 24-h mea-surements. The ensemble size was set to 20 members. The multiplicative spread
15
inflation parameter was fixed at 10%. The assimilated model variables/parameters in this system represent the concentrations of aerosols (sulfate aerosol, 10-partitioned sea-salt aerosol, and 10-partitioned dust aerosol) and dust emission factors. These variables and parameters are updated by the 4D-LETKF at each step of the analy-sis. The dust emission fluxΦi ,j,n of the n-th size bin at location (i , j) is corrected by
20
Φi ,j,n=αi ,j,n×Fi ,j,n, whereFi ,j,nis the original dust emission flux of MASINGAR at each time step without assimilation, andαi ,j,n is the dust emission factor given by the 4D-LETKF. The dust emission factorαi ,j,n is estimated at each land location and for each
size bin.
A model run was performed as a “reference” and included the same conditions and
25
ACPD
9, 5785–5808, 2009Data assimilation of CALIPSO aerosol
observations
T. T. Sekiyama et al.
Title Page
Abstract Introduction
Conclusions References
Tables Figures
◭ ◮
◭ ◮
Back Close
Full Screen / Esc
Printer-friendly Version
Interactive Discussion operating or co-operating this lidar observation network at more than 15 stations in
Japan, South Korea, China, and Mongolia. It provides high-resolution vertical and tem-poral information for both spherical (sea-salt, sulfate, or pollutant) and non-spherical (dust) aerosols. One of the lidar stations, in Western Japan near the Korean Penin-sula, is used for this comparison because dust storms transported from the Gobi or
5
Taklimakan Desert were clearly detected at this station in May 2007.
3 Assimilation results and discussion
3.1 Comparison with CALIPSO data
A sample comparison of model results obtained with CALIPSO/CALIOP attenuated backscattering measurements is shown in Fig. 1 as an overview of the correction
per-10
formance of the 4D-LETKF data assimilation system. It is noted that the intensity of attenuated backscattering at each grid point depends not only on the aerosol concen-tration at the grid point but also on the aerosol and molecule concenconcen-trations in the light path between the grid point and the lidar instrument. Therefore, the intensity distribu-tion of attenuated backscattering does not directly reflect the distribudistribu-tion of aerosols.
15
Additionally, aerosols cannot be observed in or across clouds by the lidar. Figure 1a, for example, indicates that much of the area scanned by CALIPSO/CALIOP is masked or whitewashed by thick clouds (red or dark red area). This figure shows the total attenu-ated backscattering coefficients at 532 nm, cross-sectioned by a portion of CALIPSO’s orbit path on 27 May 2007 (around 05:00 UTC or 14:00 LT in the daytime), which
ex-20
tends from 20◦N to 60◦N over East Asia (Japan, Korea, and Manchuria). The white
contours indicate regions with Cloud-Aerosol Discrimination (CAD) scores of less than or equal to−33, signifying a high probability of aerosol existence. This plot provides a good example for comparison of measurements with the model results because heavy dust storms continuously occurred in the Gobi Desert and Mongolia during late May
25
ACPD
9, 5785–5808, 2009Data assimilation of CALIPSO aerosol
observations
T. T. Sekiyama et al.
Title Page
Abstract Introduction
Conclusions References
Tables Figures
◭ ◮
◭ ◮
Back Close
Full Screen / Esc
Printer-friendly Version
Interactive Discussion is slightly noisy because of the daylight and clouds, it is clear that some particles are
detected in the low-CAD score regions near 40◦N at an altitude of 2–5 km. According
to Hara et al. (2008), these signals represent dust aerosol that was emitted in the Gobi Desert several days earlier and then transported eastward by a low-pressure system.
In comparison with this measurement, the dust signals near 40◦N at an altitude
5
of 2–5 km are not reproduced in the “reference” model run without data assimilation (Fig. 1b). In contrast, the 4D-LETKF assimilation reproduces dust signals as part of the uplifting structure from the planetary boundary layer (PBL) near 30–40◦N to the
free troposphere at higher latitudes (Fig. 1c). The total attenuated backscattering co-efficients shown in Fig. 1b and c are calculated only from model variables, such as
10
aerosol concentrations, humidity, temperature, and pressure, using the same scheme as that employed in the observational operator mentioned above, excluding clouds. By comparison of Fig. 1b and c, it is clear that the correction process utilized by 4D-LETKF works well in low-CAD score regions near 40◦N at an altitude of 2–5 km. In other
ar-eas, however, it is difficult to evaluate the data assimilation performance because thick
15
clouds prevent the detection of aerosols, as shown in Fig. 1a. For example, the aerosol layer in the PBL near 25–40◦N reproduced by the 4D-LETKF, shown in Fig. 1c,
can-not be ascertained because of thick clouds above the aerosol layer in Fig. 1a. In this case, part of the aerosol layer in the PBL might be obscured by another dust layer near 35–40◦N at an altitude of 2–5 km.
20
In this study, the attenuated backscattering coefficients of CALIPSO/CALIOP were used for the 4D-LETKF data assimilation only when the CAD score indicated the pres-ence of aerosol (e.g., white-contoured regions in Fig. 1a). On the other hand, continu-ous operation of the 4D-LETKF allows accumulation of information obtained during the past analysis in every assimilation step, and the four-dimensional assimilation
simulta-25
ACPD
9, 5785–5808, 2009Data assimilation of CALIPSO aerosol
observations
T. T. Sekiyama et al.
Title Page
Abstract Introduction
Conclusions References
Tables Figures
◭ ◮
◭ ◮
Back Close
Full Screen / Esc
Printer-friendly Version
Interactive Discussion future measurements. It is no surprise that Fig. 1b of the “reference” model result is
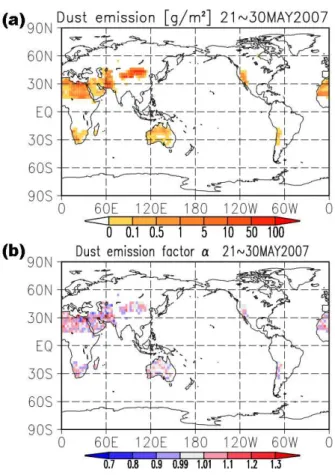
very different from Fig. 1c of the 4D-LETKF assimilation result, even outside the white-contoured (probably aerosol) regions. Furthermore, this correction can be traced back to the most upstream factors, i.e., the intensity of dust emission, even though there is no observation just above the dust-emitting areas. Figure 2b shows the dust emission
5
factorα for each grid point estimated by the 4D-LETKF assimilation, with the original dust emission intensity of the “reference” model run shown in Fig. 2a. The dust emis-sion quantity and dust emisemis-sion factors were accumulated and averaged, respectively, from 21 to 30 May 2007 across all 10 size bins. Parameterα can be statistically used for correction of model biases (e.g., Lin et al., 2008b).
10
3.2 Comparison with independent observations
In the previous section, we compared the 4D-LETKF assimilation results with the CALIPSO/CALIOP measurements. These measurements were used directly in the assimilation process, and thus it is naturally expected that the assimilation results will agree well with measurements performed at the moment of analysis. Furthermore, it
15
is uncertain whether the aerosol type and size are properly discriminated by the 4D-LETKF from the viewpoint of an attenuated backscattering coefficient only. Thus, other observational indices of aerosol, which are independent of the assimilation process, are presented here to compare with the model results.
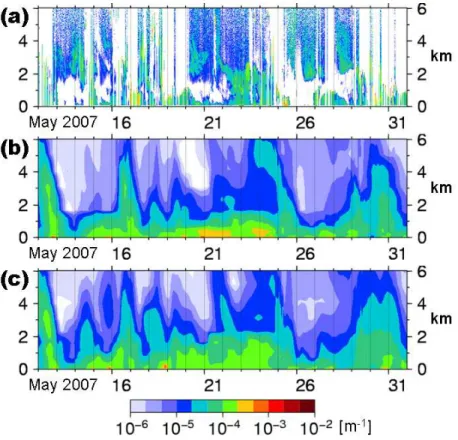
First, the time-altitude cross-section of the extinction coefficients at 532 nm, which
20
were observed by a ground-based lidar from 12 to 31 May 2007, is shown in Fig. 3a (for dust aerosol) and Fig. 4a (for spherical particles). This lidar observatory is lo-cated at Matsue (133◦E, 35◦N) in Western Japan near the Korean Peninsula and is
continuously operated by the NIES (cf. http://www-lidar.nies.go.jp/). The extinction co-efficients were retrieved from the “raw” measurement data (cf. Shimizu et al., 2004),
25
ACPD
9, 5785–5808, 2009Data assimilation of CALIPSO aerosol
observations
T. T. Sekiyama et al.
Title Page
Abstract Introduction
Conclusions References
Tables Figures
◭ ◮
◭ ◮
Back Close
Full Screen / Esc
Printer-friendly Version
Interactive Discussion aeolian dust events (yellow sand, or Kosa) were observed at/near Matsue on 14, 26,
and 27 May 2007. It is clear that these dust events were detected by the NIES lidar, as shown in Fig. 3a. Based on this plot, it can be seen that the dust extinction coefficients derived from the “reference” model result without data assimilation (Fig. 3b) partly dis-agree with that of the real case. For example, the dust extinction coefficients from 13 to
5
18 May are much larger in the PBL and smaller in the free troposphere than the NIES lidar measurements; although the large dust event on 26 and 27 May is reproduced in the PBL, it does not end on 28 May but continues until 30 May, as shown in Fig. 3b.
In contrast to the “reference” model result, the 4D-LETKF assimilation result (Fig. 3c) demonstrates much closer agreement with real events. For example, the dust extinction
10
coefficients in the PBL from 13 to 18 May are closer to the NIES lidar measurements; the peak of the dust event in the PBL on 14 May is reproduced; the dust clouds rising to 4 km a.s.l. on 14 and 18 May are clearly reproduced; the dust cloud on 26 May rises higher to 4 km a.s.l.; the dust event on 26 May ends on 27 May; the dust cloud in the free troposphere above 4 km from 26 to 28 May is much thinner than the “reference”
15
model result. It is not obvious that the 4D-LETKF assimilation result agrees with the NIES lidar measurements because the NIES lidar network data were not used for the assimilation process and the CALIPSO orbit rarely passes through or near the NIES lidar observatory. This result shows, however, that the 4D-LETKF assimilation clearly improves the spatial distribution of dust aerosol, even in areas lacking observation.
20
On the other hand, there is some disagreement between the lidar measurement (Fig. 3a) and the assimilation result (Fig. 3c): a thin dust cloud in/above the PBL from 21 to 24 May, evident in Fig. 3a, is not reproduced in Fig. 3c. By comparison with Fig. 4a, one can immediately observe a spherical-particle cloud at the same location and in the same shape as the dust cloud in Fig. 3a; the spherical-particle cloud is
25
mea-ACPD
9, 5785–5808, 2009Data assimilation of CALIPSO aerosol
observations
T. T. Sekiyama et al.
Title Page
Abstract Introduction
Conclusions References
Tables Figures
◭ ◮
◭ ◮
Back Close
Full Screen / Esc
Printer-friendly Version
Interactive Discussion sured by the lidar, 2) the assumption that all non-spherical particles are dust aerosol,
3) the lack of elemental carbon aerosol in the model, 4) subgrid scale events, or 5) the failure of 4D-LETKF to discriminate the type of aerosol during the data assimilation process. Further investigation is needed to ascertain this discrepancy.
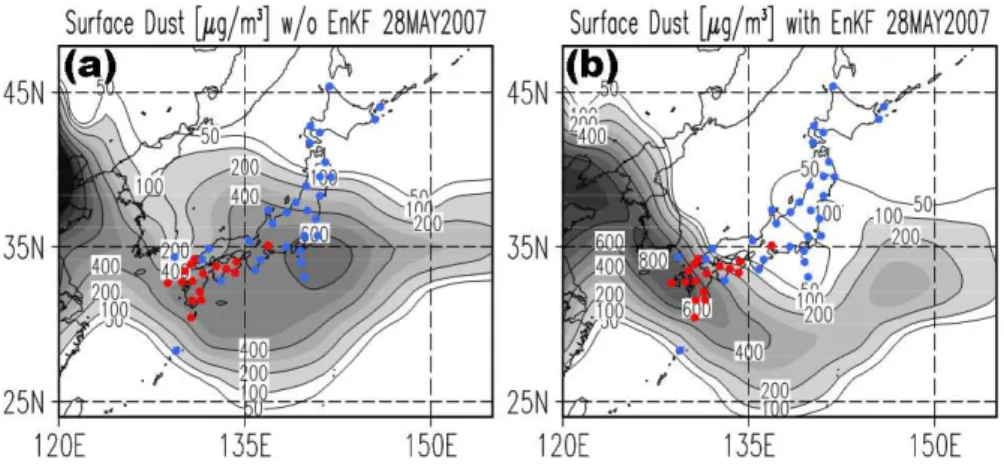
Second, a comparison of the modeled surface dust concentrations with weather
re-5
ports of aeolian dust is shown in Fig. 5, demonstrating that the horizontal distribution of dust aerosol is improved by the 4D-LETKF assimilation. Daily mean concentrations of dust aerosol, including all 10 size bins, in the lowermost layer (from the surface to 100 m) on 28 May 2007 are plotted in Fig. 5a and b for the “reference” model result and the 4D-LETKF assimilation result, respectively. Roughly speaking, a
concentra-10
tion of 100µg/m3 is recognized as the environmental quality standard of aeolian dust (cf. the Japanese Ministry of the Environment, http://www.env.go.jp/en/). No aeolian dust events were observed in the eastern part of Japan on this day, but most of Japan was swept by historically heavy dust on the previous days, 26 and 27 May 2007, ac-cording to the Japan Meteorological Agency (cf. http://www.jma.go.jp/jma/indexe.html).
15
The red circles in Fig. 5a and b indicate the JMA weather stations that observed an aeolian dust event on 28 May 2007 with less than 10-km visibility. All of these stations are located in the western part of Japan. In contrast, the weather stations that reported that they did not observe any aeolian dust event on the day (plotted as blue circles in Fig. 5a and b) are mainly located in the eastern part of Japan. It is noted that this
20
weather report is only within Japan; no dust events are plotted for Korea or China. While the “reference” model result without data assimilation suggests that most of Japan, even its eastern region, is covered with a high-concentration dust plume (Fig. 5a), the dust plume of the 4D-LETKF assimilation result is mostly limited to the area of the weather stations that observed the aeolian dust event (Fig. 5b). The dust
25
ACPD
9, 5785–5808, 2009Data assimilation of CALIPSO aerosol
observations
T. T. Sekiyama et al.
Title Page
Abstract Introduction
Conclusions References
Tables Figures
◭ ◮
◭ ◮
Back Close
Full Screen / Esc
Printer-friendly Version
Interactive Discussion that the 4D-LETKF assimilation makes it possible to monitor the horizontal distribution
of aerosol continuously and to supply the initial conditions for aerosol forecasting with high accuracy, even when it is difficult to acquire observational data at remote areas or across clouds.
4 Summary and future work
5
In the present study, we applied the 4D-LETKF data assimilation system to CALIPSO aerosol observations and successfully performed a one-month experiment in May 2007. The analysis estimates the emission intensity of dust aerosol and the spatial distribution of dust, sulfate, and sea-salt aerosols. The 4D-LETKF deals directly with the attenuated backscattering coefficients and depolarization ratios contained in the
10
CALIPSO Level 1B dataset using an observational operator that emulates the atmo-spheric optics. Consequently, the type and size of aerosols have been discriminated and assimilated by the 4D-LETKF without retrieval errors. The assimilation results have been validated by two independent observations: the extinction coefficient profiles of dust and spherical aerosols, which are measured at a ground-based lidar observatory
15
in East Asia, and the weather reports of aeolian dust events in Japan. The validation results indicated that this assimilation system can potentially provide reanalyses for the detailed three-dimensional and time-variable structure of aerosol outflows from source regions over oceans and continents for various types and sizes of aerosol particles and correct the intensity of dust emission at each grid point globally. These reanalyses
20
and corrected parameters will surely be useful for comprehensive analysis of aerosol behavior. Furthermore, this system makes it possible to supply the initial conditions for aerosol forecasting with high accuracy, even in remote areas and across clouds lacking observation.
In the next step of the 4D-LETKF experiments, we are going to install organic and
25
ACPD
9, 5785–5808, 2009Data assimilation of CALIPSO aerosol
observations
T. T. Sekiyama et al.
Title Page
Abstract Introduction
Conclusions References
Tables Figures
◭ ◮
◭ ◮
Back Close
Full Screen / Esc
Printer-friendly Version
Interactive Discussion well as dust emission. Furthermore, not only emission corrections, but also deposition
corrections, will be performed in the data assimilation system. Reanalysis precision and aerosol predictability should be assessed globally, not only within East Asia. We have not yet sufficiently inspected the sensitivity of the model resolution and the in-fluence of the ensemble size because of their high computational load. Experiments
5
assessing higher resolutions and larger ensemble sizes should also be carried out as soon as possible.
Acknowledgements. Special thanks are extended to all individuals and organizations that
pro-vided the data used in this study. The CALIPSO data were obtained via the NASA Langley Research Center website (http://www-calipso.larc.nasa.gov/). The NIES lidar data were
ob-10
tained from the NIES website (http://www-lidar.nies.go.jp/), and the lidar network is partially supported by the Japanese Ministry of the Environment. The weather reports of aeolian dust were provided by the Atmospheric Environment Division of JMA. This assimilation study was supported by a Grant-in-Aid for Young Scientists (20740275) and a Grant-in-Aid for Scientific Research (20244078) from the Japanese Ministry of Education, Culture, Sports, Science, and
15
Technology.
References
Bishop, C. H., Etherton, B. J., and Majumdar, S. J.: Adaptive sampling with the ensemble transform Kalman filter. Part I: Theoretical aspects, Mon. Weather Rev., 129, 420–436, 2001. Bouttier, F. and Courtier, P.: Data assimilation concepts and methods, Meteorological Training
20
Course Lecture Series, ECMWF, 75 pp., 1999.
Evensen, G.: Sequential data assimilation with a nonlinear quasi-geostrophic model using Monte Carlo methods to forecast error statistcs, J. Geophys. Res., 99(C5), 10143–10162, 1994.
Hara, Y., Yumimoto, K., Uno, I., Shimizu, A., Sugimoto, N., Liu, Z., and Winker, D. M.: Asian dust
25
outflow in the PBL and free atmosphere retrieved by NASA CALIPSO and an assimilated dust transport model, Atmos. Chem. Phys., 9, 1227–1239, 2009,
ACPD
9, 5785–5808, 2009Data assimilation of CALIPSO aerosol
observations
T. T. Sekiyama et al.
Title Page
Abstract Introduction
Conclusions References
Tables Figures
◭ ◮
◭ ◮
Back Close
Full Screen / Esc
Printer-friendly Version
Interactive Discussion Harlim, J.: Errors in the initial conditions for numerical weather prediction: A study of error
growth patterns and error reduction with ensemble filtering, PhD dissertation, University of Maryland, USA, 76 pp., 2006.
Hollingsworth, A., Engelen, R. J., Textor, C., Benedetti, A., Boucher, O., Chevallier, F., Dethof, A., Elbern, H., Eskes, H., Flemming, J., Granier, C., Kaiser, J. W., Morcrette, J. J., Rayner, P.,
5
Peuch, V. H., Rouil, L., Schultz, M. G., Simmons, A. J., and The GEMS Consortium: Toward a Monitoring and Forecasting System For Atmospheric Composition: The GEMS Project, B. Am. Meteorol. Soc., 89, 1147–1164, 2008.
Houtekamer, P. L. and Mitchell, H. L.: Data assimilation using an ensemble Kalman filter tech-nique, Mon. Weather Rev., 126, 796–811, 1998.
10
Hunt, B. R., Kalnay, E., Kostelich, E. J., Ott, E., Patil, D. J., and coauthors: Four-dimensional ensemble Kalman filtering, Tellus A, 56, 273–277, 2004.
Hunt, B. R., Kostelich, E. J., and Szunyogh, I.: Efficient data assimilation for spatiotemporal chaos: A local ensemble transform Kalman filter, Physica D, 230, 112–126, 2007.
Liu, Z., Vaughan, M. A., Winker, D. M., Hostetler, C. A., Poole, L. R., Hlavka, D.,
15
Hart, W., and McGill, M.: Use of probability distribution functions for discriminating be-tween cloud and aerosol in lidar backscatter data, J. Geophys. Res., 109, D15202, doi:10.1029/2004JD004732, 2004.
Lin, C., Wang, Z., and Zhu, J.: An Ensemble Kalman Filter for severe dust storm data assimila-tion over China, Atmos. Chem. Phys., 8, 2975–2983, 2008a,
20
http://www.atmos-chem-phys.net/8/2975/2008/.
Lin, C., Zhu, J., and Wang, Z.: Model bias correction for dust storm forecast using ensemble Kalman filter, J. Geophys. Res., 113, D14306, doi:10.1029/2007JD009498, 2008b.
Miyoshi, T. and Aranami, K.: Applying a Four-dimensional Local Ensemble Transform Kalman Filter (4D-LETKF) to the JMA Nonhydrostatic Model (NHM), SOLA, 2, 128–131,
25
doi:10.2151/sola.2006-033, 2006.
Miyoshi, T. and Sato, Y.: Assimilating Satellite radiances with a Local Ensemble Trans-form Kalman Filter (LETKF) applied to the JMA Global Model (GSM), SOLA, 3, 037–040, doi:10.2151/sola.2007-010, 2007.
Miyoshi, T. and Yamane, S: Local Ensemble Transform Kalman Filtering with an AGCM at a
30
T159/L48 resolution, Mon. Weather Rev., 135, 3841–3861, 2007.
ACPD
9, 5785–5808, 2009Data assimilation of CALIPSO aerosol
observations
T. T. Sekiyama et al.
Title Page
Abstract Introduction
Conclusions References
Tables Figures
◭ ◮
◭ ◮
Back Close
Full Screen / Esc
Printer-friendly Version
Interactive Discussion Miyoshi, T., Yamane, S., and Enomoto, T.: Localization the error covariance by physical
dis-tances within a Local Ensemble Transform Kalman Filter (LETKF), SOLA, 3, 089–092, doi:10.2151/sola.2007-023, 2007b.
Niu, T., Gong, S. L., Zhu, G. F., Liu, H. L., Hu, X. Q., Zhou, C. H., and Wang, Y. Q.: Data assimilation of dust aerosol observations for the CUACE/dust forecasting system, Atmos.
5
Chem. Phys., 8, 3473–3482, 2008,
http://www.atmos-chem-phys.net/8/3473/2008/.
Ott, E., Hunt, B. R., Szunyogh, I., Zimin, A. V., Kostelich, E. J., and coauthors: Exploiting local low dimensionality of the atmospheric dynamics for efficient Kalman filtering, online available at: http://arxiv.org/PS cache/physics/pdf/0203/0203058v3.pdf.
10
Ott, E., Hunt, B. R., Szunyogh, I., Zimin, A. V., Kostelich, E. J., and coauthors: A local ensemble Kalman filter for atmospheric data assimilation, Tellus A, 56, 415–428, 2004.
Shimizu, A., Sugimoto, N., Matsui, I., Arao, K., Uno, I., Murayama, T., Kagawa, N., Aoki, K., Uchiyama, A., and Yamazaki, A.: Continuous observations of Asian dust and other aerosols by polarization lidars in China and Japan during ACE-Asia, J. Geophys. Res., 109, D19S17,
15
doi:10.1029/2002JD003253, 2004.
Tanaka, T. Y. and Chiba, M.: Global simulation of dust aerosol with a chemical transport model, MASINGAR, J. Meteorol. Soc. Jpn., 83A, 255–278, 2005.
Tanaka, T. Y. and Chiba, M.: A numerical study of the contributions of dust source regions to the global dust budget, Global Planet. Change, 52, 88–104,
20
doi:10.1016/j.gloplacha.2006.02.002, 2006.
Tanaka, T. Y., Orito, K., Sekiyama, T. T., Shibata, K., Chiba, M., and Tanaka, H.: MASINGAR, a global tropospheric aerosol chemical transport model coupled with MRI/JMA98 GCM, Pap. Meteorol. Geophys., 53, 119–138, 2003.
Tanaka, T. Y., Kurosaki, Y., Chiba, M., Matsumura, T., Nagai, T., Yamazaki, A., Uchiyama, A.,
25
Tsunematsu, N., and Kai, K.: Trans-continental dust transport from North Africa and the Middle East to East Asia, Atmos. Environ., 39(21), 3901–3909, 2005.
Tanaka, T. Y., Aoki, T., Takahashi, H., Shibata, K., Uchiyama, A., and Mikami, M.: Study of the sensitivity of optical properties of mineral dust to the direct aerosol radiative perturbation using a global aerosol transport model, SOLA, 3, 33–36, doi:10.2151/sola.2007-009, 2007.
30
Tippett, M. K., Anderson, J. L., Bishop, C. H., Hamill, T. M., and Whitaker, J. S.: Ensemble square root filters, Mon. Weather Rev., 131, 1485–1490, 2003.
ACPD
9, 5785–5808, 2009Data assimilation of CALIPSO aerosol
observations
T. T. Sekiyama et al.
Title Page
Abstract Introduction
Conclusions References
Tables Figures
◭ ◮
◭ ◮
Back Close
Full Screen / Esc
Printer-friendly Version
Interactive Discussion Overview, J. Geophys. Res., 111, D12213, doi:10.1029/2005JD006575, 2006.
Whitaker, J. S. and Hamill, T. M.: Ensemble data assimilation without perturbed observations, Mon. Weather Rev., 130, 1913–1924, 2002.
Winker, D. M., Hunt, H. H., and McGill, M. J.: Initial performance assessment of CALIOP, Geophys. Res. Lett., 34, L19803, doi:10.1029/2007GL030135, 2007.
5
Yumimoto, K., Uno, I., Sugimoto, N., Shimizu, A., and Satake, S.: Adjoint inverse mod-eling of dust emission and transport over East Asia, Geophys. Res. Lett., 34, L00806, doi:10.1029/2006GL028551, 2007.
Yumimoto, K., Uno, I., Sugimoto, N., Shimizu, A., Liu, Z., and Winker, D. M.: Adjoint inversion modeling of Asian dust emission using lidar observations, Atmos. Chem. Phys., 8, 2869–
10
2884, 2008,
http://www.atmos-chem-phys.net/8/2869/2008/.
Zhang, J., Reid, J. S., Westphal, D. L., Baker, N. L., and Hyer, E. J.: A system for operational aerosol optical depth data assimilation over global oceans, J. Geophys. Res., 113, D10208, doi:10.1029/2007JD009065, 2008.
ACPD
9, 5785–5808, 2009Data assimilation of CALIPSO aerosol
observations
T. T. Sekiyama et al.
Title Page
Abstract Introduction
Conclusions References
Tables Figures
◭ ◮
◭ ◮
Back Close
Full Screen / Esc
Printer-friendly Version
Interactive Discussion
Fig. 1. Comparison of the total attenuated backscattering coefficients (sr−1km−1) at 532 nm
cross-sectioned by one of the CALIPSO orbit paths over East Asia (Japan, Korea, and Manchuria) on 27 May 2007. (a) CALIPSO/CALIOP measurements, (b) “reference” model run without assimilation, and (c) 4D-LETKF assimilation results. The X-axis shows the lati-tude (◦N), and the Y-axis shows the altitude (km). White contours indicate regions in which
ACPD
9, 5785–5808, 2009Data assimilation of CALIPSO aerosol
observations
T. T. Sekiyama et al.
Title Page
Abstract Introduction
Conclusions References
Tables Figures
◭ ◮
◭ ◮
Back Close
Full Screen / Esc
Printer-friendly Version
Interactive Discussion
ACPD
9, 5785–5808, 2009Data assimilation of CALIPSO aerosol
observations
T. T. Sekiyama et al.
Title Page
Abstract Introduction
Conclusions References
Tables Figures
◭ ◮
◭ ◮
Back Close
Full Screen / Esc
Printer-friendly Version
Interactive Discussion
Fig. 3. Comparison of NIES-lidar observed and simulated extinction coefficients for non-spherical particles (dust aerosol) at 532 nm (m−1
) at the Matsue observatory in Western Japan, near the Korean Peninsula (133◦E, 35◦N), from 12 to 31 May 2007. The X-axis shows the
date, in which each tick grid line indicates 00:00 UTC. The Y-axis shows the altitude (km). (a)
ACPD
9, 5785–5808, 2009Data assimilation of CALIPSO aerosol
observations
T. T. Sekiyama et al.
Title Page
Abstract Introduction
Conclusions References
Tables Figures
◭ ◮
◭ ◮
Back Close
Full Screen / Esc
Printer-friendly Version
Interactive Discussion
Fig. 4. Comparison of NIES-lidar observed and simulated extinction coefficients for spherical particles (sulfate and sea-salt aerosols in MASINGAR) at 532 nm (m−1
) at the Matsue obser-vatory in Western Japan, near the Korean Peninsula (133◦E, 35◦N), from 12 to 31 May 2007.
ACPD
9, 5785–5808, 2009Data assimilation of CALIPSO aerosol
observations
T. T. Sekiyama et al.
Title Page
Abstract Introduction
Conclusions References
Tables Figures
◭ ◮
◭ ◮
Back Close
Full Screen / Esc
Printer-friendly Version
Interactive Discussion