Regulates Cancer Cell Growth by Targeting miR-320a
Ao Huang1,2,3., Hongchao Zhao1,2,3., Yingjun Quan1,2,3
, Runsen Jin1,2,3, Bo Feng1,2,3, Minhua Zheng1,2,3*
1Department of Surgery, Ruijin Hospital, Shanghai Jiao Tong University School of Medicine, Shanghai, People’s Republic of China,2Shanghai Institute of Digestive Surgery, Shanghai, China,3Shanghai Minimally Invasive Surgery Center, Shanghai, China
Abstract
Background and objective:Transcriptional factor E2A is crucial for the normal development and differentiation of B and T lymphocytes. Dysregulation of E2A leads to leukemia and tumorigenesis of some solid tumors. The expression and clinical significance of E2A as well as its role in colorectal cancer (CRC) are still unknown. This study aims to assess E2A expression in CRC tissues, evaluate its prognosis value, and investigate its role in colon cancer cell growth.
Methods:E2A expression in CRC tissues and normal mucosa was detected by immunohistochemical staining; Kaplan-Meier survival curve and Cox regression model were used to evaluate the prognostic value of E2A. Lentivirus was used to construct E2A stably knocked-down cells. MTT assay was employed to detect cell proliferation change; cell cycle was analyzed by flow cytometry; and chromatin immunoprecipitation (ChIP) assay was used to validate the predicted binding target of E2A.
Results:Expression of E2A was lower in CRC tissues than normal mucosa; low E2A expression correlated with advanced TNM stage and larger tumor size, and predicted poor prognosis of CRC patients. E2A knockdown resulted in increased cell proliferation rate and cell cycle acceleration. ChIP assay showed miR-320a was a direct target of E2A and upregulation of miR-320a in E2A downregulated cells could reverse cell proliferation and cell cycle changes caused by E2A deficiency.
Conclusions:E2A is an independent prognostic factor for CRC patients and targets miR-320a to regulate cell proliferation of colon cancer cells.
Citation:Huang A, Zhao H, Quan Y, Jin R, Feng B, et al. (2014) E2A Predicts Prognosis of Colorectal Cancer Patients and Regulates Cancer Cell Growth by Targeting miR-320a. PLoS ONE 9(1): e85201. doi:10.1371/journal.pone.0085201
Editor:Rajeev Samant, University of Alabama at Birmingham, United States of America
ReceivedSeptember 3, 2013;AcceptedNovember 25, 2013;PublishedJanuary 13, 2014
Copyright:ß2014 Huang et al. This is an open-access article distributed under the terms of the Creative Commons Attribution License, which permits unrestricted use, distribution, and reproduction in any medium, provided the original author and source are credited.
Funding:This study was financially supported by National Natural Science Foundation of China (NSFC, 30873000). The funders had no role in study design, data collection and analysis, decision to publish, or preparation of the manuscript.
Competing Interests:The authors have declared that no competing interests exist. * E-mail: [email protected]
.These authors contributed equally to this work.
Introduction
The mammalian E2A gene is located at chromosome 19 and is non-tissue-specifically and ubiquitously expressed in a wide range of cell types. Through alternative splicing, the E2A gene encodes two isoforms, E12 and E47 (collectively referred as E2A proteins), which both have the basic-Helix-Loop-Helix (bHLH) domain and could regulate gene transcription by binding to the E-box DNA sequences, CAGGTG. Though widely expressed, E2A is not essential in some organogeneses like skeletal or cardiac myogen-esis, erythropoimyogen-esis, chondrogenmyogen-esis, and neurogenesis [1] but plays an important role in the development and differentiation of B [2,3] and T lymphocytes [4]. E2A deficient mice showed an arrest at the pro-B cell stage during B cell development [3] and transgenic expression of either E12 or E47 could partially rescue the B lymphopoiesis initiation; similarly, E2A deficiency led to a block at the earliest stage of T cell development [4] and disturbed thymocyte positive selection [5]. Moreover, E2A has been found to be involved in some cellular activities including cell differentiation [6], proliferation [7], apoptosis [8], cell cycle [9] and epithelial-mesenchymal transition (EMT) [10].
(mucosal-associated lymphoid tissue) lymphoma [20]. Taken together, E2A may act as a tumor-suppressor gene or as an oncogene in different cancers.
The expression of E2A in colorectal cancer (CRC) and its prognostic value have not been discussed before and it’s still unknown whether E2A promotes or represses the development of CRC. In this study, to our knowledge, for the first time we investigated the clinical significance of E2A in CRC and found its usefulness as a prognostic marker; furthermore, we found E2A suppressed tumor growth by targeting miR-320a in colon cancer cells, demonstrating its tumor-suppressive role in CRC.
Methods
Patients and clinical specimens
A total of 98 colorectal cancer patients were included; the patients were treated with surgery between June 2007 and January 2008 at Shanghai Minimally Invasive Surgery Center. Patients were excluded if they: had received neoadjuvant chemoradiother-apy; had unresectable colorectal cancers; had tumors of other organs; were unlikely to be interviewed during the follow-up. Demographic and clinicopathological data were extracted by chart review. Patients were interviewed by telephone at three months, six months, and then annually after surgery. Tumor samples were cut immediately after surgical specimens’ removal during the operations and then fixed with formalin and preserved at 4uC for two weeks before next treatment; normal tissues were defined as mucosa located at least 5cm away from the tumor margin and cut, fixed, preserved and treated as above. This study was conducted with the written informed consents of all enrolled patients before surgery and under the protocol approved by the Ethical Committee of Ruijin Hospital Shanghai Jiao Tong University School of Medicine.
Immunohistochemistry and scoring
Immunohistochemistry staining was performed as protocol previously described [21]. Briefly, after fixation with formalin, tissues were embedded with paraffin, cut, and mounted on slides. Then, slides were washed with xylene to deparaffinize, with graded ethanol to rehydrate, incubated with citrate buffer to retrieve antigen, and blocked with 3% H2O2 to inactivate
endogenous peroxidase. Slides were incubated with E2A primary antibody (Santa Cruz Biotechnology, Texas, USA; 1:200 dilution) at 4uC overnight, followed by incubation with horseradish peroxidase (HRP)-conjugated goat anti-rabbit secondary antibody (Santa Cruz) for 30 minutes at room temperature. Complex visualization was done with a 2-Solution DAB Kit (Invitrogen). Negative controls were obtained by replacing the E2A primary antibody with preimmune rabbit serum.
Slides were examined by two researchers (Huang and Quan) independently. Scoring criteria used were as previously described with minor modifications. Staining intensity was scored as 0 (no staining), 1 (weak staining), 2 (moderate staining), and 3 (strong staining); positive cells on each section were scored as 0 (less than 10%), 1 (10%-25%), 2 (26%–50%), and 3 (.50%). The final score was a product of scores of intensity and positive cell of each slide. Slides with score 0–3 were defined as low expression and 4–9 as high expression.
Cell culture
Colon cancer cell lines LOVO, HCT116, Caco-2, HT29, SW480, and SW1116 were obtained from American Type Culture Collection (ATCC) and subcultured and preserved by Shanghai Institute of Digestive Surgery; normal human colon mucosal
epithelium cell NCM460 was kindly donated by Jingqing Zeng (Ruijin Hospital, Shanghai Jiao Tong University School of Medicine; the donator bought NCM460 cell line from INCELL Corporation, LLC, San Antonio, TX, USA). LOVO was cultured in F-12K Nutrient Mixture Medium (Corning CellgroH, MA, USA), HCT116 and HT29 in McCoy’s 5A (Corning CellgroH), SW480 and SW1116 in Leibovitz’ L-15 (Corning CellgroH), and NCM460 in DMEM (Corning CellgroH). All culture medium above was supplemented with 10% fetal bovine serum (FBS) (Invitrogen, Carlsbad, CA, USA). Caco-2 was cultured in Minimum Essential Medium (Corning CellgroH) with 20% FBS. Cells were placed in the incubator (Heracelles, Germany) at 37uC, in a humidified atmosphere with 5% CO2.
Protein extraction and Western blot
Cells were harvested at a confluence of 80% with RIPA (Solarbio, Beijing, China) and the protein concentration was determined with BCA Protein Assay Kit (Thermo Scientific, USA) by measuring OD562using microplate reader (Epoch, BioTek, Winooski, USA).
Western blot was performed according to previously reported protocol [22] and primary antibodies used were E2A (1:500, Santa Cruz Biotechnology, Texas, USA). GAPDH (Kangchen, Shanghai, China) was used as loading control.
RNA and microRNA isolation, qRT-PCR
Total cell RNAs were extracted using Trizol reagent (Invitro-gen) and total cell microRNAs (miRNAs) were extracted with mirVanaTM miRNA Isolation Kit (Applied Biosystems, Foster
City, CA, USA). RNA reverse transcription was performed by using PrimeScript RT Master Mix Perfect Real Time (TaKaRa, Shiga, Japan). The mRNA level of E2A (forward: 59-CCACT TCACT GAGTC GCACAG-39; reverse: 59-GTCTC TCCCG AAGGA GGCATA-39) was evaluated by qRT-PCR, using SYBR Green PCR Master Mix (Applied Biosystems); the RNA level of GAPDH (forward: 59-GGAGC GAGAT CCCTC CAAAAT-39; reverse: 59-GGCTG TTGTC ATACT TCTCA TGG-39) was used for normalization. The expression of miR-320a was evaluated by qRT-PCR using Taqman microRNA RT Kit (Applied Biosystems, Foster City, CA, USA), TaqMan MicroRNA Assays (Applied Biosystems), and Taqman universal PCR master mix (Applied Biosystems, Foster City, CA, USA), in accordance with the manufacturers’ instructions; the U6 miRNA level was used for normalization.
Lentiviral transfection for stable expression clones E2A/shRNA-eGFP-lentivirus particles and E2A/sh-negative control (shNC)-eGFP-lentivirus particles, namely E2A/shRNA-LV and E2A/shNC-E2A/shRNA-LV, were purchased from Novobio (Shanghai, China). shNC was synthesized with the same bases of shRNA but with scrambled sequence. Lentiviral transfection and cell screening were performed according to manufacturer’s instruction to establish the E2A stably downregulated and the stably NC transefected SW480 clones, i.e. SW480/shE2A and SW480/shNC. Transfec-tion efficiency was evaluated by visual examinaTransfec-tion of the percentage of eGFP-expressing cells under fluorescence microscope (Olympus, Tokyo, Japan), western blot, and qRT-PCR.
Transient transfection
mole-cules mimicking miR-320a) and mimics NCs (negative control sequences based on C. elegans microRNAs have minimal sequence identity in human) were purchased from GenePharma (Shanghai, China). Cells of log phase were harvested and seeded in 6-well plates at a density of 4*105cells/well, 24 hours before
transfection. Lipofectamine 2000 (Invitrogen, USA) was used for transfection, in accordance with manufacturer’s instruction. Efficiency of transient transfection was examined by western blot or qRT-PCR. Cells transfected with vectors were used as control.
Cell proliferation assay
Cell proliferation assay was performed with the Cell Counting Kit-8 (CCK8) (Dojindo, Kumamoto, Japan). Briefly, cells were digested with trypsin (Beyotime, Shanghai, China), washed with phosphate-buffered saline (PBS) twice, filtered with a strainer (BD Falcon), resuspended in RIPA 1640 medium, counted, and diluted to a final concentration of 5 cells/ml. Then cells were seeded in 96-well plates, 200ml (1000 cells) per well, in sixplicate, and placed in the incubator for 6 days. Viable cells were quantified at each 24 h interval with CCK8, in accordance with manufacturer’s protocol, and the absorbance at 450 nm was measured by using microplate reader (Epoch, BioTek).
Cell cycle analysis
Before analysis, cells (26106) were harvested 48 hours after transient transfection, as well as the corresponding controls. Then, cells were washed twice with ice-cold PBS, fixed with 75% ethanol and stored at 4uC overnight. Upon analyzing, cells were washed with PBS twice and treated with RNase at 37uC for an hour, followed by staining with Propidium Iodide for 30 minutes in dark. Cell cycle analysis was then performed with flow cytometry (FACSCalibur, Becton Dickinson, MD, USA).
Chromatin immunoprecipitation assay
EZ-ChIPTM Chromatin Immunoprecipitation Kit (Millipore, Billerica, MA, USA) was purchased to perform the ChIP assay, according to the manufacturer’s protocol. Briefly, one 15 cm cell culture plate of SW480 cells (about 80% confluence) was fixed with 1% PFA (Sigma). Then cells were lysed, sonicated to shear DNA and immunoprecipitated with anti-E2A (Santa Cruz) and control antibody (IgG). After that, protein/DNA crosslink was reversed and DNA was purified for the following PCR, using Takara Ex Taq Hot Start Version (Takara).
Statistical analysis
All statistical analyses were conducted by using the SPSS 15.0 software. The correlation of clinical factors with E2A expression was examined by Pearson correlation analysis. The effect of E2A on survival was estimated using the Kaplan-Meier curve and log-rank test. Univariate and multivariate Cox’s proportional hazards model were used to evaluate the effects of E2A expression and clinicopathological parameters on 5-year OS and DFS, respec-tively. Student’s t test was used to analyze differences between two groups and one-way ANOVA was employed in case of data consisted of more than two groups. A two-tailed value ofP,0.05 was considered statistically significant.
Results
Expression of E2A correlated with CRC pathological stages
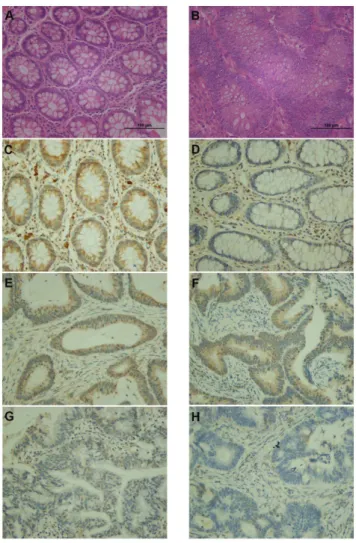
Firstly, we evaluated the expression of E2A protein in CRC tissues and normal mucosa by immunohistochemistry (Figure 1).
Colorectal tumor specimens obtained from 98 CRC patients and normal mucosa available from 43/98 patients were examined. The demographic and clinicopathological parameters of all included patients were shown in Table 1. Of the 98 patients, high expression of E2A was detected in 35/43 normal mucosa and 39/98 tumor tissues (P,0.01). Staining of E2A in normal mucosa presented in nucleus and cytoplasm both, but in cancer tissues, E2A staining was predominantly nuclear (Figure 1). More importantly, expression of E2A decreased as CRCs advanced (Figure 1E–H). We then made a correlation analysis to study the association between E2A expression and the clinicopathological factors. As shown in Table 2, low expression of E2A was significantly associated with higher TNM stage (P,0.01) and larger tumor size (P= 0.035), but was not related to patients age (P= 0.761), gender (P= 0.655), tumor histology (P= 0.985), or tumor site (P= 0.120). Thus E2A was likely to be involved in the development and progression of CRC.
Low expression of E2A predicted poor prognosis of CRC patients
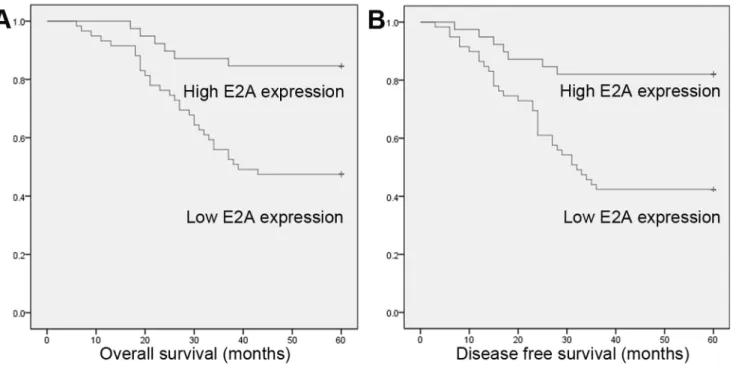
To investigate the prognostic value of E2A, we used Kaplan-Meier 5-year survival curve to show the differences in outcomes between low and high E2A expression CRC patients. As shown in Figure 2, patients with high E2A expression had longer 5-year overall survival (OS) and disease free survival (DFS) than patients with low expression. The 5-year OS and DFS for high E2A expression patients were 84.6% and 82.1%, and for patients with low E2A expression were 47.5% and 42.4% (P= 0.000, for OS and DFS both). Next, we employed the Cox regression model to examine the prognostic value of E2A. In univariate analysis, TNM stage and E2A expression were found to be predictive for OS and DFS; while in multivariate analysis, both factors also predicted worse clinical outcomes (Table 3). Hence E2A expression seemed to be a useful predictive factor for prognosis of CRC patients.
Inhibition of cell proliferation by E2A in CRC cells Considering the clinical significance of E2A, we wanted to ask whether E2A played a role in the development of CRC. Six colon cancer cell lines, LOVO, HCT116, Caco-2, HT29, SW480, and SW1116 and normal human colon mucosal epithelium cell NCM460 were screened for E2A expression by using western blot (Figure 3A). Of the seven cell lines, NCM460 showed much higher E2A expression level than all other cancer cells. Taken together with its expression in CRC patients, E2A was significantly downregulated in CRC tissues and cells.
not show any differences (Figure S1 B). To exclude the cell line dependent possibility, we constructed Caco-2/shE2A and Caco-2/ shNC clones to repeat the above experiments and results showed E2A had the same anti-proliferation role in Caco-2 cells (Figure 3D & E). Additionally, we manipulated the E2A expression in NCM460 cells. E2A silencing and restoration also affected NCM460 cell growth in a suppressive manner (Figure S1 C). Conclusively, E2A might be a negative regulator of proliferation in colon cancer cells.
E2A regulated cell cycle progression of SW480 cells Next we wanted to know the mechanisms through which E2A regulated SW480 cell proliferation. In previous publications, E2A was reported to be involved in cell cycle regulation [9,23,24]. Thus, we made cell cycle analysis by flow cytometry to detect potential changes after E2A downregulation and restoration. Consistently, the change of cell cycle explained alteration in cell proliferation: as shown in Figure 4A, cell cycle of SW480/shE2A cells differed from SW480/shNC and SW480/WT cells, with
Figure 1. IHC staining of E2A in CRC tissues and normal mucosa.Representative images of IHC are shown as: (A) HE staining of normal mucosa; (B) HE staining of CRC tissue; (C) high E2A expression (brown color) presented as nuclear and cytoplasmic staining in normal mucosa; (D) low E2A expression in normal mucosa; (E–H) stage I (E) to stage II (F), III (G), and IV (H) CRC tissues with different E2A staining intensities; E2A appeared predominantly in nucleus. Images were taken under 2006magnification.
doi:10.1371/journal.pone.0085201.g001
Table 1.Demographic and clinicopathological data.
Parameters Case number
Age (years)
40–59 44 (44.9%)
60–79 52 (53.1%)
§80 2 (2%)
Gender
Male 53 (54.1%)
Female 45 (45.9%)
Tumor histology
Tubular adenocarcinoma 80 (81.6%)
Mucinous adenocarcinoma 17 (17.4%)
Papillary adenocarcinoma 1 (1%)
Tumor site
Rectum and sigmoid 63 (64.3%)
Right colon 24 (24.5%)
Left colon 11 (11.2%)
Tumor size
!5 cm 50 (51.1%)
.5 cm 48 (48.9%)
TNM stage
I 20 (20.4%)
II 33 (33.7%)
III 31 (31.6%)
IV 14 (14.3%)
doi:10.1371/journal.pone.0085201.t001
Table 2.Association of E2A expression with demographic and clinicopathological parameters.
Parameters Group E2A expression Pvalue Low High
Age(years) 40–59 27 17 0.761
60–79 30 22
§80 2 0
Gender Male 33 20 0.655
Female 26 19
Tumor Histology Tubular 48 32 0.985
Mucinous 10 7
Papillary 1 0
Tumor Site Rectum and sigmoid 34 29 0.120
Right colon 17 7
Left colon 8 3
Tumor Size !5 cm 25 25 0.035
.5 cm 34 14
TNM stage I 4 16 0.000
II 19 14
III 23 8
IV 13 1
more cells progressed into S phase, indicating increased cell proliferation. When SW480/shE2A cells were co-transfected with either E12 or E47 plasmid, the cell cycle was normalized, which was in agreement with the restoration of cell proliferation (Figure 4B). Moreover, transfection of E12 or E47 into wild type SW480 resulted in a decrease of S phase cells (Figure S1 D). Similar regulation effects were also seen in NCM460 cells (Figure
S1 E). Thus, E2A might regulate cell cycle to control cell proliferation.
E2A controlled cell cycle by targeting miR-320a
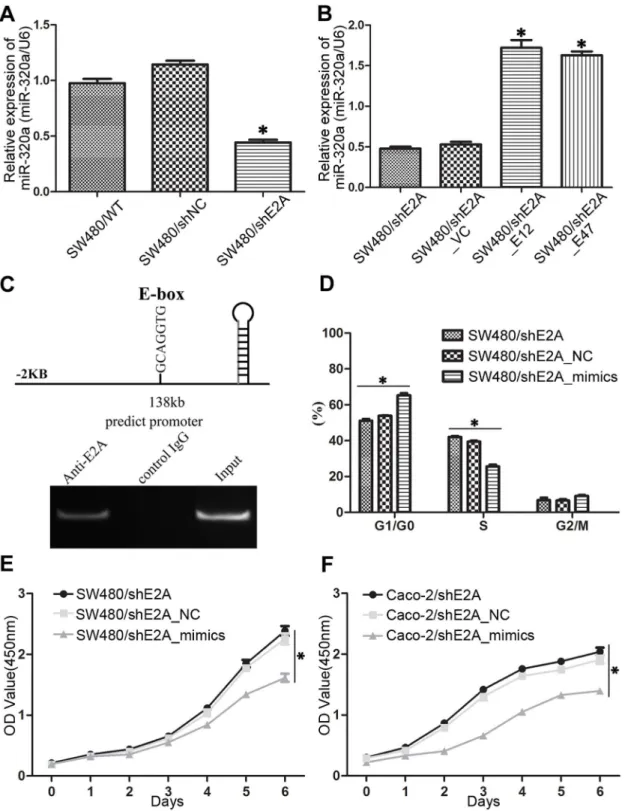
The findings above further led us to investigate how E2A regulated cell cycle change. In recent decades, microRNAs (miRNAs) have been found to be involved in the pathogenesis of human diseases including cancer [25]. Unexpectedly, we found one miRNA, miR-320a, which was a metastasis suppressor [26], was regulated by E2A. In SW480/shE2A cells, the expression of miR-320a was downregulated (Figure 5A) and transfection of either E12 or E47 into this group of cells (Figure 5B) or into wild type SW480 cells (Figure S1 F) could upregulate miR-320a. To investigate whether miR-320a was a target directly regulated by E2A, we performed the chromatin immunoprecipitation (ChIP) assay. Results showed that E2A could bind to the E-box (GCAGGTG, at -138bp, upstream of miR-320a stemloop) of 320a, suggesting E2A may regulate the expression of miR-320a by targeting its promoter sequence directly (Figure 5C).
Then, we asked whether miR-320a was the target through which E2A regulated cell proliferation. By transfecting miR-320a mimics into SW480/shE2A cells, we found the cell cycle progression caused by E2A knockdown was arrested and cell proliferation rate was decreased (Figure 5D & E). Also, co-transfection of miR-320a mimics in Caco-2/shE2A cells inhibited cell proliferation rate (Figure 5F). Hence, E2A regulated cell proliferation by directly targeting miR-320a.
Discussion
Despite great efforts having been made to improve the prevention and treatment of CRC, its morbidity and mortality still remain high: both were estimated to be the third among all cancers in USA, 2013 [27]. The tumorigenesis of CRC is a multiple process mediated by accumulating alterations in cell proliferation ability and a wide range of genetic disorders [28].
Figure 2. Kaplan-Meier survival curves for OS and DFS stratified by E2A expression.(A) OS for high and low E2A expression patients; (B) DFS for high and low E2A expression patients. Patients with high E2A expression have more favorable OS and DFS (P= 0.000, for OS and DFS both). doi:10.1371/journal.pone.0085201.g002
Table 3.Univariate and multivariate Cox regression analysis for OS and DFS in CRC patients.
Factors Univariate Multivariate
OR 95%CI P OR 95%CI P
OS
Age 0.999 0.968–1.030 0.934 0.991 0.961–1.022 0.578
Gender 1.045 0.547–1.995 0.895 1.177 0.606–2.286 0.631
Tumor Histology1.142 0.724–1.803 0.567 1.193 0.746–1.909 0.462
Tumor Site 0.821 0.570–1.183 0.290 0.958 0.654–1.403 0.825
Tumor Size 1.270 0.665–2.424 0.469 1.071 0.553–2.076 0.839
TNM stage 2.547 1.737–3.732 0.000 2.270 1.512–3.407 0.000
E2A expression 4.275 1.781–10.261 0.001 2.592 1.022–6.570 0.045
DFS
Age 0.994 0.965–1.024 0.688 0.985 0.956–1.015 0.325
Gender 1.085 0.587–2.005 0.795 1.216 0.649–2.276 0.541
Tumor Histology1.094 0.717–1.670 0.677 1.119 0.723–1.731 0.614
Tumor Site 0.862 0.606–1.227 0.409 0.973 0.674–1.405 0.884
Tumor Size 1.381 0.745–2.559 0.306 1.203 0.634–2.282 0.571
TNM stage 2.409 1.684–3.445 0.000 2.189 1.494–3.207 0.000
E2A expression 4.065 1.799–9.186 0.001 2.534 1.061–6.049 0.036
Based on these, recent studies have focused on finding new biomarkers and aberrant genetic features in CRC [29]. Here we showed E2A was a novel prognostic marker for CRC and miR-320a was a direct target through which E2A regulated colon cancer cell cycle to control cell proliferation.
The role of E2A in normal B and T cell development and leukemogenesis has been well studied [13,30,31] and it was also demonstrated to be involved in breast cancer, prostate cancer, gastric MALT and thymic lymphoma [15,17,18,20]. Specially, E2A expression is associated with tumor cell differentiation and patient outcome in breast cancer [15] and tumor stages in prostate cancer [17]. Hence, E2A is likely to be a factor linked with tumor development and have prognostic value. In supporting of this, we found that E2A expression was significantly decreased in CRC tissues compared with normal mucosa and immunohistochemistry showed a gradually decreased scoring of positive E2A staining as clinical stages advanced, indicating a negative association of E2A with CRC development and a probably tumor-suppressive effect of E2A. In Cox regression analysis, we found low expression of E2A predicted poor prognosis of OS and DFS in CRC patients independent of age, gender, tumor site, tumor histology, and tumor size. These results, which suggested a suppressive role of E2A in CRC, were in consistent with the findings in lymphoma [18,32] and leukemia [4], but contradicted with those found in breast and prostate cancer [15,17]. Considering the multistep process of CRC carcinogenesis and different biological behaviors of tumors, the discrepancy could be understood at least partially. Previous studies have shown the self-contradictive roles of E2A in proliferation: silencing of E2A in breast [15] and prostate cancer cells [17] inhibited cell growth, but in lymphoma, leukemia,
hematopoietic stem cells, and CRC cancer cells, loss of E2A led to enhanced proliferation [7,30,32,33]. Besides, enforced E47 overexpression inhibited cell growth of T cell ALL [34]. To clearly reveal the role of E2A in colon cancer cell proliferation, we constructed an E2A stably downregulated SW480 clone to investigate its effect. Consistent with prior results found in hematopoietic malignancy and CRC, we observed that downreg-ulation of E2A significantly increased cell proliferation rate and co-transfection with either E12 or E47 plasmid could offset this effect, suggesting the direct role of E2A in regulating cell proliferation. Accordingly, cell cycle analysis showed a progression from G1/G0 phase to S phase in E2A downregulated cells. Although some studies showed cell cycle arrested at G1 phase in E2A deficient cancer cells [17,23], our results were supportive to the pro-proliferation effect and in agreement with the findings of most studies which showed accelerated cell cycle progression after E2A deficiency [24,35–39]. Taken together, knockdown of E2A promoted cell cycle progression and this resulted in increased cell proliferation. These findings provide partial, if not complete, insights into the tumor suppressive role of E2A in CRC.
As a transcriptional factor, E2A exerts its functions by regulating gene expression and studies have reported its down-stream targets including p21, Id1, c-Myc, etc [17,24,36]. In our study, we found miR-320a was a target regulated by E2A in modulating cell cycle and cell proliferation. Human miR-320a is localized at chromosome 8p21.3, a locus of liver metastatic susceptibility [40], and it has been reported to be regulator of glycolysis [41] and dysregulated in cancer [42]. Studies have shown that miR-320a suppresses tumorigenesis and metastasis in CRC [26,43,44]. Unexpectedly, we identified the E-box of
miR-Figure 3. Knockdown of E2A promotes colon cancer cell growth.(A) Expression of E2A in normal human colon mucosal epithelium cell NCM460 and CRC cells lines was shown by western blot. GAPDH was used as loading control; (B) and (D) Cells with downregulated E2A expression (SW480/shE2A, Caco-2/shE2A) showed higher cell proliferation rate than that of the negative control (SW480/shNC, Caco-2/shNC) and wild type (SW480/WT, Caco-2/WT) cells; (C) and (E) Parental cells (SW480/shE2A, Caco-2/shE2A) were co-transfected with E12 or E47 plasmid (SW480/shE2A_E12 and SW480/shE2A_E47; Caco-2/shE2A_E12 and Caco-2/shE2A_E47) to restore E2A expression. Co-transfected cells showed decreased cell proliferation rate than that of the parental or vector control (SW480/shE2A_VC, Caco-2/shE2A_VC) transfected cells. All data represented as mean value6SD from 3 independent experiments. (*,P,0.05).
Figure 4. Effect of E2A on cell cycle progression.(A) Downregulation of E2A in SW480 cells led to an increase of cells at S phase and concomitantly a decrease of cells at G1/G0 phase; (B) Ectopic expression of E12 or E47 increased cells at G1/G0 phase of SW480/shE2A cells and reduced S phase cells. Data represents means6SD from 3 independent experiments. (*,P,0.05).
doi:10.1371/journal.pone.0085201.g004
Figure 5. miR-320a is a direct target of E2A to regulate cell cycle and proliferation.(A) miR-320a expression was decreased in SW480/ shE2A cells as shown by qRT-PCR; (B) Co-transfection of E12 or E47 into SW480/shE2A cells could normalize the expression of miR-320a; (C) Upper panel: sequence of the miR-320a gene showing the E-box, the predicted binding site of E2A; lower panel: ChIP assay showed E2A bound to miR-320a at its E-box, GCAGGTG; transfection of miR-320a mimics reversed the cell cycle changes (D) and cell growth (E) of SW480/shE2A cells; (F) Co-transfection of miR-320a mimics decreased cell proliferation rate of Caco-2/shE2A cells. Data is expressed with the means6SD from 3 independent experiments. (*,P,0.05).
320a as a binding site of E2A with TESS (Transcription Element Search System) and we indeed demonstrated that E2A bound to miR-320a using ChIP assay. Expression of miR-320a was regulated by E2A directly and more importantly, upregulation of miR-320a could reverse the changes caused by E2A knockdown, which further suggested it as a downstream effector of E2A. Yet, it remains unclear whether the effect of E2A on miR-320a is a global effect. Taken together, we propose that miR-320a is one of the targets through which E2A regulates cell cycle progression and cell proliferation.
In summary, we present convincing evidence showing that E2A is a prognostic factor for CRC patients and plays a tumor-suppressive role in CRC cells. Through binding directly to miR-320a, E2A regulates cancer cell cycle progression and controls cell growth. Yet, the role of E2A in solid tumors has not been fully understood and our findings only partially unveil the molecular targets and mechanisms of action of E2A. Hence, future studies are required to validate our findings and thoroughly elucidate the role of E2A in CRC.
Supporting Information
Figure S1 (A) Left: E2A protein expression of wild type SW480, control SW480, and knocked-down SW480 cells. Right: Change of E2A expression in SW480 cells after transfection of shE2A, E12 or E47: shE2A reduced the expression of E2A in SW480, while E12 and E47 increased E2A expression in SW480/shE2A cells, relative to the controls; (B) Transfection of E12 or E47 inhibited SW480/WT cell growth; (C) E2A regulates cell growth in NCM460 cells; (D) Transfection of E12 or E47 increased G0/G1
phase of SW480/WT cells and decreased the S phase; (E) E2A regulates cell cycle progression in NCM460 cells; (F) Transfection of E12 or E47 upregulated the expression of miR-320a, compared to negative control. Data is expressed as the means6SD from 3 separate experiments. (*,P,0.05; **,P,0.01).
(DOCX)
Author Contributions
Conceived and designed the experiments: AH HZ MZ. Performed the experiments: AH HZ. Analyzed the data: AH YQ. Contributed reagents/ materials/analysis tools: AH RJ BF MZ. Wrote the paper: AH.
References
1. Zhuang Y, Kim CG, Bartelmez S, Cheng P, Groudine M, et al. (1992) Helix-loop-helix transcription factors E12 and E47 are not essential for skeletal or cardiac myogenesis, erythropoiesis, chondrogenesis, or neurogenesis. Proc Natl Acad Sci U S A 89: 12132–12136.
2. Bain G, Maandag EC, Izon DJ, Amsen D, Kruisbeek AM, et al. (1994) E2A proteins are requiredfor proper B cell development and initiation of immunoglobulin gene rearrangements. Cell 79: 885–892.
3. Zhuang Y, Soriano P, Weintraub H (1994) The helix-loop-helix gene E2A is required for B cell formation. Cell 79: 875–884.
4. Bain G, Engel I, Robanus Maandag EC, te Riele HP, Voland JR, et al. (1997) E2A deficiency leads to abnormalities in alphabeta T-cell development and to rapid development of T-cell lymphomas. Mol Cell Biol 17: 4782–4791. 5. Bain G, Quong MW, Soloff RS, Hedrick SM, Murre C (1999) Thymocyte
maturation is regulated by the activity of the helix-loop-helix protein, E47. J Exp Med 190: 1605–1616.
6. Semerad CL, Mercer EM, Inlay MA, Weissman IL, Murre C (2009) E2A proteins maintain the hematopoietic stem cell pool and promote the maturation of myelolymphoid and myeloerythroid progenitors. Proc Natl Acad Sci U S A 106: 1930–1935.
7. Yang Q, Esplin B, Borghesi L (2011) E47 regulates hematopoietic stem cell proliferation and energetics but not myeloid lineage restriction. Blood 117: 3529–3538.
8. Kardava L, Yang Q, St Leger A, Foon KA, Lentzsch S, et al. (2011) The B lineage transcription factor E2A regulates apoptosis in chronic lymphocytic leukemia (CLL) cells. Int Immunol 23: 375–384.
9. Schwartz R, Engel I, Fallahi-Sichani M, Petrie HT, Murre C (2006) Gene expression patterns define novel roles for E47 in cell cycle progression, cytokine-mediated signaling, and T lineage development. Proc Natl Acad Sci U S A 103: 9976–9981.
10. Slattery C, McMorrow T, Ryan MP (2006) Overexpression of E2A proteins induces epithelial-mesenchymal transition in human renal proximal tubular epithelial cells suggesting a potential role in renal fibrosis. FEBS Lett 580: 4021– 4030.
11. Seidel MG, Look AT (2001) E2A-HLF usurps control of evolutionarily conserved survival pathways. Oncogene 20: 5718–5725.
12. Aspland SE, Bendall HH, Murre C (2001) The role of E2A-PBX1 in leukemogenesis. Oncogene 20: 5708–5717.
13. LeBrun DP (2003) E2A basic helix-loop-helix transcription factors in human leukemia. Front Biosci 8:s206–222.
14. Mo ML, Chen Z, Zhou HM, Li H, Hirata T, et al. (2013) Detection of E2A-PBX1 fusion transcripts in human non-small-cell lung cancer. J Exp Clin Cancer Res doi: 10.1186/1756 -9966-32-29.
15. Slyper M, Shahar A, Bar-Ziv A, Granit RZ, Hamburger T, et al. (2012) Control of breast cancer growth and initiation by the stem cell-associated transcription factor TCF3. Cancer Res 72: 5613–5624.
16. Hwang-Verslues WW, Chang PH, Wei PC, Yang CY, Huang CK, et al. (2011) miR-495 is upregulated by E12/E47 in breast cancer stem cells, and promotes oncogenesis and hypoxia resistance via downregulation of E-cadherin and REDD1. Oncogene 30: 2463–2474.
17. Patel D, Chaudhary J (2012) Increased expression of bHLH transcription factor E2A (TCF3) in prostate cancer promotes proliferation and confers resistance to doxorubicin induced apoptosis. Biochem Biophys Res Commun 422: 146–151.
18. Engel I, Murre C (1999) Ectopic expression of E47 or E12 promotes the death of E2A-deficient lymphomas. Proc Natl Acad Sci U S A 96: 996–1001. 19. Lietz A, Janz M, Sigvardsson M, Jundt F, Dorken B, et al. (2007) Loss of bHLH
transcription factor E2A activity in primary effusion lymphoma confers resistance to apoptosis. Br J Haematol 137: 342–348.
20. Liu TY, Chen SU, Kuo SH, Cheng AL, Lin CW (2010) E2A-positive gastric MALT lymphoma has weaker plasmacytoid infiltrates and stronger expression of the memory B-cell-associated miR-223: possible correlation with stage and treatment response. Mod Pathol 23: 1507–1517.
21. Mao Z, Sun J, Feng B, Ma J, Zang L, et al. (2013) The Metastasis Suppressor, N-myc Downregulated Gene 1 (NDRG1), Is a Prognostic Biomarker for Human Colorectal Cancer. PLoS One doi: 10.1371/journal.pone.0068206.
22. Dong TT, Zhou HM, Wang LL, Feng B, Lv B, et al. (2011) Salinomycin selectively targets ‘CD133+’ cell subpopulations and decreases malignant traits in colorectal cancer lines. Ann Surg Oncol 18: 1797–1804.
23. Zhao F, Vilardi A, Neely RJ, Choi JK (2001) Promotion of Cell Cycle Progression by Basic Helix-Loop-Helix E2A. Molecular and Cellular Biology 21: 6346–6357.
24. Prabhu S, Ignatova A, Park ST, Sun XH (1997) Regulation of the expression of cyclin-dependent kinase inhibitor p21 by E2A and Id proteins. Mol Cell Biol 17: 5888–5896.
25. Farazi TA, Spitzer JI, Morozov P, Tuschl T (2011) miRNAs in human cancer. J Pathol 223: 102–115.
26. Zhang Y, He X, Liu Y, Ye Y, Zhang H, et al. (2012) microRNA-320a inhibits tumor invasion by targeting neuropilin 1 and is associated with liver metastasis in colorectal cancer. Oncol Rep 27: 685–694.
27. Siegel R, Naishadham D, Jemal A (2013) Cancer statistics, 2013. CA Cancer J Clin 63: 11–30.
28. Fearon ER (2011) Molecular genetics of colorectal cancer. Annu Rev Pathol 6: 479–507.
29. Walther A, Johnstone E, Swanton C, Midgley R, Tomlinson I, et al. (2009) Genetic prognostic and predictive markers in colorectal cancer. Nat Rev Cancer 9: 489–499.
30. Herblot S, Aplan PD, Hoang T (2002) Gradient of E2A Activity in B-Cell Development. Molecular and Cellular Biology 22: 886–900.
31. Miyazaki M, Rivera RR, Miyazaki K, Lin YC, Agata Y, et al. (2011) The opposing roles of the transcription factor E2A and its antagonist Id3 that orchestrate and enforce the naive fate of T cells. Nat Immunol 12: 992–1001. 32. Steininger A, Mobs M, Ullmann R, Kochert K, Kreher S, et al. (2011) Genomic
loss of the putative tumor suppressor gene E2A in human lymphoma. J Exp Med 208: 1585–1593.
33. Park ST, Nolan GP, Sun XH (1999) Growth inhibition and apoptosis due to restoration of E2A activity in T cell acute lymphoblastic leukemia cells. J Exp Med 189: 501–508.
34. Wilson JW, Deed RW, Inoue T, Balzi M, Becciolini A, et al. (2001) Expression of Id helix-loop-helix proteins in colorectal adenocarcinoma correlates with p53 expression and mitotic index. Cancer Res 61: 8803–8810.
35. Yang Q, Kardava L, St Leger A, Martincic K, Varnum-Finney B, et al. (2008) E47 controls the developmental integrity and cell cycle quiescence of multipotential hematopoietic progenitors. J Immunol 181: 5885–5894. 36. Andrysik Z, Kim J, Tan AC, Espinosa JM (2013) A genetic screen identifies
37. Peverali FA, Ramqvist T, Saffrich R, Pepperkok R, Barone MV, et al. (1994) Regulation of G1 progression by E2A and Id helix-loop-helix proteins. EMBO J 13: 4291–4301.
38. Wojciechowski J, Lai A, Kondo M, Zhuang Y (2007) E2A and HEB are required to block thymocyte proliferation prior to pre-TCR expression. J Immunol 178: 5717–5726.
39. Engel I, Murre C (2004) E2A proteins enforce a proliferation checkpoint in developing thymocytes. EMBO J 23: 202–211.
40. Kno¨sel T, Schlu¨ns K, Stein U, Schwabe H, Schlag PM, et al. (2004) Chromosomal alterations during lymphatic and liver metastasis formation of colorectal cancer. Neoplasia 6: 23–28.
41. Feng B, Chakrabarti S (2012) miR-320 Regulates Glucose-Induced Gene Expression in Diabetes. ISRN Endocrinol doi: 10.5402/2012/549875. 42. Schepeler T, Reinert JT, Ostenfeld MS, Christensen LL, Silahtaroglu AN, et al.
(2008) Diagnostic and prognostic microRNAs in stage II colon cancer. Cancer Res 68: 6416–6424.
43. Sun JY, Huang Y, Li JP, Zhang X, Wang L, et al. (2012) MicroRNA-320a suppresses human colon cancer cell proliferation by directly targeting beta-catenin. Biochem Biophys Res Commun 420: 787–792.