SOCIO-ENVIRONMENTAL ISSUES OF MARGINAL TERRITORIES
WITHIN THE ROMANIAN-BULGARIAN CROSS-BORDER AREA
GEORGIANA TOTH
1, ALINA HUZUI-STOICULESCU
2ABSTRACT - The territorial system overlapping cross-border areas shapes a particularly dynamic and
complex functional area. This paper synthesises several research outcomes regarding the social and environmental dysfunctions and opportunities defining the marginal territories that were emphasised duringă theă „Analysis and diagnosis of the current situation in the cross-border area‟,ă aă phaseă ofă theă projectă„Common Strategy of Sustainable Territorial Development of the Romanian-Bulgarian Cross-Border Area‟ (SPATIAL). The main indicators concerning the population structure and movement highlight a series of problematic aspects within the cross-border area: population decline, significant rural population concentration on the Romanian side, demographic ageing, increase in the age dependency ratio, and a negative natural growth and migration rate. The analysis also indicates areas of socio-demographic potential that are marked by population growth, a significant young population presence that is convergent with an important share of active population. In this perspective, the spatial analysis also focused on identifying natural drivers affecting development and restrictive factors, on the environmental quality evaluation, as well as on establishing areas exposed to natural and technological risks. Therefore, delineating and analysing components underlying social and environmental processes were intended to determine those issues and opportunities considered to influence the evolution of this potentially functional area.
Keywords: cross-border area, functional area, demographic potential, natural drivers
THEORETICAL APPROACH TO MARGINAL TERRITORIES
As part of the „reterritorialization‟ process in Europe, cross-border areas are subject to various cooperation projects in an attempt to redefine marginal territories (Popescu G., 2008), to reverse the barrier effect and to stimulate development (Jacobs J. and Van Assche K., 2014). This particular situation is related to geopolitical relationships which are the main vector supporting the complementarity of border territorial systems. In this context, several cross-border regions were established between post-communist countries after 1990 (Perkmann M., 2003). Cross-border areas have polarised increased attention in the planning theory (Jacobs J. and Van Assche K., 2014) and the discontinuity theory (Brunet R., 1968).
In addition, the territorial system which includes the cross-border areas is highly dynamic and multi-dimensional (Prokkola E.K. et al., 2012). Considering the transitional character, one must take into account the numerous compositions, structures and functions which are representative for the unfolding socio-environmental context but also the specific sequence of features. These features can increase resilience, based on the provision of various models of spatial organisation (Turnock D., 2002). From this perspective, it is mandatory to perform a constant and continuous spatial planning along with the development of suitable political instruments for intervention.
This paper synthesises the social and environmental chapters of the spatial analysis produced within the „Commonă Strategyă ofăSustainable Territorial Development of the Romanian-Bulgarian
1 Researcher, Ph.D., INCD Urban-Incerc, Urbanproiect Branch, Sector 2, Bucharest, Romania. E-mail: toth.georgiana@incd.ro
Cross-Border Area‟ă (SPATIAL) project which is consequent to the objective of the European Commission to gain knowledge regarding the specific planning requirements within the eastern sector of the Danube region while promoting the use of best practices in this field. „SPATIAL‟ăcross-border cooperation project is aimed at creating a framework for comprehensive action to address the challenges arising from social and economic disparities, as well as to promote environmental protection. It is worth mentioning that the spatial analysis relied on an interdisciplinary approach to make sense of this meaningful space.
The demographic analysis concerning the population of the Romanian-Bulgarian cross-border area relies on data from the Romanian and Bulgarian National Statistical Institutes (NSI) and focuses on the evolution of demographic structures and phenomena, as well as their territorial distribution. Therefore, time series of statistical data were used across several analysis levels: NUTS 3 (county/district) which is a comparable level for both sides of the frontier, NUTS 5 (UAT, in Romania) and NUTS 4 (municipality, in Bulgaria). These levels offer the context for a proper in depth territorial analysis of the statistical information3. Moreover, the analysis of natural drivers, restrictive factors and of the environment quality has integrated both quantitative and qualitative data from ancillary documents that offer a global perspective on natural disparities and potential of development. For example, Spiridonova J. and Novakova M. (2005) have studied the effect of industrial sites‟ă presence in the port cities along the Danube River on increasing environmental conflicts.
CROSS-BORDER DISPARITIES AND DEVELOPMENT POTENTIAL
Population and demographic potential
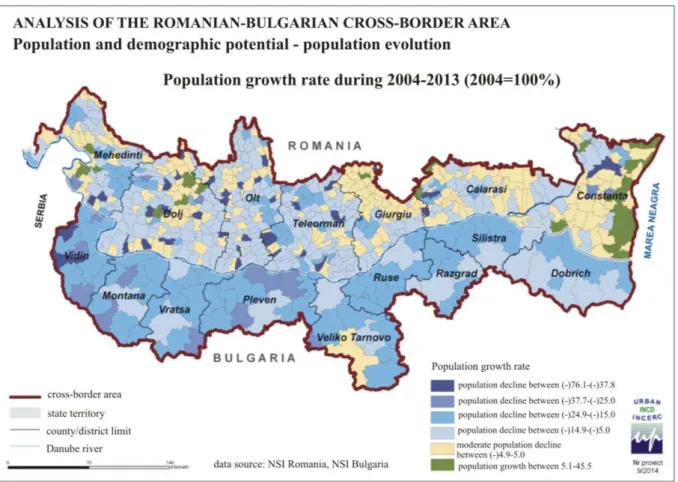
The global population of the cross-border area numbered 4,726,266 persons on the 1st of January 2013, divided between 3,129,530 persons on the Romanian side and 1,596,736 on the Bulgarian one. Changes of population size come as the result of fluctuations resulted from births, deaths, migrations and emigrations (Rotariu T., 2009, p. 111). Still, the cross-border population recorded a decline of 410,000 persons compared to 2004. This situation was more severe on the Bulgarian side both on absolute and relative terms. In this regard, the population decline between 2004 and 2013 cumulated 267,487 persons, which represented almost 15% while the population decline on the Romanian border area represented 142,687 persons (approximately 5%). In fact, the population decline was not sudden but relatively slow and constant in the same period. The population growth/decline rate values indicate Vidin, Montana, Pleven and Silistra districts as being the most affectedăbyătheăpopulationădrop.ăExceptingăConstanţaăCounty,ăallăNUTSă3ăwithinăthisăareaărecorded a drop. Considering the residential environments, the rural population in the Bulgarian study area declined by 20% during 2004-2013, whereas in the Romanian case it dropped by 6%. In the urban area, the regional population dropped by 10% in Romania and by almost 3% in Bulgaria.
As for the territorial administrative unit level (NUTS 5), the evolution of the population volume was not uniform, this fact being reflected by the population growth rate between 2004 and 2013 (Figure 1). The most significant drop was recorded on the Bulgarian side of the cross-border area. In regard to areas that were confronted with population decline, these had a relatively uniform distribution on the Bulgarian territory whereas the municipalities from the north-western region were more affected. In comparison, on the Romanian side, the territorial distribution of population decline/growth was much less homogeneous. There is a complexity of situations: NUTS 5 with important population decline, areas with moderate decline that was constant during 2004-2013 and areas marked by a slight growth. In the case of some NUTS 5 in Romania that experienced significant
decline, a possible reference might be to the administrative reorganisation that resulted in dividing the commune‟săpopulation.
Figure 1. Population growth rate during 2004-2013 in the Romanian-Bulgarian cross-border area
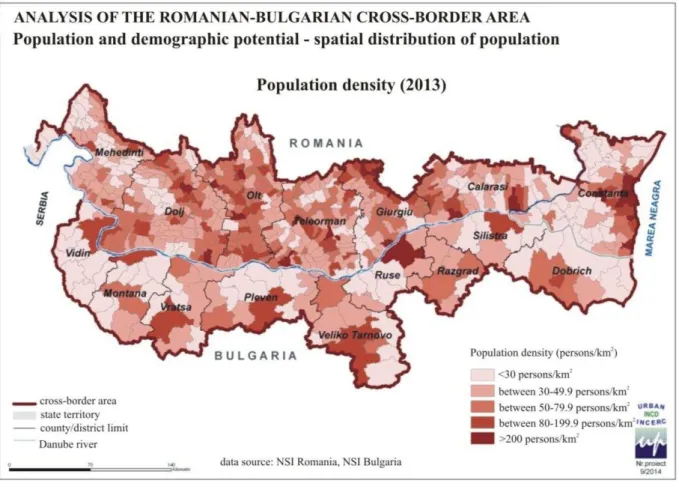
Spatial distribution of the population – population density
Figure 2. Population density in 2013 across the Romanian-Bulgarian cross-border area
Population structure according to the residential environment
The global urban population of the region summed 2,555,487 people (54% of the entire regional population) in 2013 and the rural one represented 2,160,932 persons (46% of the regional population). During 2004-2013, the urban population recorded a growth of almost 2 percentage points in comparison to the rural one which declined by 2 percentage points.
Table 1. Population structure according to the residential environment
% urban
population Romanian side of the cross-border area
2004 2013
48.0 48.9
Bulgarian side of the cross-border area 61.6 64.6
Total cross-border area 52.9 54.2
% rural population
Romanian side of the cross-border area 52.0 51.1 Bulgarian side of the cross-border area 38.4 35.4
Total cross-border area 47.1 45.8
Data source: NSI Bulgaria, NSI Romania
Population structure by gender and age
2,237,456 persons, meaning 49% of the total population. The analysis of the population structure was focused on age groups; hence, we observed that the share of young population (0-14 years) manifested a decline in the entire region, both on the Romanian and Bulgarian side. There was a simultaneous increase of the elderly population (64+ years), much more intense on the Bulgarian side. During 2003-2013, the same trend of increase in the elderly population group was noticeable within all counties/districts that form the region.
In 2013, the age dependency ratio recorded a number of 48.3 underage dependents and/or elderly people that correspond to 100 people of working age in the entire cross-border area, a fact which indicates an increase of almost 0.5 percentage points in comparison to 2004 when the value of the age dependency ratio reached 47.8. An important increase of this ratio was recorded on the Bulgarian side between 2004 and 2013, where it increased from 48.8 in 2004 to 54.4 in 2013. In the same period, the age dependency ratio manifested a decline from 47.3 underage dependents and/or elderly people that correspond to 100 people of working age to 45.4 in the Romanian side. The highest values of the age dependency ratio were recorded in 2013 in Montana, Pleven, Vratsa, and Silistra districts. At the opposite pole, values below the regional average were recorded ină Constanţa,ă MehedinţiăandăDolj. The areas which regroup localities (territorial administrative units) with high age dependency ratio were located in Dolj, Olt, Teleorman counties, as well as in Vidin district (Figure 3).
Figure 3. Age dependency ratio in 2013 across the Romanian-Bulgarian cross-border area
in the Bulgarian territory where there was a simultaneous growth of the elderly population and an intense decline of the young population in comparison to the values recorded on the Romanian side.
The natural movement of population
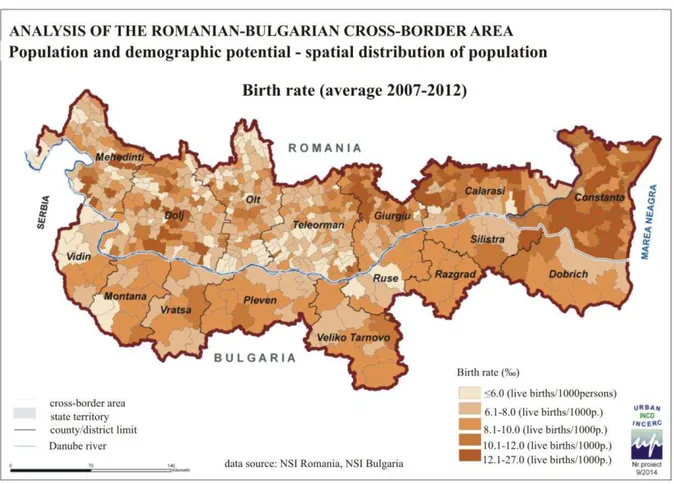
Birth rate, representing the number of live births at 1000 persons in a specific time interval (one year) exhibits a relatively constant evolution that oscillates around 8.5‰.ăIn fact, the average value of this indicator was placed around 7‰ă(Vidin,ăTeleorman)ăand 11‰(Constanţaăand C l raşi).ăă The NUTS 5 which recorded the highest birth rate values were positioned in the eastern parts of the region, limited by C l raşiăand Constanţa counties. In contrast, the lowest birth rate values were recorded in the northern area of C l raşiăCounty and in the western side of Vidin district (Figure 4).
Figure 4. The average birth rate in the time interval of 2007-2012 in the study area
The mortality rate oscillated around 15‰.ă Vidin,ă Montanaă andă Vratsaă districts,ă asă wellă asă Teleorman County were placed above the regional average. Regarding the NUTS 5, the area exhibitingătheălowestăbirthărateăisăpolarisedăbyăConstanţaăCountyăandătheăeasternăextremityăofăC l raşiă County. The mortality rate exceeded the average values in those NUTS 5 which are grouped in the western part of the cross-border area (Figure 5).
Figure 5. The average mortality rate during 2007-2012
Features of the migration within the cross-border area
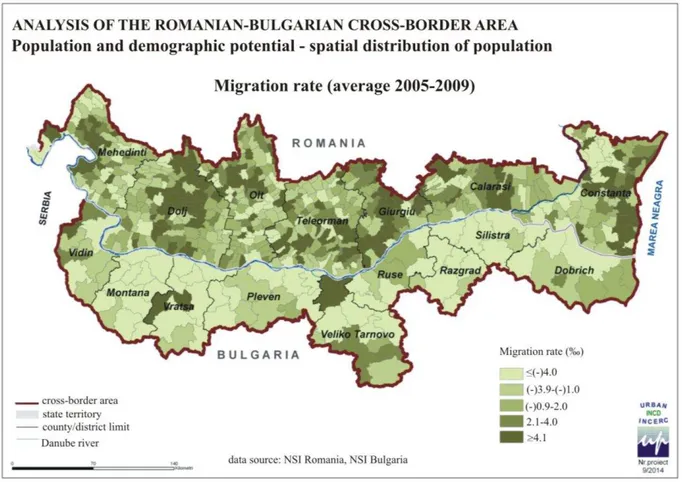
The migration movement directly influences the population structure through two components-immigration and emigration (Pressat R., 1969; Benjamin B., 1968). Within the entire cross-border area, the immigration rate reached almost 16‰ and remained inferior to the emigration one (18‰).ăThe population mobility was higher on the Bulgarian side of the cross-border area, where both emigration and immigration rate were placed above the values recorded on the Romanian side. The highest values of the immigration rate were specific to Veliko Tarnovo districtă(24.2‰),ăVidină (19.2‰)ă andă Constanţaă (18.4‰).ăIt is also Veliko Tarnovo and Vidin districts which included the highest rates of emigration and hence manifest as areas with the most mobile population in the entire region.
Figure 6. The average migration rate during 2005-2009 in the Romanian-Bulgarian cross-border area
Disparities:
Declining population number. During 2004-2013, the population size declined by
410thousand persons. This decline was more intense in the Bulgarian side of the region (almost 15%), compared to the Romanian one, where the decline was of almost 5%.
Concentrated high share of rural population in the Romanian side of the region. The share of
urban population was close to 65% in the Bulgarian territory and almost 49% for the Romanian side thus indicating a less significant urbanisation rate in the Romanian case.
Population ageing. The evolution of population according to age groups in the period
2004-2013 highlights an intensified occurrence of this phenomenon on the Bulgarian side. At territorial level, high shares of elderly population are concentrated in Dolj, Olt, Teleorman counties and Vidin district.
Increased age dependency ratio, thus of social load supported by the adult population segment
for the entire cross-border area, especially the Bulgarian side. At county/district level, the highest values of age dependency levels were recorded in Montana, Pleven, Vratsa, Silistra, Vidin district and in Dolj, Olt, Teleorman counties.
Population decline based on negative natural growth rate.ăExceptingăConstanţaăCounty, all
remaining counties/districts reflect the imbalance between birth rate and mortality, recording negative natural growth rates.
Population decline based on the migration rate. The emigration areas are located in the region
Potential:
Areas of increasing population size in the eastern side of the region, including localities from Constanţa,ăC l raşiăandăGiurgiuăcounties.
Areas withăimportantăyoungăandăactiveăpopulationăsharesăareălocatedăinăConstanţa,ăC l raşi,ă Giurgiu counties and Dobrich, Silistra or Razgrad districts.
Areas with positive natural growth rate which reflect the balance between birth rate and mortality,ălocatedăinăConstanţa,ăC l raşiăcountiesăandăSilistraăorăDobrichădistricts.
Areas where immigration exceeds emigration, marking a positive migration rate; as for the administrative units, a few areas of population polarisation stand out, where immigration exceeds emigration: the centre of Dolj County, the south-western part of Olt County, the centre of Giurgiu County andătheăeasternăpartăofăConstanţaăCounty.
Natural drivers vs. restricting factors for cross-border development
Territorial disparities are associated, with geographic and natural conditions (land use/land cover, air quality, water supply and quality, waste management, forest cover, etc.), along with transport and technical conditions (Gajdováand K. and Tuleja P., 2015). The natural drivers and restrictive factors within the Romanian-Bulgarian cross-border area represent the direct consequence of the morphological structuring of this territory which is formed mainly by plain on the northern side of Danube River, beingăshapedăbyăSeverinăDepression,ăB l ciţaăPiedmontăandătheăRomanianăPlain.ăOnă the other hand, the Bulgarian territory of the cross-border area is composed of lowlands and plains (54%), hilly areas (31.3%) and mountainous lands (14.7%). It includes the largest hilly plain in Bulgaria, the Danube Plain-which is covered with loess formations, and Shumensko Plateau. These natural conditions favour the intense agricultural exploitation of the cross-border area.
The forest coverage was determined based on Corine Land Cover 2000 and 2006 data, revealing a higher percentage of forest land cover in the Bulgarian sector of the cross-border, in Vidin district (25.4%), Veliko Tarnovo (24.9%), Montana (21.1%) and Silistra (20/7%). There is also a clear discrepancy betweenătheăsituationăofăMehedinţiăCountyă(31.5%ăofătheăcountyăisăcoveredăwithăforests)ă and the other counties included in the cross-borderă area:ă Constanţaă (3.3%),ă Teleormană (3.9%),ă C l raşiă(4.2%).ăTheăevolutionăofădeforestationărecordedăaăslightădecline (1.47 percentage points) in Olt County in 2009, compared to 2008, and by 1.83 percentage points in Giurgiu County, during the same period. It marks an intense disparity in relation to the situation of Pleven and Vratsa districts where the decline in deforestation recorded 64.6 and 53 percentage points in 2009, compared to 2008.
Disparities:
Insufficient forest coverage in Olt,ăTeleorman,ăC l raşi,ăConstanţaăcounties, on the one hand, and Pleven, Dobrich districts, on the other hand.
Areas affected by increased clear-cut forestry practices in Giurgiu County during 2007-2009.
Potential:
Topographical variety that favours a diversified land use/land cover typology and their complementary distribution.
Increased reforestation in most NUTS 3 units within the cross-border area.
Decrease in clear-cut areas in the Bulgarian cross-border sector during 2007-2009.
Environmental quality across the Romanian-Bulgarian cross-border area
Figure 7. The quantity of municipal waste collected in the Romanian-Bulgarian cross-border area
Natural and technological risks
A particular situation is the location of Seveso sites in areas affected by high flood risk, which is related to: 1) the topographic context and the presence of areas concentrating flash floods; 2) insufficient slope consolidation in the hilly area surrounding the Bulgarian settlements; 3) undersized hydro-technical works; 4) lack of reforestation interventions on intermittent and ephemeral streams. For this matter, the most relevant sites are Bâcu villageă ină Giurgiuă County,ă Işalniţaă andă Podariă communesăinăDoljăCounty,ăGalaţiămunicipality,ăKozloduiăin Vratsa district, and Svishtov in Veliko Tarnovo district. Attention is also drawn to the concentration of SEVESO units in Giurgiu-Ruse ports and the area of Silistra-C l raşi (Figure 9).
Figure 9. Distribution of SEVESO sites in the Romanian-Bulgarian cross-border area
Disparities:
Existence of large areas affected by flood risks in the Danube floodplain and along the main rivers of Mehedinţi,ăGiurgiuăand Constanţa counties, as well as Montana district.
The existence of flood-prone areas on the coastal zone, especially in the proximity of resorts; amplification of coastal erosion.
Areas with increased landslide risk which are located in Dolj,ăConstanţa counties, as well as in Pleven and Dobrich districts.
The cross-border area is exposed to high earthquake risk in the central and eastern sector, being affected by the epicentres from Vrancea, Veliko Tarnovo and Shabla-Kaliakra.
CONCLUSIONS
The research is limited at preliminary insights on the demographic characteristics of the Romanian-Bulgarian border territories that are affected by risk factors including flash floods, landslides or by poor environmental living conditions. There is a recognizable exposure to disasters in Dolj,ăOlt,ăGiurgiu,ăConstanţaăandăVelikoăTarnovo, especially considering the flood-prone areas and the presence of Seveso sites. Given the socio-demographic features of the population living in the Romanian-Bulgarian cross-border area, there is a high degree of interdependency between sustainable social development and vulnerability to natural or technological hazards and the decline in environmental quality. This may produce a strong negative impact on the development process within both sides of the cross-border area. Therefore, a joint socio-environmental perspective provides a key measure of welfare and development on marginal territories.
ACKNOWLEDGEMENT
Thisăstudyăisăbasedăonătheăresultsăobtainedăduringătheă“Analysisăandădiagnosisăofătheăcurrentă situationă ină theă crossă borderă area”,ă financedă by the Ministry of Regional Development and Public Administrationăasăpartăofătheăprojectă“CommonăStrategyăofăSustainable Territorial Development of the Romanian-Bulgarian Cross-Border Area”ă(SPATIAL).
REFERENCES
BENJAMIN, B. (1968), Demographic analysis, George Allen and Unwin LTD, London. BRUNET, R. (1968), Les phénomènes de discontinuité en géographie, CNRS, Paris.
GAJDOVÁAND, K., TULEJA, P. (2015), Regional disparities in the Economic Sphere: evidence from the selected countries of the European Union, Journal of Economics, Business and Management, vol. 3, no. 1, pp. 38-42.
JACOBS, J., VAN ASSCHE, K. (2014), Understanding empirical boundaries: A systems-theoretical avenue in border studies, Geopolitics, vol. 19, no. 1, pp. 182-205.
PERKMANN, M. (2003), Cross-border regions in Europe: significance and drivers of regional cross-border cooperation, European Urban and Regional Studies, vol. 10, no. 2, pp. 153-171. POPESCU, G. (2008), The conflicting logics of cross-border reterritorialization: Geopolitics of
Euroregions in Eastern Europe, Political Geography, vol. 27, pp. 418-438.
PRESSAT, R. (1974), Analiza demografică [Demographic Analysis],ăEdituraăŞtiinţific ,ăBucureşti. PROKKOLA, E.K., ZIMMERBAUER, K., JAKOLA, F. (2015), Performance of regional identity in
the implementation of European cross-border initiatives, European Urban and Regional Studies vol. 22, no. 1, pp. 104-117.
ROTARIU, T. (2009), Demografie şi sociologia populaţiei [Demography and Sociology of Population], Editura Polirom,ăIaşi.
ROTARIU, T. (2010), Studii demogafice [Demographic Studies], EdituraăPolirom,ăIaşi.
SPIRIDONOVA, J., NOVAKOVA, M. (2005), Bulgaria: Identifying Regions of Industrial Decline, in: Müller, B.,ăMaroš, F., Lintz, G. (eds.), Rise and Decline of Industry in Central and Eastern Europe, A comparative study of cities and regions in eleven countries, Springer.
SORA, V., HRISTACHE, I.,ăMIH ESCU, C. (1996), Demografie şi statistică socială [Demography and Social Statistics], Editura Economic ,ăBucureşti.


