ISSN 2147-8988, E-ISSN: 2149-3766
Vol. 4 No. 2, 2016, pp. 101-124
DOES PARTICIPATION IN PUBLIC WORKS PROGRAMS
ENCOURAGE FERTILIZER USE IN RURAL ETHIOPIA?
Laura Villegas
Department of Agricultural and Resources Economics
North Carolina State University, USA, Email: lvilleg@ncsu.edu
Vincent Smith
Department of Agricultural Economics and Economics
Montana State University, USA, Email: vsmith@montana.edu
Joe Atwood
Department of Agricultural Economics and Economics
Montana State University, USA, Email:jatwood@montana.edu
Eric Belasco
Department of Agricultural Economics and Economics
Montana State University, USA, Email:eric.belasco@montana.edu
Abstract
A sixth of the world’s population receives inadequate nutrition. The problem is especially severe in Africa where agricultural sectors are dominated by subsistence farmers. African small-holder farmers could double crop yields by doubling their fertilizer use. Yet, in many countries, subsistence farmers do not utilize advanced inputs that are apparently available to them at subsidized prices. This study evaluates the impact of food aid programs on agricultural productivity via changes in participants’ input decisions. It also identifies the main determinants of participation in public works programs and fertilizer use and examines whether these decisions affect one another. Using a unique cross-sectional sample of households from rural Ethiopia that permits us to examine the relation between fertilizer use and participation in a recently established safety net program, we apply novel econometric techniques to compute the marginal effects of a system of two simultaneous models with binary and censored latent dependent variables.
Keywords:Aid Program, food aid, public works, fertilizer application, Ethiopia JEL Codes: O13, P45, Q10, Q12, Q19
1. Introduction
―Most of the people in the world are poor, so if we knew the economics of being poor, we would know much of the economics that really matter. Most of the world’s poor people earn their living from agriculture, so if we knew the economics of agriculture we would know much of the economics of being poor.‖
~T.W. Schultz, 1980
technologies such as chemical fertilizer may be an essential prerequisite to enable these households, among the poorest in the world, to escape extreme poverty (International Fund for Agricultural Development, 2011). Various policies have been proposed to increase the adoption of new technologies and help families meet nutritional needs. One is the provision of economic assistance through aid-subsidized income safety net programs. In this paper, we examine the effect of one such initiative, the Ethiopian Productive Safety Net Program, on technology adoption in rural Ethiopia as represented by the use of chemical fertilizer.
Evidence of the general effect of food aid programs on the adoption of improved agricultural technologies among poor households is mixed and context-specific. With respect to Ethiopia, several previous studies that have examined the effects of food aid on agricultural production, labor supply and asset investment find no evidence that food aid provides disincentives for on-farm production, asset investment and technology adoption (Berhane et al., 2011; Bezu & Holden, 2008; Little, 2008; Yamano et al., 2005; Dorosh et al., 1995 & Bezuneh et al., 1988). These results are consistent with findings reported by several researchers for other countries and regions (Devereux et al., 2008; Hoddinott, 2008; Dercon, 2005; Abdulai et al., 2005; Lentz, 2003; Dorosh et el., 1995; Bezuneh et al., 1988). However, the evidence is not definitive. Therefore, in this study, we examine the impacts of the Ethiopian Productive Safety Net Program on technology adoption by Ethiopian small-holder farms. Our empirical results indicate that participation in public works programs and other income support programs to some extent increases the probability of using chemical fertilizers and the extent of their use.
This paper is organized as follows. Section 2 provides background information of Ethiopia’s agricultural sector and describes the Ethiopian Productive Safety Net Program (PSNP from now on). In section 3, we provide a brief review of the literature. A theoretical model of agricultural household behavior that accounts for the potential effects of household members participating in a public food for work programs is presented in Section 4. Section 5 describes the data used in the empirical analysis and the methodology is described in section 6. Section 7 presents and interprets presents, interprets and discusses the implications of the estimation results the estimation results. In section 8 economic and policy implications are discussed. We conclude the paper with some final remarks in section 9.
2. Background Information
Agriculture is the most important sector of Ethiopia’s economy, accounting for over 46% of GDP, 84% of exports and 80% of employment. Agricultural output in Ethiopia is, for the most part, produced by small-holder farm households. Households typically consist of 5-7 members farming 1 hectare of land primarily for household consumption. Food security is therefore a major concern for most of those families. To alleviate risks of food insecurity trough support from foreign aid, from January 2005 to December 2006, the Ethiopian government launched the Ethiopian Productive Safety Net Program.1 In this initial phase, the Ethiopian Productive Safety Net Program distributed $370 million worth of food and cash donations, it covered 7 out of Ethiopia’s 10 regions and targeted 318 out of 500 woredas or districts. Within these districts, it had a target caseload of 7.75 million people (9% of Ethiopia’s population).
eligible for DS transfers are those who, in addition to being chronically food insecure, have no labor and no other sources of support. (They may include labor-scarce households whose primary income earners are elderly or disabled, orphans, people who are sick, pregnant or lactating.) These households receive 30 Ethiopian birr ($3.5) or 15 kg of grain per person, per month, for six months each year.
In contrast, food and cash assistance delivered through PW are provided as an investment in agricultural production and conservation; thus, rather than distributing free aid to those in need, the PW concept requires able-bodied beneficiaries to work for food or a cash wage. The general idea of the program is to employ food-insecure farm workers during the slack season (when little work needs to be done on the farm) and pay them with food or cash to build public infrastructure like roads or irrigation canals, participate in afforestation activities, or work on building soil and water conservation structures. Geographic and household-level targeting is used to select PW beneficiaries. Drought-prone geographic areas are selected first. In these areas, the amount of food targeted for recipient woredas is based on the number of workdays needed to complete the projects proposed and designed by local administrative agencies. (The types of public works are determined at the local level and therefore differ from village to village.) Then, participants are selected by local community leaders are either given three kilograms of cereals (usually maize) or a cash payment of 6 Ethiopian birr ($0.7) per day of work. Beneficiaries are paid for up to five days of work per month per household member, for six months each year.2 There is however, evidence that the payment rate varies between villages (Barret et al., 2002).
The bulk of the program’s resources (85%) are distributed through public works wages (the remaining 15% of the resources are distributed through unconditional, direct support transfers).3 The general idea of the public works program is to employ food-insecure farm workers during the slack season (when little work needs to be done on the farm) and pay them with food or cash to build public infrastructure like roads or irrigation canals, participate in afforestation activities, or work on building soil conservation structures with the objective of indirectly enhancing productivity growth in the long run. We examine the impact of participation in PSNP public works programs on technology adoption (measured as the kilograms of chemical fertilizer used by the household in preparation for the main harvest season in the year, the Meher, which occurs between October and January and accounts for 90-95% of the country’s annual food output).
3. Literature Review
works in the areas of development and agricultural economics comprising key results regarding the impacts of social safety nets and food aid on innovation decisions among subsistence farmers.
In many sub-Saharan African countries, international aid provides the primary resources to sustain social protection or safety net programs (Barrett & McPeak, 2006). Several studies of agrarian societies have attempted to identify the effects of food assistance programs on rural and economy-wide economic development. On one hand, the argument that food aid programs are beneficial to African agriculture emphasize the role of food aid in increasing poor household’s access to, and consumption of, food in the face of shocks, improving nutritional status, health, labor productivity, and income earning capacity of the beneficiaries (Abdulai et al., 2005). On the other hand, critics of food aid programs note that food aid deliveries depress food prices and discourage food production. One argument is that they create disincentives for work and investment (either on the farm or in the off-farm labor market) as a result of increased in income (Bezu & Holden, 2008; Holden et al., 2004; Gebremedhin et al., 2002). Nevertheless, several studies have reported that when careful controls for other potential effects are included in the analyses, food aid flows do not appear to have created disincentives for local agricultural production, labor supply, asset investment, or mutual support (Abdulai et al., 2005; Letz, 2003; Dorosh et el., 1995; Bezuneh et al., 1988).
Other critics of assistance schemes report that food aid programs have overall negative impacts on economic growth (and may have a role in perpetuating poverty among recipient countries) as they induce governments to reduce expenditure on the provision of relief (Agenor & Aizenman, 2010). Some provide evidence that food aid’s characteristic volatility and poor timing have adverse impacts on household welfare and long-term development as future income uncertainty increases current consumption at the expense of investment (Desai & Kharas, 2010). In addition, questions have been raised about the longer term benefits of food aid programs and their impacts on labor markets. Recent studies have suggested that food payments may not be sufficient to compensate for the caloric requirement of the work performed, resulting in poor health and malnutrition of the participants (Gobostwand et al. 2008). Other analysts find that food for work programs have limited effects on the dietary diversity of rural households as participants shift crop mixes from nutritious to higher priced commodities (Uraguchi & Zenebe, 2011; Bezuneh et al., 1988). More recently, some researchers have asserted that the design of food for work programs is generally poorly informed and conceptually based on weak empirical evidence (Ravallion, 2012). They criticize the administrative and operational efficiency of food-for-work and food-for-training programs, question the adequacy food-based rather than cash forms of payment, the timing of payment deliveries, and doubt the efficient targeting of the programs.
4. Theoretical Framework
Technology adoption decisions are particularly complex when examined from the perspective of farm-households as economic agents. Within agricultural households, the intricate relationship between production and consumption via changes in prices and farm income limits the use of standard consumer models for the comparative statics analysis of microeconomic behavior in agrarian societies. Agricultural small-holder household analyses modify the familiar utility-maximization problem in consumer theory by introducing production and time constraints that capture the endogeneity of farm income and resolve the apparent contradictions found in empirical research. As a flexible analytical framework, the agricultural household model has been modified to represent many different scenarios and used in analyses ranging from crop portfolio selection and technology adoption to deforestation and income diversification strategies (Taylor & Adelman, 2002).
In the remainder of this section we develop a household production model that allows farm labor to be allocated to leisure, on farm labor, off farm market labor, and food for work programs to obtain predictions and formulate hypotheses about the relation between food aid wages and the use of fertilizer. These hypotheses are examined empirically in section 6.
Drawing on the agricultural household model proposed by Singh, Squire and Strauss (1986), in this study we develop a static, non-recursive representation of farmer behavior that assumes risk neutrality. Prices are assumed to be exogenous and deterministic and there are no markets for land or credit. In this model of household production, agents maximize utility subject to a time constraint, an income constraint and a production or technology constraint with the standard concavity properties.4 Households obtain utility from the consumption of leisure, goods purchased in the market, and staple foods produced in the farm.5 Our theoretical framework allows farm labor to be allocated to leisure, on farm labor, off farm market labor, and food for work programs ( ). The extent to which farmers participate in public works programs is modeled in terms of the hours a household is willing to allocate to them. An exogenously determined food-wage per unit of labor devoted to donor-funded public works programs ( ) is also introduced to reflect the potential effects of food and cash wages on fertilizer adoption. Finally, the agricultural technology adoption and intensification decision is characterized by the household’s use of a capital input.
Define variables as follows:
The household’s optimization problem is:
(1)
(2) + (3)
Equations (1)—(3) represent, respectively, the income, technology and time constraints. They can be combined to obtain the following full income constraint:
(4)
Hence,
The Langrangian for the optimization problem is:
[ ]
(5)
The first order conditions (FOCs) are:
(5a)
(5b)
(5c)
(5d)
(5e)
(5f)
marginal product of equals its market price, and the marginal rate of technical substitution equals the ratio of the inputs’ prices.7
Equation (5e) implies that the money value of the food wage from participating in PW equals the market wage for labor. Condition (5f) is a re-statement of the full income constraint.
In the absence of corner solutions, conditions (5a) through (5f) imply that the farm-household’s utility maximizing bundle of goods and leisure occurs at a point tangent to the full income constraint, which is derived from both the farm-household’s production frontier and the wage rate in the labor market. Thus, given an interior solution, the market wage rate equals the value of food aid wages and the value marginal productivity of farm labor (
). This result informs the selection mechanism guiding the household’s
choice about participating in PW programs (Holden et al., 2006). Households participate in PW programs only if the returns to farm work are as low as food aid wages and market wages, in which case households will allocate labor to equalize the marginal returns to labor in agriculture, salaried work and public works (if access to PW is unconstrained).
4.1 Key Comparative Statics: The Effects of Food Wages (α)
By inspecting the problem’s first order conditions, it is relatively easy to see how a change in the food aid wage may affect a household’s decisions over consumption, use of hired production inputs, and time allocation between leisure, on farm work, off farm work, and public works. Even with a simple model, these effects are ambiguous and generally difficult to isolate without additional knowledge. Greater precision would require further assumptions about the behavior of the production function and restrictions over the domain of the parameters. We will focus the discussion on the effect of food for work programs (when food-wages are positive) on fertilizer adoption.
The comparative statics with regards to capital input use and changes in public works wages are derived as follows:
(6)
Equation (6) shows the effect of increasing the food wage on fertilizer use, holding everything else constant. Fertilizer use can be positively (
), negatively (
) or not
related (
) to food aid wages depending on the behavior of relevant functions and
relations.
There may also be a psychological component related to food wages and a public works employment that could alter participants’ behavior and farm decisions. Working conditions and contractual functionality (such as timely payment for the labor provided) may affect participants’ morale and shape their expectations of future economic opportunities, thereby influencing farmers’ productivity (which may occur if they are suddenly motivated and optimistic about the prospects of their future) and consumption-investment decisions: in light of prospect future benefits, farmers may choose to invest on production inputs or to allocate more of their income towards consumption in the present period.
Lastly, public works programs may also affect households’ decisions through the infrastructural dividend from erected physical assets: constructed road networks facilitate access to market centers, schools and hospitals. Similarly, built irrigation systems and soil conservation structures improve the productive capacity of cultivated lands. Ready access to markets and information may encourage farmers to develop their farms for commercial purposes and therefore increase their use of technological inputs. Greater productive potential derived from improved-quality soils may also induce farmers to intensify the use of capital inputs in their plots. However, if irrigation systems and other inputs are considered substitutes of production, the opposite may follow.
The absence of unambiguous predictions obtained from the theoretical analysis highlights the need for empirical research to assess the effects of food for work programs household behavior in general. The results obtained from the theoretical model indicate that the decision to participate in aid-funded public works programs and the decision to use more or less of the technology input are likely to be simultaneously determined and a function of multiple exogenous variables such as the price of the agricultural commodity produced by the farm, off-farm labor market conditions, biophysical characteristics of the cultivated area and farmer-specific demographic characteristics. To test the hypotheses mentioned above, in this study we estimate a sophisticated econometric model of participation in public works programs and chemical fertilizer adoption using data from rural Ethiopian households.
5. Data
The Productive Safety Net Program is an international safety net program that offers relief aid to those in risk of extreme food insecurity. With its focus on shifting from food to cash transfers, the program seeks to accomplish two objectives. First, it aims at smoothing consumption and preventing asset depletion among chronically food insecure households by providing them with predictable and adequate transfers of cash and/or food. Second, the program aims at building community assets and to indirectly enhance productivity growth in the long run.
This study uses data from the Ethiopian Rural Household Survey.8 The data was collected between April and July of 2009. The survey covers 1577 randomly selected households in 15 villages in four political regions of the country (Tigray, Amhara, Oromia and the Southern Nations Nationalities and People’s Region or SNNP) chosen to represent the diversity of farming systems in the country (the sample is not nationally representative as it excludes information from households in pastoralist regions of the country). Within each village, samples are stratified by landless and female headed households. Respondents are personally interviewed and topics addressed in the survey include household demographics, agriculture and livestock ownership, food consumption habits, health indicators, and off-farm activities. The dataset also contains community-level data on access to labor markets, electricity and water, sewage and toilet facilities, health services, and education; NGO activities; migration patterns and local marketing conditions.
The sample size for this study was 231. A disproportionate number of these observations correspond to individuals from regions were fertilizer is used more intensively. Our sample focuses on households from the Tigray region and largely misrepresents the national fraction of rural households in the Oromia region. No observations are taken from the SNNP region.9
Of the farmers represented in the sample, 40 percent are illiterate (or at least had not received any form of formal education). The majority of them are middle-age men who head an average household of five people (12 percent of the interviewed households were headed by females). Around 60 percent of the households report suffering severe farm losses due to natural catastrophes during the past 5 years. Over 90 percent of the farmers use some positive amount of fertilizer. Of that group, 79 percent use organic fertilizer while 83 percent apply chemical fertilizer; 68 percent use both. The sample average amount of chemical fertilizer per hectare of land during the largest harvest season, the Meher, is 19 kilograms. Yet, there is wide variation in the data of chemical fertilizer. Although the majority of fertilizer users apply between 4 and 20 kg of fertilizer per hectare, the average is likely to be driven by some extreme observations. The average farm revenue corresponding to the few intensive users of fertilizer quadruples the mean farm revenue of the examined sample.
In our sample, 5 percent of the respondents are PW participants (43 percent of them are females), 2 percent are beneficiaries of freely distributed assistance, and 28 percent of them had been beneficiaries of food for work programs previous to the establishment of the PSNP. This composition largely misrepresents the rural population covered by the ERHS in 2009 (8 percent of households are self-reported participants of public works programs; 13 percent are self-reported beneficiaries of freely distributed aid).
6. Empirical Methods
The results from the theoretical analysis suggest that fertilizer use and participation in public works programs are likely to affect one another and be determined simultaneously. To evaluate the impact of participation in public works on fertilizer use we estimate the following structural form econometric representation of the joint decision model:
Program. measures the kilograms per hectare of chemical fertilizer applied by farmer . is a binary variable measuring whether any member in the household had worked in public works programs prior to 2005 (when the Ethiopian Productive Safety Net Program was established). is an indicator of (self-reported) severe crop damage suffered by the household in any of the five years between 2004 and 2009. is a binary variable indicating whether or not households use manure to cultivate their fields during the surveyed period. Lastly, is a binary variable measuring whether any member in the household had used chemical fertilizer in any of the 5 years between 2004 and 2009.
Vectors , and consist of exogenous variables and include farmer-specific attributes, farm-specific variables and regional characteristics, respectively. The variables included in vector are age, gender, household size and indicator variables for different levels of educational attainment. Vector includes variables that characterize the production capacity of the farm, and off-farm opportunities for the employment of household labor. Variables that characterize farm capacity include farm revenue, an indicator variable for irrigation use, the total area and number of plots under cultivation, size of owned livestock herd, value of owned assets, and an indicator variable of membership in Equibs (a type of informal risk-sharing institution). Other variables include nonfarm income, average local market wage, and an indicator variable of free assistance receipts (whether in food or cash).
Vector includes variables that define the socio-economic and agro-ecological situation of the region where the farmer resides. Variables that describe a farmer’s ability to access information and services include the number of secondary schools, and a measure of distance to market centers as a function of time. Agro-ecological variables include a continuous variable representing tree coverage in the plot farmed by each household, and an index measure that indicates how adequate the household’s land is for cultivation. Lastly, is the error term.
We estimate the system of simultaneous equations with limited and binary dependent variables using probit and tobit procedures and instrumental variables to correct for endogeneity. The methodology is analogous to the Two-Stage Limited Dependent Variable model proposed by Nelson and Olsen (1977) with the inclusion of a third stage for the correction of the latent variance. The procedure is the following. In a first stage we obtain the reduced form predictions using the continuous fitted values retrieved from the estimation of the reduced model. A probit procedure is used to model farmers’ decision to participate in a public works program; the fertilizer use decision is regressed using a simple tobit model with censoring point at zero.10
In a second stage we estimate the structural equations by replacing the endogenous (and possibly censored) and right-hand side variables with the continuous fitted latent instruments constructed in the first stage. The methodology described above provides consistent and unbiased estimates. However, given the use of instruments in the second stage, the reported parameter standard errors are not accurate. Also, the latent nature of the endogenous dependent variables implies that the underlying relationship between explanatory and response factors differs fundamentally from conventional models. Thus, to estimate marginal effects we follow the procedure proposed by Atwood and Bittinger (2011).
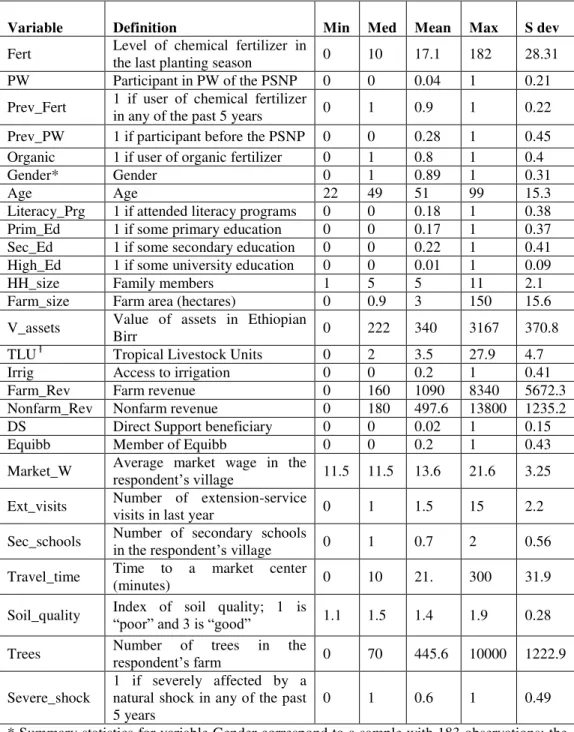
Table 1. Variable Definition and Summary Statistics
Variable Definition Min Med Mean Max S dev
Fert Level of chemical fertilizer in
the last planting season 0 10 17.1 182 28.31 PW Participant in PW of the PSNP 0 0 0.04 1 0.21
Prev_Fert 1 if user of chemical fertilizer
in any of the past 5 years 0 1 0.9 1 0.22 Prev_PW 1 if participant before the PSNP 0 0 0.28 1 0.45 Organic 1 if user of organic fertilizer 0 1 0.8 1 0.4
Gender* Gender 0 1 0.89 1 0.31
Age Age 22 49 51 99 15.3
Literacy_Prg 1 if attended literacy programs 0 0 0.18 1 0.38 Prim_Ed 1 if some primary education 0 0 0.17 1 0.37 Sec_Ed 1 if some secondary education 0 0 0.22 1 0.41 High_Ed 1 if some university education 0 0 0.01 1 0.09
HH_size Family members 1 5 5 11 2.1
Farm_size Farm area (hectares) 0 0.9 3 150 15.6
V_assets Value of assets in Ethiopian
Birr 0 222 340 3167 370.8
TLUƗ Tropical Livestock Units 0 2 3.5 27.9 4.7
Irrig Access to irrigation 0 0 0.2 1 0.41
Farm_Rev Farm revenue 0 160 1090 8340 5672.3 Nonfarm_Rev Nonfarm revenue 0 180 497.6 13800 1235.2 DS Direct Support beneficiary 0 0 0.02 1 0.15
Equibb Member of Equibb 0 0 0.2 1 0.43
Market_W Average market wage in the respondent’s village 11.5 11.5 13.6 21.6 3.25
Ext_visits Number of extension-service
visits in last year 0 1 1.5 15 2.2
Sec_schools Number of secondary schools
in the respondent’s village 0 1 0.7 2 0.56
Travel_time Time to a market center
(minutes) 0 10 21. 300 31.9
Soil_quality Index of soil quality; 1 is
―poor‖ and 3 is ―good‖ 1.1 1.5 1.4 1.9 0.28
Trees Number respondent’s farmof trees in the 0 70 445.6 10000 1222.9
Severe_shock
1 if severely affected by a natural shock in any of the past 5 years
0 1 0.6 1 0.49
* Summary statistics for variable Gender correspond to a sample with 183 observations; the other statistics were obtained from the larger sample of 231 observations obtained when the variable gender is not taken into consideration.
7. Results
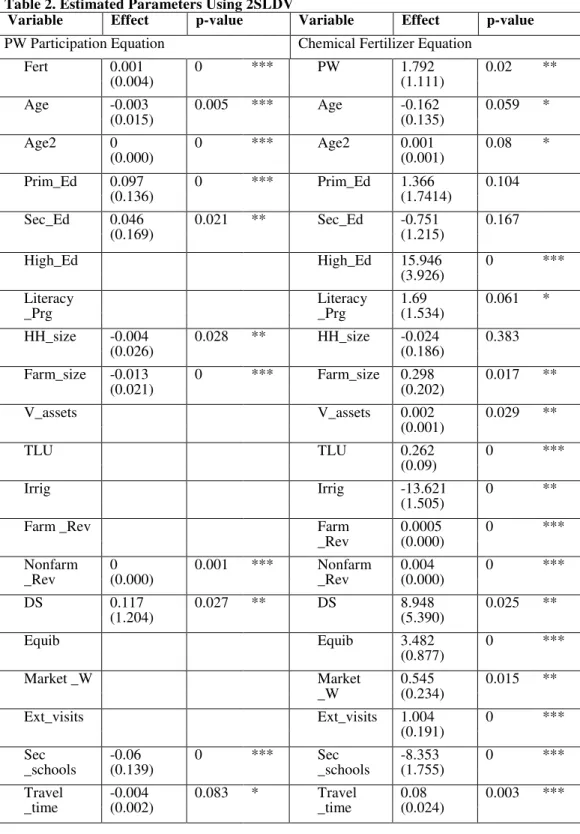
In the 2008/2009 harvest period about 80% of the Ethiopian farmers in our sample used chemical fertilizer in the form of DAP and/or urea. The average kg of chemical fertilizer applied per hectare of land was 17 kg per year; that statistic was 30 kg for the group of farmers that were participants in public works. The results from the probit-tobit simultaneous regressions show that farm households that participate in public works programs use more fertilizer than those who do not. Furthermore, fertilizer use is also positively associated with participation in other public support programs, in this case freely distributed aid and aid wages. Additionally, fertilizer appears to have a positive, although small, effect on the public works participation decision. All the results are disclosed in Table 2. They are in general consistent with previous findings in Kenya and Ethiopia (Bezu & Holden, 2008; Barret et al. (2001) & Benuzeh et al.,1988).
Other results from the econometric model are standard or fairly standard and are well known. The previous use of both chemical and organic fertilizer appears to have substantial impacts on the amount of current fertilizer use. Also, variables measuring human capital, wealth and access to income also have a positive impact on fertilizer use. In contrast, soil quality and access to irrigation have negative impacts on the amount of fertilizer used by small-holder farmers. Although we will not discuss in detail the effects on public works participation and fertilizer use from other factors, comments on some counter-intuitive findings are provided.
Based on our empirical findings, a pure income effect from PSNP transfers would translate into an increase in fertilizer use by 18 kg per beneficiary household. This would be equivalent to doubling the amount of input used by average households. However, as evidence shows, PSNP benefits do not behave as we predict pure income transfers would.12 In our study, beneficiary households increase their use of fertilizer only by a fraction of the predicted level. Moreover, the results indicate there is an effect differential between pure transfers and conditional transfers (those with a labor-intensive participation requirement). Such discrepancies admit for interesting insights on the targeting efficiency of the program and on the existence of unintended incentives attached to food wages that may be inducing participants to modify their choices of fertilizer use.
By design, only chronically food insecure households with no physically-able members are entitled to direct support transfers. That these households are among the most vulnerable may explain why the overall impact of unconditional assistance on fertilizer use is lower than the expected effect of making additional income available to them. It is possible that direct support beneficiaries are using additional resources to meet basic consumption requirements rather than to invest in farm production; indicating that PSNP resources are adequately targeting disadvantaged populations. However, that the predicted income effect from aid transfers is almost offset when adding a labor requirement to the program is not explained by the demographic differences between participants and non-participants. We examine various angles of the data to identify potential unintended incentives attached to public works that could almost offset the expected positive income effect from freely distributed assistance.
Table 2. Estimated Parameters Using 2SLDV
Variable Effect p-value Variable Effect p-value
PW Participation Equation Chemical Fertilizer Equation
Fert 0.001
(0.004)
0 *** PW 1.792
(1.111)
0.02 **
Age -0.003
(0.015)
0.005 *** Age -0.162 (0.135)
0.059 *
Age2 0
(0.000)
0 *** Age2 0.001 (0.001)
0.08 *
Prim_Ed 0.097
(0.136)
0 *** Prim_Ed 1.366 (1.7414)
0.104
Sec_Ed 0.046
(0.169)
0.021 ** Sec_Ed -0.751 (1.215)
0.167
High_Ed High_Ed 15.946
(3.926)
0 ***
Literacy _Prg Literacy _Prg 1.69 (1.534)
0.061 *
HH_size -0.004
(0.026)
0.028 ** HH_size -0.024 (0.186)
0.383
Farm_size -0.013
(0.021)
0 *** Farm_size 0.298 (0.202)
0.017 **
V_assets V_assets 0.002
(0.001)
0.029 **
TLU TLU 0.262
(0.09)
0 ***
Irrig Irrig -13.621
(1.505)
0 **
Farm _Rev Farm
_Rev
0.0005 (0.000)
0 ***
Nonfarm
_Rev
0 (0.000)
0.001 *** Nonfarm _Rev
0.004 (0.000)
0 ***
DS 0.117
(1.204)
0.027 ** DS 8.948 (5.390)
0.025 **
Equib Equib 3.482
(0.877)
0 ***
Market _W Market
_W
0.545 (0.234)
0.015 **
Ext_visits Ext_visits 1.004
(0.191)
0 ***
Sec
_schools
-0.06 (0.139)
0 *** Sec _schools
-8.353 (1.755)
0 ***
Travel
_time
-0.004 (0.002)
0.083 * Travel _time
0.08 (0.024)
0.003 ***
Variable Effect p-value Variable Effect p-value PW Participation Equation Chemical Fertilizer Equation
Soil
_quality
-0.058 (0.243)
0 *** Soil _quality
-7.692 (2.271)
0 ***
Trees Trees 0.001
(0.000)
0.026 **
Prev_PW 0
(0.000) 0 *** Prev_Fert 50.478 (6.890) 0 ***
Severe
_shock
-0.013 (0.097)
0.056 * Manure 6.212 (1.051)
0 ***
Notes: ***,**,* denote significance at the one, five and ten percent level Standard errors are presented beneath the estimated coefficient in parenthesis A value of 0.000 means it is less than 0.0001
7.1. Other Effects on Fertilizer Use
Although most results are in line with previous findings in the literature, there are some unexpected results. The first is the positive effect of average market wage for non-farm labor on fertilizer use. It had been hypothesized that if average market wage reflects the opportunity cost of farming, whenever the opportunity cost of farming is high, farmers would dedicate less labor to farming activities. The observed positive relation may be reflecting overall regional economic performance or market and information accessibility. Another unexpected result was the negative impact from additional secondary school on fertilizer use. The number of secondary schools was expected to be positively correlated with market interactions, and therefore fertilizer use. This counter-intuitive finding may be driven by unobserved relations between the number of secondary schools and other important socio-economic characteristics—like population pressure.
Also surprising is the positive relationship between remoteness or geographical isolation, measured as the distance to market centers, and fertilizer use. We were expecting a negative relation since is likely related to transportation-induced transaction costs and limited access to information. This result may derive from the lack of variation and overall small values of the explanatory variable measuring travel time to market centers.15 A fourth unexpected result is, considering the level of enthusiasm in the literature with regards to livestock ownership as a measure of wealth, the apparently small magnitude of impact of an additional tropical livestock unit on fertilizer use. Lastly, visits by extension agents are noticeable for their negligible impact on fertilizer use.
8. Policy Implications
Our results provide an optimistic evaluation of the design and potential effects of PSNP transfers. However, the observed impact differential between freely distributed assistance and public works wages raises questions about the adequacy of the program to encourage fertilizer use. In addition, the following lessons regarding fertilizer adoption in Ethiopia can be derived from our empirical results:
First, in our study the variable with the greatest explanatory power in the fertilizer use decision is familiarity with fertilizer as measured by previous use. This provides some evidence in favor of the hypotheses that technology intensification is a dynamic process and that it takes time for farmers to adjust their expectations to new knowledge and experience.
individual who had received education beyond high-school level the expected use of fertilizer is 16 kg greater than that of households headed by illiterate individuals.) Our results may provide evidence of a positive externality from the scheduled expansion of Ethiopia’s higher education system.
Third, equib membership was found to be persistently significantly and positively related to fertilizer use. (According to our results, average farmers belonging to these institutions use 23 percent more fertilizer than their counterparts.) These findings indicate that informal risk-sharing and credit providing associations may be important instruments to elude market failures in rural Ethiopia.
Fourth, in our data, it is difficult to disencumber the correlation between poor soil quality and increased use of chemical fertilizer. It is not clear whether farmers are using fertilizer to compensate for the poor quality of their soils or whether input intensification (maybe related to intensive cultivation) is driving the decay in soil quality. Given that community development projects devote many of their resources towards afforestation efforts and the construction of soil conservation structures like stone terraces, more scientific research on the biological stability of ecosystems in rural Ethiopia is recommended.
Finally, the negligible success of policy initiatives aimed at familiarizing small-holder households with modern technologies suggests there is room for improving government-sponsored agricultural extension service and outreach programs.
9. Conclusion
Increasing the use modern agricultural inputs (in particular fertilizer) is seen by many agricultural experts as a prerequisite to increase agricultural production and therefore reduce the risks of food insecurity and chronic poverty in sub-Saharan Africa. In this study, we use household data from rural Ethiopia to examine whether the Ethiopian Productive Safety Net Program encourages the use of fertilizer.
Above all, the results from a probit-Tobit simultaneous equation model for fertilizer use and participation in a safety net program do not support the disincentive effects hypothesis that international aid discourages investment in farm production among aid recipients. Instead, the results indicate that participants of public works administered by the Ethiopian PSNP use significantly greater amounts of fertilizer than nonparticipants. In addition, this study identifies various significant determinants of public works participation and fertilizer use. The results show that previous use of fertilizer is an important determinant of fertilizer adoption and intensification. In addition, the evidence indicates that educational attainment positively influences fertilizer use among small-holder farmers in Ethiopia. Finally, the findings suggest that membership in community-based, risk-spreading and credit-providing institutions has a positive impact on fertilizer use.
The results of this study provide evidence that participation in a public works program positively influences participants’ use of fertilizer. The results also raise important questions regarding the performance of the Ethiopian Safety Net Program, the largest development aid program in Ethiopia. Specifically, the findings question whether the safety net program is efficiently targeting the poorest households in rural Ethiopia, and whether the timely delivery of the payments affects production and consumption decisions of the beneficiaries.
References
Abdulai, A., Barrett, C. B., & Hoddinott, J. (2005). Does food aid really have disincentive effects? New evidence from sub-Saharan Africa, World Development, 33(10), 1689- 1704.
Acemoglu, D. (2009). Introduction to Modern Economic Growth. Princeton, New Jersey, Princeton University Press, 3-23.
Adegbola, P., & Gardebroek, C. (2007). The effect of information on technology adoption and modification decisions. Agricultural Economics 73(37), 55-65.
Adelman, I., & Taylor, J. (2003). Agricultural household models: Genesis, evolution, and extensions. Review of Economics of the Household 1, 33-58.
Agenor, P., & Aizenman, J. (2010). Aid volatility and poverty traps. Journal of Development Economics 91, 1-7.
Akhter, A., & Zohir, S. K. K. (1995). Bangladesh food-for-work program and alternatives to improve food security. IFPRI. Washington DC: International Food Policy Research Institute.
Alderman, H., & Sahn, D. E. (1996). The effect of food subsidies on labor supply in Sri Lanka. Economic Development and Cultural Change, 45, 125-45.
Alem, Y., Bezabih, M., Kassie, M., & Zikhali, P. (2010). Does fertilizer use respond to rainfall variability? Panel data evidence from Ethiopia. Agricultural economics 41, 165-175.
Alston, J. M., C. Chan-Kang, M. C. Marra, P. G. Pardey, & T.J.Wyatt.(2000). A meta-analysis of the rates of return to agricultural R&D: Ex pede Herculem (IFPRI Research Report No. 113). Washington,D.C.: International Food Policy Research Institute.
Amare, M., Asfaw, S., & Calfat, G. (2010). Food aid and rural poverty in Ethiopia. IOB Discussion Paper 2010.5. Antwerp, Belgium: Institute of Development Policy and Management.
Andersson, C. (2010). Can a social safety net affect farmers’ crop portfolios? A study of the Productive Safety Net Programme in Ethiopia. Umeå University, Department of Economics.
Andersson, C., Mekonnen, A., & Stage, J. (Forthcoming). Impacts of the Productive Safety Net Programme in Ethiopia on livestock and tree holdings of rural households. Journal of Development Economics.
Appel, J., & Karlan, D. (2011). More Than Good Intensions: How a New Economics Is Helping to Solve Global Poverty. New York: Dutton. Print. Applied Econometrics, 4, 23-39.
Athanasios, A., Bezuneh, M., & Deaton, B. (1994). Impacts of FFW on nutrition in rural Kenya. Agricultural economics 11, 301-309.
Atwood, J., & Bittinger, A. (2011). Developing consistent marginal effects in a simultaneous equation model with limited dependent variables. Montana State University and University of Minnesota.
Awokuse, T. O. (2011). Food aid impacts on recipient developing countries: A review of empirical methods and evidence. Journal of International Development, 23, 493-514. Ayele, G., Davis, K., Negash, M., & Spielman, D. (2011). Rural innovation systems and
networks: Findings from a study of Ethiopian smallholders. Agricultural Human Values 28, 195-212.
Barret, C.B., & McPeak, J. (2004). Poverty traps and safety nets. USAID Pastoral Risk Management (PARIMA) project, Cornell University. Ithaca, New York, USA.
Barrett, C.B., & Marenya, P. (2009). Soil quality and fertilizer use rates among smallholder farmers in western Kenya. Agricultural Economics 40, 561-572.
Barrett, C.B. (2001). Does food aid stabilize food availability? Economic Development and Cultural Change, 49(2), 335-349.
Barrett, C.B., Carter, M.R., Timmer, C.P. (2010). A century-long perspective on agricultural development. American Journal of Agricultural Economics, 92(2), 447-468.
Barrett, C.B., Clay, D., & Holden, S. (2004). Can food-for-work programmes reduce vulnerability? In Dercon, S (Ed.): Insurance against poverty. Oxford: University of Oxford.
Barrett, C.B., Hagos, F., & Holden, S. (2006). Food-for-work for poverty reduction and promotion of sustainable land use: Can it work?. Environment and Development Economics, 11(1), 15-38.
Barrett, C. B., Reardon, T., & Webb, P. (2001). Non-farm income diversification and household livelihood strategies in rural Africa: concepts, dynamics, and policy implications. Food Policy, 26(4), 315–331.
Barrett, C. Food Security and Food Assistance Programs. In Alderman, H., Christiaensen, L., & Yamano, T. (2005). Child growth, shocks and food aid in rural Ethiopia. American Journal of Agricultural Economics, 87(2), 273-288.
Basu, K. (1996). Relief programs: When it may be better to give food instead of cash. World Development, 24, 91-96.
Belshaw, D., Lirenso, A., & Maxwell, S. (2008). The disincentive effect of food-for-work on labour supply and agricultural intensification and diversification in Ethiopia. Journal of Agricultural Economics 45(3): 351–359.
Benin, S., Ehui, S., Gebremedhin, B., Pender, J., & Smale, M. (2004). The economic determinants of cereal crop diversity on farms in the Ethiopian highlands. Agricultural Economics, 31,197–208.Berry, P., Kherallah, M., & Minot, N. (2000). Fertiliser Market Reform and the Determinants of Fertiliser Use in Benin and Malawi (Discussion paper No. 40). Washington DC: International Food Policy Research Institute .
Besley, T., & Coate, S. (1992). Workfare versus welfare incentive arguments for work requirements in poverty-alleviation programs. American Economic Review, 82, 249-61. Besley, T., Case, A., & May 1993. Modeling Technology Adoption in Developing Countries.
American Economic Review 83, 396-402.
Bezu, S., & Holden S. (2008). Can food-for-work encourage agricultural production?. Food Policy, 33, 541–549.
Bezuneh, M., Deaton, B., & Norton, G. W. (1988). Food Aid Impacts in Rural Kenya. American Journal of Agricultural Economics, 70, 181-191.
Bezuneh, M., Deaton, B.J., & Norton, G.W. (1988). Food aid impacts in rural Kenya. American Journal of Agricultural Economics,70 (1), 181–191.
Bisrat, A. (1980). The diffusion of fertilizer in Ethiopia: Pattern determinants and implications. Journal of Developing Areas, 4(3), 387-399.
Calfat, G., & Reda, M. A. (2010). Food aid impact on poverty reduction: Empirical evidence from rural households in Ethiopia. Universiteit Antwerpen, Institute of Development Policy and Management (IOB).
Christiansen, L., & Dercon, S. (2011). Consumption risk, technology adoption and poverty traps: Evidence from Ethiopia. Journal of Development Economics 96, 159-173.
Clay, D. C., Molla, D., & Habtewold, D. (1998). Food aid targeting in Ethiopia: A study of who needs it and who gets it. Food Policy, 34(3), 391-409.
Crawford, E., Kelly, V., & Reardon, T. (1994). Links between nonfarm income and farm investment in African households: Adding the capital market perspective. American Journal of Agricultural Economics 76(5), 1172-1176.
Dalrymple, D. (1979). The adoption of high-yielding grain varieties in developing nations. Agricultural History 53(4), 704-726.
De Janvry, A., Fafchamps, M., & Sadoulet, E. (1991). Peasant household behaviour with missing markets: Some paradoxes explained. The Economic Journal 101(409), 1400-1417.
de Janvry, A., Fafchamps, M., & Sadoulet, E. (1991). Peasant Household Behaviour with Missing Markets: Some Paradoxes Explained. The Economic Journal , 101, 1400- 1417. Devereux, S., & K. Sharp (2006): Trends in poverty and destitution in Wollo, Ethiopia.
Journal of Development Studies, 42(4), 592-610.
Duflo, E., Kremer, M., & Robinson, J. (2011). Nudging Farmers to Use Fertilizer: Theory and Experimental Evidence from Kenya. American Economic Review 101(6), 2350-2390.
Enfors, E., & Gordon, L. (2008). Dealing with drought: The challenge of using water system technologies to break dryland poverty traps. Global Environmental Change 18,
607-616.
Ethiopia Rural Household Survey Dataset, 1989-2009. 2011. Washington, D.C.: International Food Policy Research Institute (IFPRI) (datasets). <http://www.ifpri.org/dataset/ethiopian-rural-household-surveys-erhs>.
Fafchamps, M., & Gubert, F. (2006). The formation of risk sharing networks Journal of Development Economics 83, 326-350.
Fafchamps, M. 2004. Market Institutions in Sub-Saharan Africa: Theory and Evidence. Cambridge, MA: MIT Press.
Feder, G. (1980). Farm size, risk aversion, and the adoption of new technology under uncertainty. Oxford Economic Papers, 32(2), 236-283.
Feder, G., Just, R., & Zilberman, D. (1985). Adoption of agricultural innovations in developing countries: A survey. Economic Development Cultural Change30, 59-76. Fofack, H. (2008). Technology trap and poverty trap in sub-Saharan Africa. (Policy
Research Working Paper 4582). Poverty Reduction and Economic Management Division, The World Bank.
Foster, A., & Rosenzweig, M. (2010). Microeconomics of Technology Adoption. Annual Review of Economics 2, 395-424.
Gedamu, A. (2006). Food for Work Program and its Implications on Food Security: A critical review with a practical example from the Amhara region, Ethiopia. Journal of Agriculture and Rural Development in the Tropics and Subtropics 107(2), 177-188. Gelan, A. (2006). Cash or food aid? A general equilibrium analysis for Ethiopia,
Development Policy Review, 24(5), 601-624.
Gelan, A. U. (2007). Does food aid have disincentive effects on local production? A general equilibrium perspective on food aid in Ethiopia. Food Policy, 32, 436-458.
Gilligan, D.O., Hoddinott, J., Kumar, N., & Taffesse, A.S. (2009). An impact evaluation of Ethiopia’s Productive Safety Nets Program. IFPRI. Washington, DC: International Food Research Institute.
Gilligan, D.O., Hoddinott, J., & Taffesse, A.S. (2008). An analysis of Ethiopia’s Productive Safety Net Program and its linkages. (IFPRI Discussion Paper 839). Washington, DC: International Food Policy Research Institute.
Gilligan, O.D., & Hoddinnot, J. (2006). Is there persistence in the impact of emergency food aid? Evidence on consumption, food security and assets in rural Ethiopia. American Journal of Agricultural Economics, 89(2), 225-242.
Greene, W. H. (2008). Econometric Analysis (6th Edition). New Jersey: Pearson Hall. Hoddinott, J. (2004). Examining the incentive effects of food aid on household behaviour in
Holden, S., & Shiferaw, B., (2004). Land degradation, drought and food security in a less-favored area in the Ethiopian Highlands: a bio-economic model with market imperfections. Agricultural Economics 30, 31–49.
Holden, S., Shiferaw, B., & Pender, J. (2004). Non-farm income, household welfare, and sustainable land management in a less-favoured area in the Ethiopian highlands. Food Policy 29, 369–392.
Horna, J. D., von Oppen, M., & Smale, M. (2005). Farmer willingness to pay for seed-related information: rice varieties in Nigeria and Benin. IFPRI. Washington, DC: International Food Research Institute.
Little, P.D. (2008). Food aid dependency in Northeastern Ethiopia: myth or reality? World Development 36(5), 860–874.
Maddala, G. S. (1983). Limited-Dependent and Qualitative Variables in Econometrics. Cambridge: Cambridge University Press.
Nelson, F., & Olson, L. (1978). Specification and Estimation of a Simultaneous-Equation Model with Limited Dependent Variables. International Economic Review, 19(3), 695-709.
Ravallion, M. (1999). Appraising workfare. World Bank Research Observer14(1), 31-48. Ravallion, M., Datt, G., & Chaudhuri, S. (1999). Does Maharashtra´s employment guarantee
scheme guarantee employment? Effects of the 1988 wage increase. Economic Development and Cultural Change41(2),251-75.
Rosenzweig, M.R., & Wolpin, K.I. (1993). Credit market constraints, consumption smoothing, and accumulation of durable production assets in low-income countries: investments in bullocks in India. Journal of Political Economy 101(2), 223–244.
Shultz, T. W. (1960). Value of US farm surpluses to underdeveloped countries. Journal of Farm Economics, 42(5), 1019-1030.
Tedla, T. (2011). Factors determining fertilizer adoption of the peasant farm sector in northern Ethiopia, Tigray region. Norwegian University of Life Sciences, Department of Economics and Resource Management.
van der Berg, M., & Kumbi, G. (2006). Poverty and the rural nonfarm economy in Oromia, Ethiopia. Agricultural Economics 35, 469-475.
Appendix
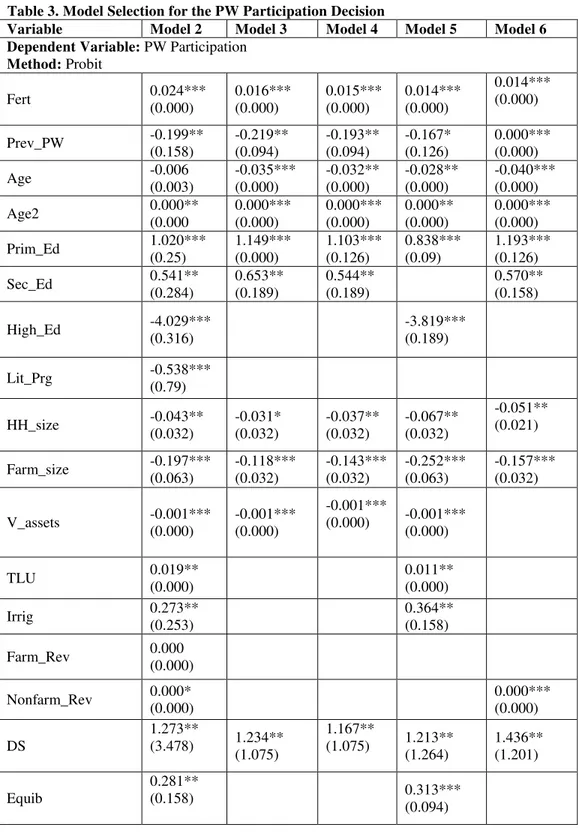
Table 3. Model Selection for the PW Participation Decision
Variable Model 2 Model 3 Model 4 Model 5 Model 6 Dependent Variable: PW Participation
Method: Probit
Fert 0.024***
(0.000) 0.016*** (0.000) 0.015*** (0.000) 0.014*** (0.000) 0.014*** (0.000)
Prev_PW -0.199** (0.158) -0.219** (0.094) -0.193** (0.094) -0.167* (0.126) 0.000*** (0.000)
Age -0.006
(0.003) -0.035*** (0.000) -0.032** (0.000) -0.028** (0.000) -0.040*** (0.000)
Age2 0.000**
(0.000 0.000*** (0.000) 0.000*** (0.000) 0.000** (0.000) 0.000*** (0.000)
Prim_Ed 1.020***
(0.25) 1.149*** (0.000) 1.103*** (0.126) 0.838*** (0.09) 1.193*** (0.126)
Sec_Ed 0.541**
(0.284) 0.653** (0.189) 0.544** (0.189) 0.570** (0.158)
High_Ed -4.029*** (0.316)
-3.819*** (0.189)
Lit_Prg -0.538*** (0.79)
HH_size -0.043** (0.032) -0.031* (0.032) -0.037** (0.032) -0.067** (0.032) -0.051** (0.021)
Farm_size -0.197*** (0.063) -0.118*** (0.032) -0.143*** (0.032) -0.252*** (0.063) -0.157*** (0.032)
V_assets -0.001*** (0.000) -0.001*** (0.000) -0.001*** (0.000) -0.001*** (0.000)
TLU 0.019**
(0.000)
0.011** (0.000)
Irrig 0.273**
(0.253)
0.364** (0.158)
Farm_Rev 0.000 (0.000)
Table 3.(Continued) Model Selection for the PW Participation Decision
Variable Model 2 Model 3 Model 4 Model 5 Model 6 Dependent Variable: PW Participation
Method: Probit
Market_W 0.002*** (0.032)
0.021* (0.032)
Ext_visits -0.087*** (0.032)
-0.068***
(0.032)
Sec_schools -0.629*** (0.189)
-0.686*** (0.126)
-0.666*** (0.126)
-0.334** (0.126)
-0.740*** (0.126)
Travel_time -0.007*** (0.000)
-0.005** (0.000)
-0.004** (0.000)
-0.007** (0.000)
0.000* (0.000)
Soil_quality -0.675** (0.316)
-0.592*** (0.221)
-0.648*** (0.221)
-1.066*** (0.284)
-0.709*** (0.252)
Trees -0.001***
(0.000)
-0.001*** (0.000)
-0.001***
(0.000)
Severe_shock -0.609*** (0.126)
-0.606*** (0.094)
-0.643* (0.094)
-0.587*** (0.094)
-0.155*** (0.094)
Degrees of Freedom:
224 Total; 200
Residual
224 Total; 208
Residual
224 Total; 209 Residual
224 Total; 206
Residual
224 Total; 209
Residual Residual Deviance: 63.24 64.95 65.33 66.74 66.92
AIC: 113.2 98.95 97.33 104.7 98.92
Notes: ***,**,* denote significance at the one, five and ten percent level
p-values were calculated as the probability that the effect of the independent variable was equal to zero
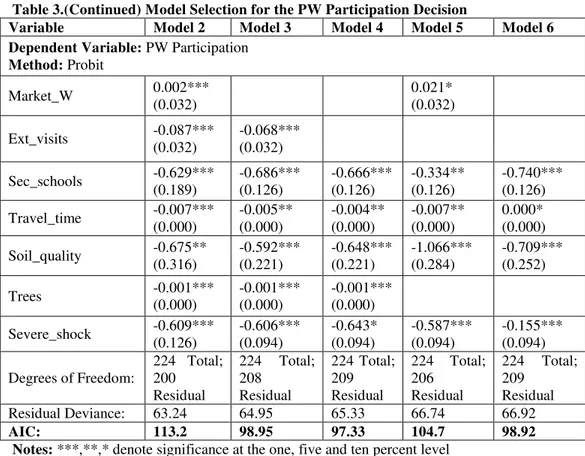
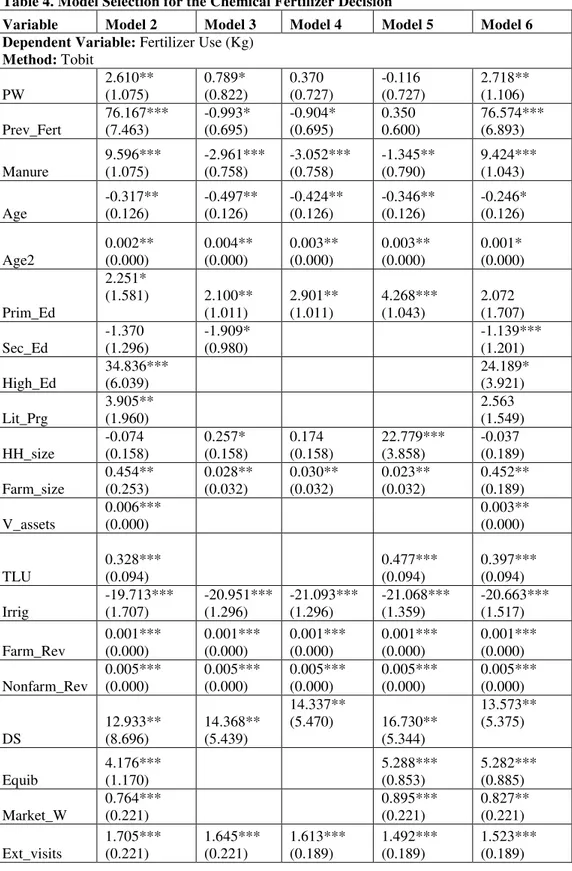
Table 4. Model Selection for the Chemical Fertilizer Decision
Variable Model 2 Model 3 Model 4 Model 5 Model 6 Dependent Variable: Fertilizer Use (Kg)
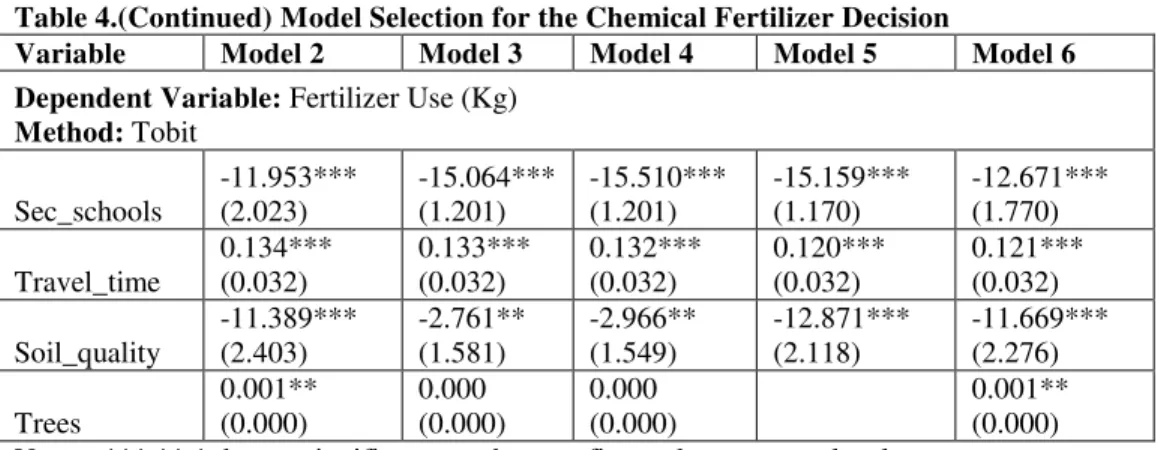
Table 4.(Continued) Model Selection for the Chemical Fertilizer Decision
Variable Model 2 Model 3 Model 4 Model 5 Model 6
Dependent Variable: Fertilizer Use (Kg) Method: Tobit
Sec_schools -11.953*** (2.023) -15.064*** (1.201) -15.510*** (1.201) -15.159*** (1.170) -12.671*** (1.770) Travel_time 0.134*** (0.032) 0.133*** (0.032) 0.132*** (0.032) 0.120*** (0.032) 0.121*** (0.032) Soil_quality -11.389*** (2.403) -2.761** (1.581) -2.966** (1.549) -12.871*** (2.118) -11.669*** (2.276) Trees 0.001** (0.000) 0.000 (0.000) 0.000 (0.000) 0.001** (0.000) Notes: ***,**,* denote significance at the one, five and ten percent level;
Standard errors are presented beneath the estimated coefficient in parenthesis.
1
For thorough evaluations of the project see 2009 report by the International Food Policy Research Institute (IFPRI) ―An impact evaluation of PSNP‖, and the 2008 report by the Institute of Development Studies (IDS): ―Ethiopia's PSNP, assessment report‖.
2
According to recent 2011 UN data, the average monthly income per capita in Ethiopia is equivalent to
$23—which roughly translates into $0.77 per day per person.
3
In 1993, a policy was brought stating that no able-bodied person should receive gratuitous relief. As a result, at least 80 percent of food aid resources in Ethiopia are committed to Public Works (PW) programs.
4
The standard concavity properties imply positive but decreasing marginal utility and positive but
diminishing returns to scale. That is, , , , , ,
, and .
5
For convenience of exposition, the model treats staple foods and purchased goods, as a single composite consumption good. Assuming a relatively large income share is devoted to the purchase of food goods by typical small-holder in developing countries, there is no loss of generality by imposing such condition.
6
When solved together, (5a) and (5b) imply that , which means that the marginal benefit
from consumption per dollar spent on consumption goods equals the marginal benefit from leisure per dollar given up. Subsequently,
. This implies that the marginal rate of substitution between
consumption and leisure equals the ration between the price of consumption goods and the forgone market salary per unit of labor.
7
5(c) and 5(d) imply
Implying that, at the optimal level of use, the marginal
benefit of production factors equals their marginal cost. Additionally, these equations imply
which means that the marginal rate of technical substitution equals the ratio of the inputs’
prices. 8
The Ethiopian Rural household Survey is a comprehensive survey conducted by the University of Addis Ababa and the Centre for the Study of African Economies in collaboration with the University of Oxford and the International Food Policy Research Institute. The purpose of the survey is collect periodic statistics on a comprehensive set of household characteristics to study the response of households to food crises. Up to 2013, there are 7 rounds of the survey conducted between 1989 and 2009. Dercon and Hoddinott (2011) describe survey and sampling methodology, definition of variables and measurement units, specific characteristics of surveyed populations and survey periods.
9
situated in the Amhara region, 22 % in the Oromia region, 11 percent in the Tigray region, and 44 % in the SNNP region.
10
In study we chose probit over logit estimation because unlike a logit model, which assumes the error terms to be distributed logistically, a probit model assumes the error term be distributed normally; furthermore, probit estimation does not impose the restrictive independence from irrelevant alternatives (IIA) assumption. In regards to the selection of the tobit model to fit the censored latent variable measuring fertilizer use, we also considered various specifications of Heckman and double-hurdle estimating techniques. The choice of which model to implement is largely dependent on practical matters and the adequacy of the models should be evident in the data. We examined the fitness of the models empirically and found no evidence that double-hurdle estimation was superior to a tobit
estimation—possibly in large part because of the small number of useable observations in our sample.
11
This method is preferable to computing the marginal effect of the average value of each regressor, particularly since some of the explanatory factors are themselves measured by binary variables. Computing the average marginal effect using the mean value of the explanatory variable would imply using values that are not observed anywhere in the data.
12
According to our results, receiving direct support assistance was associated with a 9 kg increase in fertilizer use, half of the estimated effect from a pure income transfer. In turn, participating in public works activities was related to a 1.8 kg increase in fertilizer use, a tenth of the predicted impact from pure income transfers.
13
In the literature, it has been hypothesized is possible that, for whatever reason, public works participants are using aid subsidized wages to sustain higher levels of consumption instead of using them to improve the productivity of their farms (Barrett et al., 2001; Holden et al., 2004). However, in our data we do not find systematic differences between public works participants and non-participants in household consumption decisions. Our results are consistent with previous evaluations of the Productive Safety Net Program (Berhane et al., 2011).
14
According to a World Bank assessment of the PSNP, in 2005 there were considerable delays with payment of transfers. By June 2005, half way through the first phase of the program, only 11 percent of transfers were completed. After considering the seriousness of the payment issue, it is not so surprising to find that public works participants increased their fertilizer use by only a tenth of what they would have had they been given their food wages worth in additional income. It appears that the availability of PSNP wages, or the lack of it, may help explain why public works participants are likely to increase their use of chemical fertilizer by much lower amounts than direct support beneficiaries. However, the role of payment volatility is an issue beyond the scope of our study.
15