ISSN 1546-9239
© 2009 Science Publications
Corresponding Author: Amer Badr Bin Merdhah, Faculty of Chemical and Natural Resources Engineering, University Technology Malaysia, 81310 Skudai, Johor, Malaysia
Scale Formation Due to Water Injection in Malaysian Sandstone Cores
Amer Badr Bin Merdhah and Abu Azam Mohd Yassin
Faculty of Chemical and Natural Resources Engineering,
University Technology Malaysia, 81310 Skudai, Johor, Malaysia
Abstract: Problem statement: Scale deposition is one of the most serious oil field problems that inflict water injection systems primarily when two incompatible waters are involved. Approach: This study was conducted to investigate the permeability reduction caused by deposition of calcium, strontium and barium sulphates in sandstone cores from mixing of injected Malaysian sea waters (Angsi and Barton) and formation water that contained high concentration of calcium, barium and strontium ions at various temperatures (60-90°C) and differential pressures (125-175 psig). The solubility of common oil field scales formed and how their solubilities were affected by changes in salinity and temperatures (40-90°C) were also studied. The morphology and particle size of scaling crystals formed as shown by Scanning Electron Microscopy (SEM) were also presented. Results: The results showed that a large extent of permeability damage caused by calcium, strontium and barium sulphates that deposited on the rock pore surface. The rock permeability decline indicates the influence of the concentration of calcium, barium and strontium ions. Conclusion: At higher temperatures, the deposition of CaSO4 and SrSO4 scales increases and the deposition of BaSO4 scale decreases since the solubilities of CaSO4 and SrSO4 scales decreases and thesolubility of BaSO4 increases with increasing temperature. The deposition of CaSO4, SrSO4 and BaSO4 scales during flow of injection waters into porous media was shown by Scanning Electron Microscopy (SEM) micrographs.
Key words: Scale deposition, scale solubility,scale concentration,temperature, pressure
INTRODUCTION
Secondary recovery is one of the activities used to improve oil recovery. There is several method used in secondary recovery. For example, water and gas flooding. The injection of water or gas into the oil-bearing reservoir is to increase the recovery factor and to maintain the reservoir pressure. In water flooding, the injected water will react with both the water already in the pore space of the rock (formation water) and with the mineral in the rock itself. This reaction will create scale formation. Sulphate scale may result from changes in temperature and/or pressure while water flow from one location to another, but the major cause of sulphate scaling is the chemical incompatibility between the injected water, with high concentration of sulphate ion and formation waters, with high concentrations of calcium, barium and strontium ions. Changes in temperature, pressure, pH and CO2/H2S partial pressure could contribute in forming a scale[1,2].Scale also can deposit when two incompatible waters are mixed and super-saturation is reached[3-8]. Field produced water (disposal water) can also be incompatible with seawater. In cases where disposal water is mixed with seawater for
re-injection, scale deposition is possible[9-13]. The objective of this study was to investigate permeability reduction by deposition of common oil field scales in porous media at various temperatures and concentrations and knowledge of solubility of common oil field scales formed and how their solubilities were affected by changes in salinity and temperature.
MATERIALS AND METHODS
The general purpose of the laboratory test was to investigate permeability reduction by deposition of calcium, strontium and barium sulphates in a porous medium and knowledge of solubility of calcium, strontium and barium sulphates and how their solubility are affected by changes in salinity and temperature.
Table 1: The ionic compositions of synthetic formation and injection waters
Normal salinity High salinity Normal barium High barium Barton Angsi
Ionic formation water (ppm) formation water (ppm) formation water (ppm) formation water (ppm) seawater (ppm) seawater (ppm)
Sodium 52,132 52,132 42,707 42,707 9,749.0 10,804.00
Potassium 1,967 1,967 1,972 1,972 340.0 375.00
Magnesium 4,260 4,260 102 102 1,060.0 1,295.00
Calcium 7,000 30,000 780 780 384.0 429.00
Strontium 500 1,100 370 370 5.4 6.60
Barium 10 10 250 2,200 <0.2 -
Chloride 99,653 146,385 66,706 67,713 17,218.0 19,307.00
Sulfate 108 108 5 5 2,960.0 2,750.00
Bicarbonate 350 350 2,140 2,140 136.0 159.00
Fig. 1: Schematic of the core flooding apparatus
Brines: The ionic compositions of synthetic formation water and water injection (Angsi and Barton seawaters) are given in Table 1. Note the formation water has calcium, strontium and barium ions and the sea water contains sulfate ions. It is clear that the mixing of these waters can lead to calcium, strontium and barium sulphates precipitation. Seven salts used for the preparation of synthetic formation water and water injections. The description of these salts is as follow:
• Sodium chloride grade (AR) NaCl (M.Wt. = 58.44 g mol−1, 99.8% purity) supplied by QReCTM • Potassium sulfate K2SO4 (M.Wt. = 174.25 g mol−1, 99% purity) supplied by BHD chemicals Ltd., Pool England
• Magnesium chloride MgCl2.6H2O (M.Wt. = 203.30 g mol−1, 98% purity) supplied by R and M chemicals
• Calcium chloride (dihydrate) grade (AR) CaCl2.2H2O (M.Wt. = 147.02 g mol−1, 78% purity) supplied by QReCTM
• Sodium bicarbonate NaHCO3 (M.Wt. = 84.01 g mol−1, 99.5% purity) supplied by GCE laboratory chemicals
• Strontium chloride (6-hydrate) SrCl2.6H2O (M.Wt. = 266.62 g mol−1, 99% purity) supplied by GCE laboratory chemicals
• Barium chloride (dihydrate) grade (AR) BaCl2.2H2O (M.Wt. = 244.28 g mol−1, 99% purity) supplied by QReCTM
Scaling test rig: Experiments were carried out using a test rig, which is schematically shown in Fig. 1. The core test equipment consists of five parts: Constant pressure pump, transfer cell, oven, pressure transducer and core holder. There follows a brief description of each part.
Constant pressure pump: Two Double-piston plunger
pumps manufactured by Lushyong Machiney Industry Limited, with 1.5 horse power motor, maximum design pressure of 35 bars and approximate flow rate of 20 L min−1 are used to inject the brines during flooding at different pressures. These pumps operate on pressure and hence the required pressure for the experiment is of 125-175 psig. The required pressure is set on the pump with the help of regulator. On opening the valve, the pump will deliver the set amount of pressure to the experimental rig and the extra fluid will be send back to the tank by the pump.
Transfer cell: Two Stainless steel transfer cells manufactured by TEMCO, Inc., USA which can withstand pressures up to 10,000 psia is used to store and pump the injected brine to the core holder. Each cell with a capacity of 1000 mL has a free-floating piston, which separates the pump fluid (distilled water) from the injection brine. The pump fluid is pumped into a transfer cell to displace the brine into the core.
Oven: During all flooding runs, the core holder is placed inside a temperature controlled oven.
Core holder: A Hassler type, stainless steel core holder designed for consolidated core samples, 3 inch length and 1 inch diameter, was used. The holder was manufactured by TEMCO, Inc., USA and could withstand pressures up to 10,000 psia. A rubber sleeved core holder, subjected to an external confining pressure, into which a sandstone core is placed.
Test procedures:
Beaker test: For each experiment of common oil field scales, 100 mL of each filtered opposite waters are heated in the oven at the test temperature and poured simultaneously into a beaker. This solution in beaker is heated on hot plate with continuous stirring by magnetic stirrer for 1 h. After this the solution is filtered through 0.45 µ m filter paper. After filtration, 5 mL of the filtrate is taken into a 50 mL volumetric flask and is diluted with distilled water to make up 50 mL of solution. This instantaneous dilution is performed in order to prevent CaSO4, SrSO4 and BaSO4 precipitation between filtering and analytical determination of the Ca, Ba and Sr concentration. The calcium, barium and strontium determinations are calibrated by measuring five standard solutions. Standard solutions are prepared from CaCl2, BaCl2 and SrCl2 solutions. Calcium, barium and strontium concentrations in the diluted filtrates are determined by Atomic Absorption Spectrometry. After multiplying with the dilution factor, the exact concentrations of calcium, barium and strontium are computed.
Core test:
Core saturation: Before each run, the core sample was dried in a Memmert Universal Oven at 100°C for overnight. The core sample was prepared for installation in the core-holder. A vacuum was drawn on the core sample for 5 h to remove all air from the core. The core was saturated with formation water at room temperature. The formation water is then injected by hand pump into the core-holder to saturate the core until the pressure reach 1400 psig. The system is left overnight to ensure 100% saturation.
Flooding experiment: As shown in Fig. 1, the system consisting of the core holder assembly with the saturated core sample and transfer cells containing the two incompatible waters (S.W and F.W) are placed inside the oven and heated to the desired temperature of the run. The system is left 3 h for temperature equilibrium to be attained. The required confining pressure is then adjusted to be approximately at double inlet pressure. A flooding run is started by setting both plunger pumps at the same pressure (ranging from 125-175 psig), then turning them
on. Thus, the two waters (S.W and F.W) are always injected into the core sample at a mixing ratio of 50:50. The inlet pressure is measured by pressure transducer while the outlet pressure is atmospheric pressure. During each run, the flow rate across the core is recorded continuously and the permeability of core is calculated using Darcy’s linear-flow equation before and after scale deposition. For selected runs, the core sample is removed at the end of flooding and cut into sections for Scanning Electron Microscopy (SEM).
RESULTS
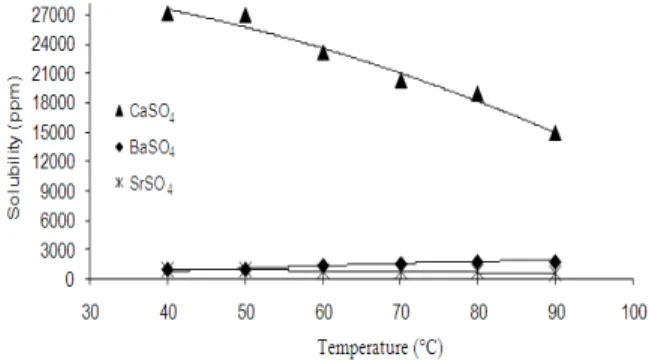
Beaker test: the calcium, strontium and barium concentrations in the diluted filtrates were determined by atomic absorption spectrometry. The solubility of CaSO4, SrSO4 and BaSO4 at various temperatures of this study were calculated. Graphical presentations are given in Fig. 2. The expected trend in this temperature range is a decrease in CaSO4 and SrSO4 solubilities, because the dissociation of CaSO4 and SrSO4 is exothermic reaction. But this phenomenal was different for the BaSO4. The solubility of BaSO4 increases with the increase of temperature due to its endothermic reaction. A graphical presentation of the experimental results is shown in Fig. 2. The experimental results confirm the general trend of solubility dependency for common oil field scales on temperature which is obvious and is similar to that observed in the earlier research[1,2,14-18].
Core test: The main objective of this part of the investigation is to study permeability reduction caused by common oil field scales deposition in porous media. The core-flood experiments were designed to investigate the effect of temperature (60-90°C), differential pressure (125-175 psig) and different concentrations of calcium, strontium and barium ions on the scaling tendency of brines see Table 1.
(a)
(b)
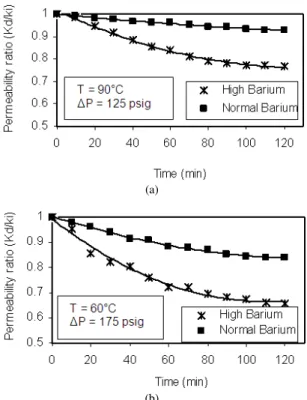
Fig. 3: Variation of permeability ratio vs. time at various concentrations (a): 60°C and 125 psig and (b): 90°C and 175 psig
In the following, extend of permeability damage, decline trend of permeability ratio and the results for various temperatures, concentrations and differential pressure are discussed.
Extend of permeability damage: Extend of
permeability loss caused by CaSO4, SrSO4 and BaSO4 scaling in the rock pores varied in different situations. Fig. 3a and 4a show the permeability change of a less damaged core at a differential pressure 125 psig and 60°C (Fig. 3a) and 90°C (Fig. 4a). Figure 3b and 4b show that of a severely damaged core after CaSO4, SrSO4 and BaSO4 scaling a differential pressure of 175 psig and 60°C (Fig. 4b) and 90°C (Fig. 3b). About 10.34-31.14% permeability loss was observed in Fig. 3, but more than 7.23-34.16% initial permeability reduction could occur in a heavily scaled core, as shown in Fig. 4. The reduction in permeability is possibly caused by crystals blocking the pore throats as shown later in the SEM view (Fig. 10 and 11). The amount of precipitation varied within the sandstone cores, there being more scale near the formation water inlets and least scale was observed furthest from the inlet parts.
(a)
(b)
Fig. 4: Variation of permeability ratio vs. time at various concentrations (a): 90°C and 125 psig and (b): 60°C and 175 psig
Decline trend of permeability ratio: Figure 5-8 show the Permeability decline trend changes with brine- injection time. During the initial flow period, the permeability declined sharply soon after the two waters mixed in the pores. The permeability decline then slowed and gradually leveled out after the permeability decreased greatly. This phenomenon was observed in all the core tests in which the scaling damage was severe.
(a)
(b)
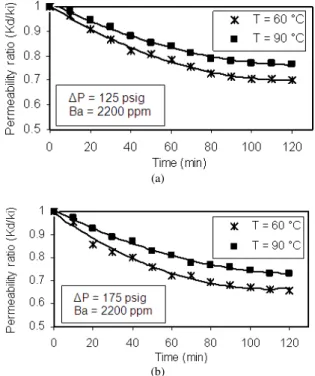
Fig. 5: Variation of permeability ratio Vs time at various temperatures. (a): 125 psig and (b): 175 psig
Figure 6 shows the variation of permeability reduction with time at different temperatures. It also shows the effect of temperature on permeability reduction as temperature rises, the rate of nucleation and crystal growth and plugging were decreased. The permeability decline is less rapid at higher temperature, since the rate of BaSO4 precipitation decrease with temperature. This is because the solubility of BaSO4 increases with temperature.
Effect of differential pressure: To investigate the effect of differential pressure on flow rate and permeability reduction a number of tests were carried out. In these experiments, the concentration of brine and temperature were kept constant and differential pressure varied from 125-175 psig. The variation of permeability reduction with time at different differential pressures is show in Fig. 7 and 8. From Fig. 7 and 8, the permeability decline of porous medium is evident, even at such low differential pressures. The results illustrate that at low differential pressure, scale formation has already as significant effect on the permeability decline.
(a)
(b)
Fig. 6: Variation of permeability ratio Vs time at various temperatures (a): 125 psig and (b): 175 psig
(a)
(b)
(a)
(b)
Fig. 8: Variation of permeability ratio vs. time at various differential pressures (a): 60°C and (b): 90°C
Fig. 9: SEM image of an unscaled sandstone core
As, the differential pressure was increased, the rate of permeability decline becomes more rapid. Moreover, at higher differential pressure more sulfate ions will pass through the porous medium in a given interval of time. The super-saturation at the porous medium will therefore increase the rate of precipitation. This increased precipitation rate will produce a larger permeability decline. These results agreed with result by reported by[6,7,19,20].
Figure 3 and 4 show the variation in permeability decline with time for different concentrations of calcium, strontium and barium ions. When the concentration of brine (i.e., super-saturation) is increasing, plugging and hence permeability loss occurs more rapidly.
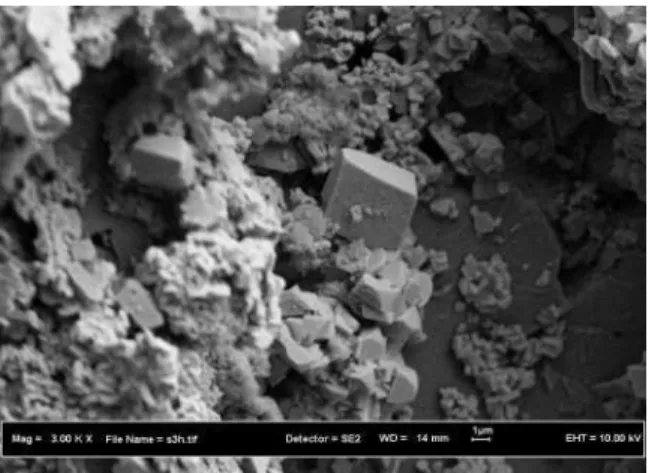
Fig. 10: SEM image of CaSO4 and SrSO4scales in sandstone cores
Fig. 11: SEM image of BaSO4 scale in sandstone core
The permeability decline due to high concentration of calcium, strontium and barium is greater than for normal concentration of calcium, strontium and barium ions, for given experimental conditions.
irregularity of the crystals formed in the rock pores and the crystal size variations from one location to another in a core.
In general, Fig. 10 and 11 shows that the front sections of a core suffered considerable greater scaling damage. The reason the scaling decreased downstream of a core is clear most of the scaling ions had deposited within the front sections as soon as they were mixed and left few ions to precipitate from the flow stream in the rear sections. The observations of scaling sites from previous tests [6,19] were confirmed by this test results. Figure 9 shows a SEM image of an un-scaled core samples.
DISCUSSION
The sulfate ion content in the sea water brine reacts with the barium ions in the formation water instantaneously but it reacts with both calcium and strontium ions only with heating. The more precipitation of CaSO4, SrSO4 and BaSO4 results from the presence of a large concentration of calcium, strontium and barium ions as compare to less precipitation at normal con-centrations of calcium, strontium and barium ions.
During each run, the flow rate across the core was recorded continuously and the permeability of core was calculated using Darcy’s linear flow equation. The flow rate decreased during the experiments only when a super-saturated solution was flowing through the cores. This confirms that the decrease of flow rate is due to precipitation of the calcium, strontium and barium sulfates inside the core with the consequent reduction in its permeability and porosity. At higher temperatures, the rate of CaSO4 and SrSO4 precipitations increase and the rate of BaSO4 precipitation decreases since the solubilities of CaSO4 and SrSO4 scales decrease and the solubility of BaSO4 increases with increasing temperature. In all core tests, the abundance of scale reduced significantly from the front of the core to the rear indicating that scale formation in porous media was rapid with the observation that the flow rate decreased soon after two incompatible waters were mixed into a core.
CONCLUSION
• The experimental results confirm the general trend in solubility dependencies for common oil field scales, determined at various temperatures. A temperature rise from 40-90°C causes an increase in BaSO4 solubility and a decrease of CaSO4 and SrSO4 solubilities
• Permeability decline caused byCaSO4,SrSO4 and BaSO4 scale formation in the porous media ranged from 7.23-34.16% of the initial permeability, depending on brine composition, initial permeability, temperature, differential pressure and brine injection period
• CaSO4, SrSO4 and BaSO4 precipitates did not plug the sandstone cores to the same extent. The experiments with CaSO4 and SrSO4 precipitates produced a 10.34-31.14% reduction in initial permeability. The experiments with BaSO4 precipitate produced a 7.23-34.16% reduction in initial permeability
• The pattern of permeability decline in a porous medium due to scaling injection was characterized by a concave curve with a steep initial decline which gradually slowed down to a lower. The initial steepness of these curves generally decreased with increasing distance from the point of mixing of the incompatible brines. The concave shape of the permeability-time curves was common to the majority of the porous medium flow tests • The formation of CaSO4and SrSO4 during flow of
injection and formation waters in porous media have been proved by Scanning Electron Microscopy (SEM) micrographs show CaSO4and SrSO4 crystals formation in porous space
ACKNOWLEDGMENT
The researchers would like to thank the University Technology Malaysia and Mosti for paid fees to publish this study.
REFERENCES
1. Mackay, J.E., 2003. Modeling in situ scale deposition: The impact of reservoir and well geometries and kinetic reaction rates. SPE Prod.
Facilit., 18: 45-56.
http://cat.inist.fr/?aModele=afficheN&cpsidt=14543181 2. Moghadasi, J., M. Jamialahmadi, H.
Muller-Steinhagen, A. Sharif, A. Ghalambor, R.M. Izadpanah and E. Motaie, 2003. Scale formation in iranian oil reservoir and production equipment during water injection. Proceeding of the 5th International Oilfield Scale Symposium and Exhibition, Jan. 29-30, SPE., Aberdeen, UK., pp: 1-12.
4. Read, A.P. and K.J. Ringen, 1982. The use of laboratory tests to evaluate scaling problems during water injection. Proceedings of the SPE 6th International Symposium on Oilfield and Geothermal Chemistry, Jan. 25-27, Dallas, Texas,
SPE10593, pp: 1-17.
https://www.lenep.uenf.br/~bueno/DisciplinaAI/Au las/materialExtra/00010593.pdf
5. Vetter, J.O., V. Kandarpa and A. Harouaka, 1982. Prediction of scale problems due to injection of incompatible waters. J. Petroleum Technol., 34: 273-284.
http://www.osti.gov/energycitations/product.biblio. jsp?osti_id=5312369
6. Todd, C.A. and D.M. Yuan, 1992. Barium and strontium sulfate solid-solution scale formation at elevated temperatures. SPE. Prod. Eng., 7: 85-92. http://cat.inist.fr/?aModele=afficheN&cpsidt=5077691 7. Moghadasi, J., Jamialahmadi, H.
Muller-Steinhagen and A. Sharif, 2003. Scale formation in oil reservoir and production equipment during water injection (kinetics of CaSO4and CaCO3 crystal growth and effect on formation damage). Proceeding of the SPE European Formation Damage Conference, May 13-14, SPE 82233, Hague, Netherlands, pp: 1-12. DOI: 10.2118/82233-MS
8. Moghadasi, J., M. Jamialahmadi, H. Muller-Steinhagen and A. Sharif, 2004. Formation damage due to scale formation in porous media resulting from water injection. Proceeding of the SPE International Symposium and Exhibition on Formation Damage Control, Feb. 18-20, SPE 86524, Lafayette, Louisiana, pp: 1-11. DOI: 10.2118/86524-MS
9. Bayona, G.H., 1993. A review of well injectivity performance in Saudi Arabia’s ghawar field seawater injection program. Proceeding of the SPE Middle East Oil Technical Conference and Exhibition, Apr. 3-6, SPE 25531, Bahrain, pp: 201-214. DOI: 10.2118/25531-MS
10. Andersen, I.K., E. Halvorsen, T. Saelensminde and O.N. Ostbye, 2000. Water management in a closed loop-problems and solutions at brage field. Proceeding of the SPE European Petroleum Conference, Oct. 24-25, SPE 65162, Paris, France, pp: 1-12.
11. Bedrikovistsky, P., D. Marchesin, F. Shecaira, L.A. Serra, A. Marchesin, E. Reszende and G. Hime, 2001. Well impairment during sea/produced water flooding: Treatment of laboratory data. Proceeding of the SPE Latin American and Caribbean Petroleum Engineering Conference, Mar. 25-28, SPE 69546, Buenos Aires, Argentina, pp: 1-9. DOI:10.2118/69546-MS
12. Stalker, R., R.I. Collins and M.G. Graham, 2003. The impact of chemical incompabilities in commingled fluids on the efficiency of a produced water reinjection system: A north sea example. Proceeding of the SPE International Symposium on Oilfield Chemistry, Feb. 5-7, SPE 80257, Houston, Texas, pp: 1-13.
13. Paulo, J., J.E. Mackay, N. Menzies and N. Poynton, 2001. Implications of brine mixing in the reservoir for scale management in the alba field. Proceeding of the 2001 SPE International Symposium on Oilfield Scale,Jan. 30-31, SPE 68310, Aberdeen, UK., pp: 1-13. DOI:10.2118/68310-MS
14. Lindlof, C.J. and G.K. Stoffer, 1983. A case study of sea water injection incompatibility. J. Petroleum
Technol., 35: 1256-1262.
http://www.osti.gov/energycitations/product.biblio. jsp?osti_id=5467570
15. Jacques, F.D. and I.B. Bourland, 1983. A study solubility of strontium sulfate. Soc. Petroleum Eng. J., 23: 292-300. DOI:10.2118/9625-PA
16. Oddo, E.J., P.J. Smith and B.M. Tomason, 1991. Analysis of and solutions to the CaCO3 and CaSO4 scaling problems encountered in wells offshore Indonesia. Proceeding of the 66th Annual Technical Conference and Exhibition of the Society of Petroleum Engineering, Oct. 6-9, SPE 22782, Dallas, TX., pp: 1-10.
17. Rousseau, G., C. Hurtevent, M. Azaroual, C. Kervevan and V. M Durance, 2003. Application of a thermo-kinetic model to the prediction of scale in angola block 3 field. Proceeding of the 5th International Oilfield Scale Symposium, Jan. 29-30, SPE 80387, Aberdeen, UK., pp: 1-8. DOI: 10.2118/80387-MS 18. Mackay, J.E. and M.M. Jordan, 2005. Impact of
brine flow and mixing in the reservoir on scale control risk assessment and subsurface treatment options': Case histories. J. Energy Resour.
Technol., 127: 201-213.
http://cat.inist.fr/?aModele=afficheN&cpsidt=1713 0147
19. Todd, C.A. and D.M. Yuan, 1990. Barium and strontium sulfate solid-solution formation in relation to north sea scaling problems. SPE. Prod.
Eng., 5: 279-285.
http://www.osti.gov/energycitations/product.biblio. jsp?osti_id=6575350