* Corresponding author: E-mail: [email protected]
Received: August 28, 2017 Approved: January 11, 2018
How to cite: Gubiani PI, Müller EA, Somavilla A, Zwirtes AL, Mulazzani RP, Marchesan E. Transpiration reduction factor and soybean yield in low land soil with ridge and chiseling. Rev Bras Cienc Solo. 2018;42:e0170282. https://doi.org/10.1590/18069657rbcs20170282
Copyright: This is an open-access article distributed under the terms of the Creative Commons Attribution License, which permits unrestricted use, distribution, and reproduction in any medium, provided that the original author and source are credited.
Division - Soil Processes and Properties | Commission - Soil Physics
Transpiration Reduction Factor and
Soybean Yield in Low Land Soil with
Ridge and Chiseling
Paulo Ivonir Gubiani(1)*
, Eduardo Augusto Müller(1)
, André Somavilla(1) , Anderson Luiz Zwirtes(2)
, Rodrigo Pivoto Mulazzani(1)
and Enio Marchesan(3)
(1)
Universidade Federal de Santa Maria, Centro de Ciências Rurais, Departamento de Solos, Santa Maria, Rio Grande do Sul, Brasil.
(2)
Instituto Federal Santa Catarina, Área de Recursos Naturais-Produção Vegetal, Campus São Miguel do Oeste, Santa Catarina, Brasil.
(3)
Universidade Federal de Santa Maria, Centro de Ciências Rurais, Departamento de Fitotecnia, Campus
Camobi, Santa Maria, Rio Grande do Sul, Brasil.
ABSTRACT: Water and oxygen deficiencies in the soybean crop cultivated on lowland
soils are an important topic of research. The objective of this study was to investigate changes in water and oxygen supply and soybean yield caused by soil management in lowland soils. A soybean crop was grown under four soil conditions: no-tillage (NT), chiseling (CH), ridge tillage on no-tillage (NTR), and ridge tillage on chiseling (CHR). Soil bulk density, total porosity, macro- and microporosity, air permeability, and saturated hydraulic conductivity were measured at 0.05, 0.15, 0.25, and 0.35 m depths. Soil volumetric water content was monitored at the same depths every 30 min during the
soybean cycle. The transpiration coefficient was calculated from volumetric water content to express both water and oxygen deficiency. The groundwater level was monitored
throughout the soybean cycle. Plant performance was evaluated by measuring plant population, shoot dry matter, yield, and taproot depth. Soil porosity, air permeability, and saturated hydraulic conductivity were most improved in CH and CHR, and less in NTR. Nonetheless, expected improvement in soil aeration in CH, CHR, and NTR was eliminated when the water table raised to near the soil surface. The transpiration
coefficient indicated that CH decreased oxygen deficiency, but caused little water deficit.
The CH also provided the highest yield (4,610 kg ha-1), which was not surpassed by the addition of ridge tillage on chiseled soil (CHR) (4,001 kg ha-1). The lowest yields were
observed in NT (2,842 kg ha-1), and NTR (3,565 kg ha-1), in which oxygen deficiency was
more severe. Lower oxygen deficiency for soybean in chiseled lowland soil is regulated by the water table. As the transpiration coefficient is dependent on all the processes
determining soil water dynamics, it is more informative than soil structural properties
regarding water and oxygen deficiency in soybean in lowland soil.
INTRODUCTION
In the vast plains areas of the South of Brazil, soils undergo continuous or periodic water
saturation, exhibiting redoximorphic features mainly in flat landscape locations. Both deficient drainage and flat relief make soil suitable for irrigated rice (Oryza sativa L.). Around 1.1 million hectares of rice are cultivated annually in Rio Grande do Sul (Conab, 2017). The necessity of crop rotation to reduce pests, diseases, and weeds in rice areas (Gomes et al., 2002) has motivated rice farmers to introduce soybean cultivation in
floodplain areas. However, the flood plain condition desirable for rice may not be adequate
for soybean cultivation (Sartori et al., 2016b).
In wetland soils, soybean plants are subjected to oxygen deficiency (OD) and to water deficiency (WD). Oxygen deficiency is predominant, as it is common to find the water table close to the soil surface (Fiorin et al., 2003), and the soil floods with abundant
rainfall. In addition, the low water permeability of the B horizon in the subsurface (due to the presence of expansive clays) reduces drainage and extends OD over time. When the water table goes down, WD can occur because the amount of water available in the A and E (when present) sandy horizon does not ensure water supply for a long time.
The use of flood-tolerant soybean genotypes (Schöffel et al., 2001; Pires et al., 2002;
VanToai et al., 2010) does not prevent yield declines if excessive rainfall occurs (VanToai et al., 1994; Cornelious et al., 2006). The occurrence of OD at several phenological stages
reduces soybean yield (Schöffel et al., 2001). Germination is a critical period, as well as
crop establishment, as OD reduces the plant population (Wuebker et al., 2001). During this period, WD is also harmful, since it hinders emergence and crop establishment
(Tavares et al., 2013). In later stages, WD causes flower abortion and affects grain weight
(Mundstock and Thomas, 2005).
The presence of a compact soil layer detected at the 0.07-0.10 m (Munareto et al., 2010) and 0.10-0.20 m (Sartori et al., 2015; Sartori et al., 2016b) is another problem for those intending to rotate crops in lowland areas cultivated with irrigated rice. The
presence of this less permeable layer intensifies OD by keeping the soil moist during rainfall periods and intensifies WD by confining the roots in the surface layer of the soil,
which increases the risk of water stress during periods of low rainfall. To reduce the risk of soybean yield loss in lowland soils, tolerant cultivars, the seeding period, and soil management strategies must be selected in a combined manner to minimize stress. The
effectiveness of these actions, however, depends on rainfall, which controls the water
table (Ronen et al., 2000; Gomes et al., 2012), the key factor in the occurrence of OD.
Several studies indicate that chiseling (Sartori et al., 2015; Sartori et al., 2016b) and the use
of ridge tillage are effective management strategies in lowland soils for increasing soybean yield (Silva et al., 2007). Chiseling favors internal drainage of the profile (Sartori et al., 2016a),
whereas the ridge promotes a more aerated zone, which is also elevated in relation to the groundwater level (Sartori et al., 2015). Studies have not yet evaluated the combination of these two approaches. The expectation is that together they can provide greater aeration in the root zone of plants, though intensify water stress during periods of drought.
Quantification of OD and WD in soybean cultivation in floodplain areas is a relative
unexplored issue but can be evaluated based on an approach involving physical properties
that directly affect crop growth and production (Letey, 1985). In the case of OD and WD,
the dynamics of oxygen consumption and water uptake rates are the processes of interest (van Lier and Gubiani, 2015). Measuring these processes throughout the plant cycle is
not always possible, due to lack of equipment. Modeling them is also a difficult task as it requires a large set of parameters and variables of the soil-plant-atmosphere system.
For these reasons, indexes related to these processes are often used (Gubiani et al.,
2013a). The transpiration reduction factor (λ), which represents the relationship between
OD and WD. The reduction function proposed by Feddes et al. (1978) has often been
used for estimating λ in hydrological models, such as HYDRUS-1D (Šimůnek and van Genuchten, 2008), and has also been compared with new approaches of calculating λ using matric flux potential (van Lier et al., 2008; Casaroli et al., 2010). Although estimation of λ using the matric flux potential seems more accurate (van Lier et al., 2008; Casaroli et al., 2010), calculation of λ with the Feddes function remains much simpler. Thus, the Feddes function is a simple and useful proposition for relative evaluation of the effect of soil management on λ dynamics.
In this study, λ dynamics were determined in lowland soil cultivated with soybean under
no-tillage, chiseling, ridge tillage on no-tillage, and ridge tillage on chiseling. Our hypothesis
is that λ is better than soil physical properties for predicting soybean performance in lowland soil. The objective of this study was to evaluate the effect of soil conditions on soil physical properties and λ; and to relate them with soybean performance.
MATERIALS AND METHODS
The study was carried out in an experimental area of the Federal University of Santa Maria, located in the Central Depression region of Rio Grande do Sul, Brazil (-29.72 S, -53.72 W).
The soil was classified as an Albaqualf (Soil Survey Staff, 2014) and as a Planossolo Háplico Eutrófico típico according to the Brazilian Soil Classification System (Santos et al., 2013).
The soil up to the 0.40 m depth, expressed in g kg-1, is composed of (mean ± standard deviation) 196 ± 32 of sand, 570 ± 17 of silt, and 235 ± 17 of clay. Climate in the region
is “Cfa” type according to the Köppen climate classification system (Peel et al., 2007).
In the spring of 2013, the experimental area was cultivated with irrigated rice in a minimum tillage system. In April and May 2014, the remaining crop residue was incorporated with
a knife roller. Subsequently, 1 Mg ha-1 of dolomitic limestone was incorporated into the
0.00-0.15 m soil layer with a disk harrow. The roughness of the soil surface caused by harrowing was reduced with a leveling blade. During May to August, the area remained in fallow, occupied mainly by Azevém (Lolium multiflorum).
In August 2014, vegetation was desiccated with glyphosate herbicide for soybean cultivation in four soil conditions: no-tillage (NT), chiseling (CH), ridge tillage on no-tillage (NTR), and ridge tillage on chiseling (CHR). These soil conditions were randomized into plots (6 × 8 m) distributed in four blocks, covering an area of 768 m2 under this
specific experiment.
For the CH and CHR treatments, the soil was prepared on October 10, 2014, with a
chisel plow (five shanks spaced 0.5 m apart), operating at a 0.35 m depth, followed by
a disk harrow to break up the mobilized soil blocks. For the NTR and CHR treatments, the ridges were made by the same machine used for sowing the soybean (Hyper Plus KF 6/4, manufactured by Industrial KF). This planter forms a triangular shaped ridge with approximately a 0.85 m base and 0.12 m height.
Soybean was sown on November 14, 2014, with 15 seeds m-1 in rows spaced 0.5 m apart.
The seed rows were positioned on the faces of the ridge in the ridge treatments. The cultivar Brasmax Tornado RR (6863 RSF) was used, due to its resistance to root rot and stem canker
and its good performance in floodplain soils. The seeds received insecticide containing the
mixture Piraclostrobin + methyl thiophanate + Fipronile and the micronutrients molybdenum and cobalt. Since the area had not been cultivated with soybean before and because of
the low survival rate of rhizobia in the soil in lowland areas due to flooding (Thomas et al.,
2005; Bailey-Serres et al., 2012), twice the recommended rate of inoculant was applied to the seeds to introduce a suitable population of rhizobia. Fertilizer containing percentages of 4-27-17 of N, P2O5, and K2O, respectively, was applied at a rate of 330 kg ha
-1, in accordance
and phytosanitary controls followed the technical recommendations for the soybean crop for the state of Rio Grande do Sul (Costamilan et al., 2012).
The plant population was evaluated 30 days after sowing (DAS) by counting the plants growing in a distance of two meters from two randomly chosen rows in each
plot. Shoot dry matter was quantified according to Fehr and Caviness (1977) in plants
collected over an area of 1 m2 at the R3 phenological stage. The plants were cut and
oven dried at 65 °C and, subsequently, dry matter was determined. Grain yield was
determined by harvesting the four central rows of each plot (20 m2). The plants were
harvested manually and their pods were mechanically threshed. To estimate the grain yield (kg ha-1), the weight of the harvested beans was adjusted for grain moisture of
13 %. The depth reached by the taproot was measured with a measuring tape after
digging a pit close to soybean plants and exposing the roots in the soil profile at the
R3 phenological stage.
Twelve days after soybean sowing (11/26/2014), at the V1 phenological stage, and seventy days after sowing (02/4/2015), at the R2 phenological stage, soil samples were collected between rows using metal rings with a 0.057 m diameter and 0.04 m height. The soil samples were collected in duplicate at the center of the 0.00-0.10, 0.10-0.20, 0.20-0.30, and 0.30-0.40 m layers. The samples were saturated by capillary rise and subjected to tensions (h) of 0.1, 0.6, and 1 m in a sand column (Reinert and Reichert, 2006), and 3.3 and 10 m in Richards chambers (Klute, 1986). At saturation and after drainage ceased at each tension, the samples were weighed for determination of
volumetric water content (θ). Soil air permeability (Ka) was determined at tensions of
0.6, 1, 3.3, and 10 m using a constant head permeameter, as described in Mentges et al. (2016). At the end of the 10 m tension, the samples were resaturated for determination of saturated hydraulic conductivity (Ks) using a constant head permeameter as described by Libardi (2005). After determination of Ks, the samples were oven dried at 105 °C for 48 h to determine soil bulk density (Bd). Water retention between the tensions of
50 and 1000 m was obtained by the psychometric technique using a WP4 (Decagon
Devices, 2000), as described in Gubiani et al. (2013b).
The equation 1, proposed by van Genuchten (1980), was fitted to the h and θ data:
θ = θ
r+
θ
s- θ
r1 + (αh)
n m Eq. 1in which θ, θs, and θr are the estimated, saturated, and residual volumetric water contents
(m3 m-3
), respectively; h is the tension applied during drainage of the samples (m); α (m-1),
m, and n are fitting coefficients of the equation, where m = 1 - (1/n). Equation 1 was fitted using the Solver Add-In available on Microsoft Office Excel.
Total porosity (Tp) was considered as the θ at saturation; microporosity (Mi) was considered as the θ at a tension of 0.6 m; and macroporosity (Ma) was calculated by the difference
between Tp and Mi.
Time Domain Reflectometry (TDR) probes (two 0.19 m metal strips) were inserted in the center of each soil layer described above to monitor θ every 30 min. The probes were connected to a TDR100 controlled by a CR1000 datalogger (both from Campbell Scientific, Inc.). The dielectric constant (ε) measured by TDR100 was converted to θ by the calibration equation suggested by Topp et al. (1980). From various samples collected at different soil moisture conditions, it was verified that no specific calibration was necessary, because the θ estimated was very close to the measured θ (maximum 0.05 m3 m-3 for the absolute
λ(θ) =
λOD =
λ = 1 θ1 - θi
θ2 < θi ≤ θ1
θ3 ≤ θi ≤ θ2
θ4 ≤ θi < θ3 θ1 - θ2
λWD = θi - θ4 θ3 - θ4
Eq. 2
in which λOD and λWD quantify the OD and WD stress, respectively; and θi is the soil water
content at each instant of measurement, θ1 = θs (θ at saturation), θ2 = θs - 0.1 (θ for
10 % aeration porosity), θ3 = θc (θ critical for water stress, assumed as the θ at a tension
of 30 m), and θ4 = θpmp (θ at permanent wilting point). The values of θc and θpmp were
calculated using equation 1 adjusted to the experimental data of each treatment, layer, and period of soil sampling. All these parameters were specific from both treatment and soil layer. The parameters λOD and λWD vary linearly from zero (maximum stress, growth
stopped) to one (1) (no stress). The θ2 and θ3 indicate the water conditions that start
the stress induced by OD and WD, respectively. For each treatment and soil layer, the
frequency of the λOD ≤0.5, 0.5< λOD <1, λ = 1, λWD ≤0.5, and 0.5< λWD <1 classes was
calculated considering all measures of θ done with the TDR.
Water table depth (Z) was monitored in six vertical holes drilled one meter away from the TDR probes, similar to those described by Cruciani (1987). After drilling the soil with an auger, a 50 mm diameter PVC pipe that was laterally perforated and coated with a
Bidim drainage filter was inserted and fixed laterally in the soil with sand to prevent soil
obstruction. The pipes were covered with a removable PVC cap to prevent external water
input. The groundwater depth was measured on the days of rainfall and on the first and
fourth days after rainfall. When no new rainfalls occurred, weekly measurements were
taken. To measure Z, a thin floating graduated metal rod (3 mm diameter) with a Styrofoam
base on the bottom end was inserted in the PVC pipe at each measurement time.
For statistical analyses, normal distribution analysis of data was preformatted using the Shapiro-Wilk test. When normal distribution was rejected, the data were subjected
to logarithmic transformation. For each layer, the effect of soil treatments on soil and plant variables was evaluated by analysis of variance. When the F test was significant, the Tukey test was applied to detect mean differences.
RESULTS AND DICUSSION
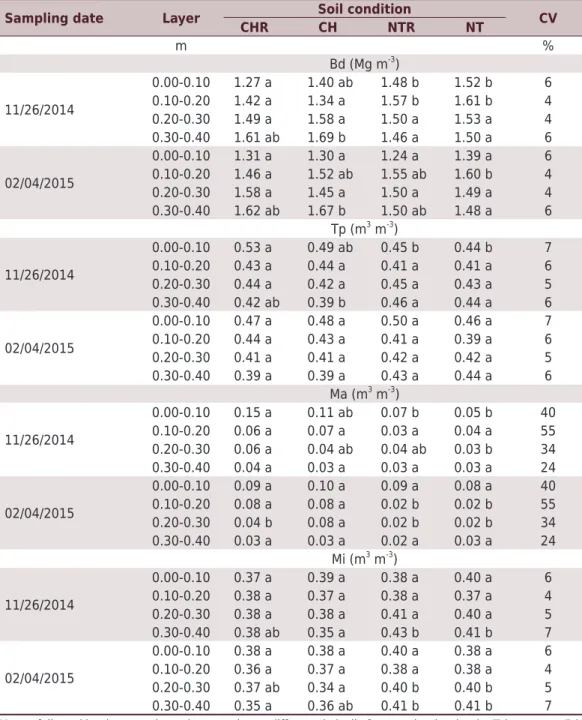
At 12 days after sowing (11/26/2014), Bd (0.00-0.10 m) was lower, Tp (0.00-0.10 m) and
Ma (0.00-0.10 and 0.20-0.30 m) were higher for the CHR, which did not differ for the
CH (Table 1). At 70 days after sowing (02/04/2015), Bd was lower and Ma was higher in
CHR, but only in the 0.10-0.20 m layer, also with no difference for CH. The absence of differences in the first layer 70 days after sowing indicates that rainfall (Figure 1) caused soil
reconsolidation, which commonly occurs in a period of less than a year, even in highland clayey soils (Drescher et al., 2016). Although reduction in the initial degree of compaction
from chiseling remained for a short period, its effect on the transpiration reduction factor
was more noticeable, as will be discussed later. It is also important to note how little the chisel plow changed the soil structure below 0.20 m. Increased Bd and Mi and reduction in Tp and Ma were detected in the 0.30-0.40 m layer (Table 1). Compaction next to the lower limit of the chisel plow shank is still a controversial issue (Mentges et al., 2010; Rosa et al., 2011). In soil with high plasticity, the chisel plow shank compresses aggregates and may increase soil bulk density (Rosa et al., 2008). As the moisture was high in the 0.30-0.40 m
layer (typical in lowland soils with some flooding occurrence), the chisel plow shank only
created a slit, compacting the area beside it, as the soil behaved like a plastic material.
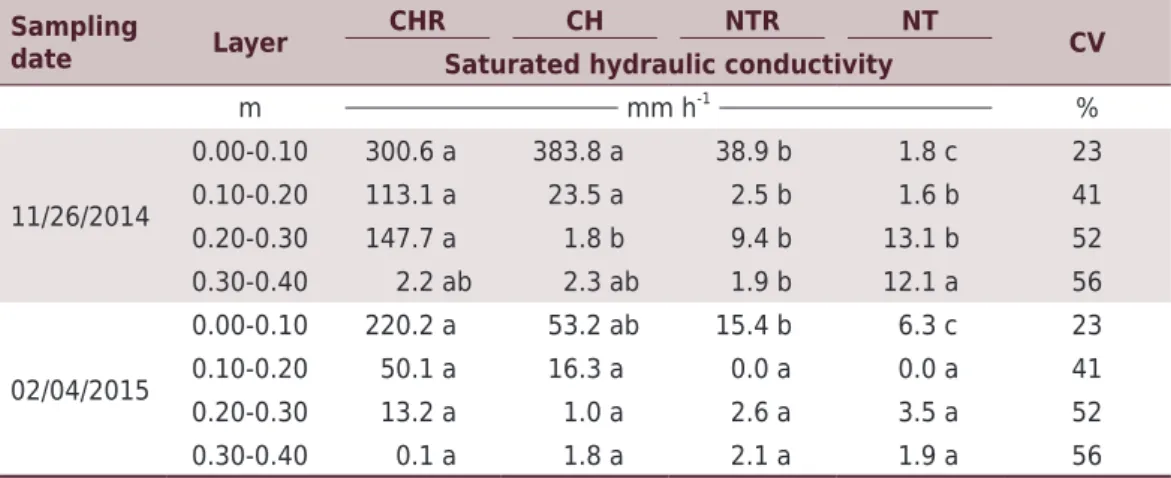
Furthermore, at 12 days after sowing, the values of Ks were higher in CHR and CH in the 0.00-0.10 m layer (Table 2), and Ka was also higher in CH and CHR in the 0.00-0.10 m layer
away. In general, the differences noted for Ks and Ka are properly associated with changes in porosity (Table 1), i.e., the higher the Tp and the Ma, the higher the Ks (Mesquita and Moraes,
2004; Prevedello et al., 2013) and the Ka (Rodrigues et al., 2011; Prevedello et al., 2013).
The positive relation of Ka with water tension at 12 days after sowing was stronger in CHR and CH than in NTR and NT (Table 3). A greater number of large pores present in CHR and CH (Table 1) allowed tension to drain a considerable volume of the total porosity, favoring
the flux of gases. These results are in agreement with the positive relationship between
Ka and the pores with an apparent diameter greater than 300 micrometers (Prevedello et al., 2013) and porosity free of water (Rodrigues et al., 2011). The Ka and Ks indicate that
CHR and CH may have decreased the frequency and the duration of the flooding and of the oxygen deficiency for soybean cultivation in the first two layers. However, excess rainfall, and the consequent rise in groundwater levels can override these potential benefits of chisel
plowing, which can not be known by measuring only Ka and Ks.
Table 1. Soil bulk density and porosity in different layers of each soil condition
Sampling date Layer Soil condition CV
CHR CH NTR NT
m %
Bd (Mg m-3 )
11/26/2014
0.00-0.10 1.27 a 1.40 ab 1.48 b 1.52 b 6 0.10-0.20 1.42 a 1.34 a 1.57 b 1.61 b 4 0.20-0.30 1.49 a 1.58 a 1.50 a 1.53 a 4 0.30-0.40 1.61 ab 1.69 b 1.46 a 1.50 a 6
02/04/2015
0.00-0.10 1.31 a 1.30 a 1.24 a 1.39 a 6 0.10-0.20 1.46 a 1.52 ab 1.55 ab 1.60 b 4 0.20-0.30 1.58 a 1.45 a 1.50 a 1.49 a 4 0.30-0.40 1.62 ab 1.67 b 1.50 ab 1.48 a 6
Tp (m3 m-3
)
11/26/2014
0.00-0.10 0.53 a 0.49 ab 0.45 b 0.44 b 7 0.10-0.20 0.43 a 0.44 a 0.41 a 0.41 a 6 0.20-0.30 0.44 a 0.42 a 0.45 a 0.43 a 5 0.30-0.40 0.42 ab 0.39 b 0.46 a 0.44 a 6
02/04/2015
0.00-0.10 0.47 a 0.48 a 0.50 a 0.46 a 7 0.10-0.20 0.44 a 0.43 a 0.41 a 0.39 a 6 0.20-0.30 0.41 a 0.41 a 0.42 a 0.42 a 5 0.30-0.40 0.39 a 0.39 a 0.43 a 0.44 a 6
Ma (m3 m-3
)
11/26/2014
0.00-0.10 0.15 a 0.11 ab 0.07 b 0.05 b 40 0.10-0.20 0.06 a 0.07 a 0.03 a 0.04 a 55 0.20-0.30 0.06 a 0.04 ab 0.04 ab 0.03 b 34 0.30-0.40 0.04 a 0.03 a 0.03 a 0.03 a 24
02/04/2015
0.00-0.10 0.09 a 0.10 a 0.09 a 0.08 a 40 0.10-0.20 0.08 a 0.08 a 0.02 b 0.02 b 55 0.20-0.30 0.04 b 0.08 a 0.02 b 0.02 b 34 0.30-0.40 0.03 a 0.03 a 0.02 a 0.03 a 24
Mi (m3 m-3
)
11/26/2014
0.00-0.10 0.37 a 0.39 a 0.38 a 0.40 a 6 0.10-0.20 0.38 a 0.37 a 0.38 a 0.37 a 4 0.20-0.30 0.38 a 0.38 a 0.41 a 0.40 a 5 0.30-0.40 0.38 ab 0.35 a 0.43 b 0.41 b 7
02/04/2015
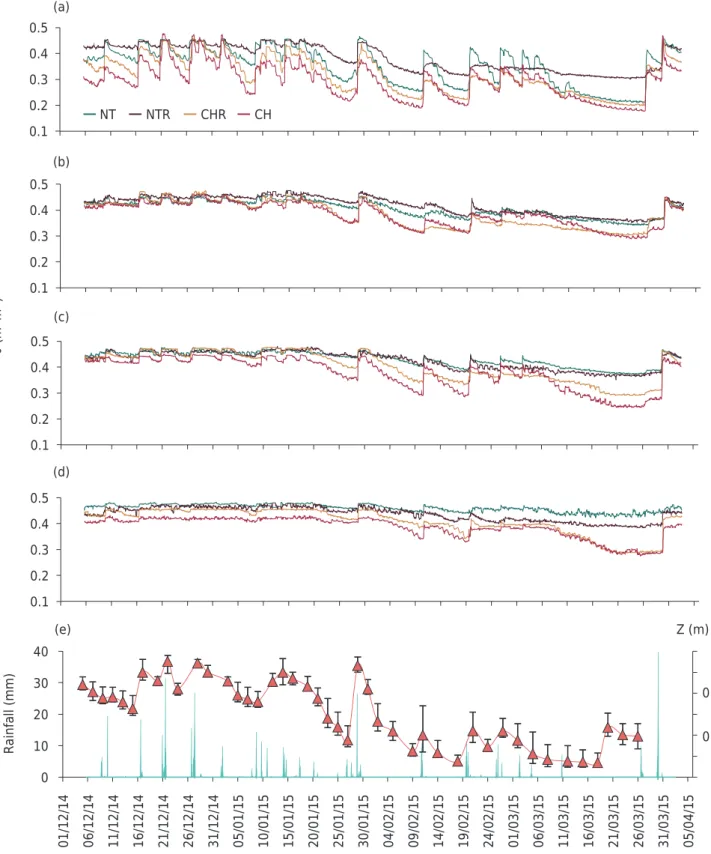
The total rainfall of 747 mm from December 2014 to early April 2015 was well distributed throughout the period (Figure 1e), even though the monthly accumulation of 324 mm in December and 190 mm in January was 99 and 49 % higher, respectively, than the standard mean value for the region (Inmet, 2009). In these months, the water table ranged from 0.1 to 0.5 m below the soil surface most of the time, sometimes oscillating within the 0.00-0.10 and 0.10-0.20 m layers. During the month of February and most of March, decreased rainfall resulted in lowering of the water table to depths between 0.75 and 1.1 m.
0 10 20 30 40
01/12/14 06/12/14 11/12/14 16/12/14 21/12/14 26/12/14 31/12/14 05/01/15 10/01/15 15/01/15 20/01/15 25/01/15 30/01/15 04/02/15 09/02/15 14/02/1
5
19/02/1
5
24/02/1
5
01/03/1
5
06/03/1
5
11/03/1
5
16/03/1
5
21/03/1
5
26/03/1
5
31/03/1
5
05/04/1
5
Rainfall (mm)
(e) 0.1 0.2 0.3 0.4 0.5
(d) 0.1 0.2 0.3 0.4 0.5
(a)
NT NTR CHR CH
0.1 0.2 0.3 0.4 0.5
(b)
0.1 0.2 0.3 0.4 0.5
θ (m
3 m -3 )
(c)
Z (m)
0.4
0.8
Figure 1. Volumetric water content (θ) in the different treatments for the 0.00-0.10 m (a), 0.10-0.20 m (b), 0.20-0.30 m (c), and
In the NTR and NT treatments, θ declined slower after the end of each rainfall (Figures 1a,
1b, 1c, and 1d). Therefore, in these treatments, the soil remained, most of the time, with
θ close to that of saturation (0.49, 0.46, 0.44, and 0.47 m3 m-3 for NTR, and 0.48, 0.45,
0.45, and 0.45 m3 m-3 for NT, from the first to the fourth layer, respectively), especially
in the 0.20-0.30 and 0.30-0.40 m layers. Maintaining high θ in these subsurface layers
is associated with their low Ks (Table 2).
Reduction in rainfall from February to March sharply lowered θ in the CHR and CH,
compared to NTR and NT. This reduction is associated with the high Ks in the 0.00-0.10 and 0.10-0.20 m layers (Table 2). Even though the water table lowered to a depth of 1 m
in this period, the permanence of high θ in layers located above the water table has been
attributed to what is known as the capillary fringe phenomenon, more noticeable where
the proportion of micropores is greater (Ronen et al., 2000). The micropores filled with water at the tension of 0.6 m did not differ among the treatments (Table 1). Therefore, maintenance of greater θ in the NTR and NT must be due to the combined effects of
capillary fringe and slow drainage conditioned by the low Ks in these treatments.
In addition, the maintenance of high θ in the CHR and CH in December and January indicates that the benefits of chiseling for drainage and aeration, i.e., an increase in Ks and Ka (Tables
2 and 3), may be temporally eliminated by the rise of water table. Except in the 0.00-0.10 m
layer, θ remained close to θs in the CHR and CH in December and January. It is also noteworthy
that the passage of the shank of the chisel plow in depth in the CH and CHR may have
facilitated water drainage, reducing the θ in the 0.30-0.40 m layer (Figure 1d).
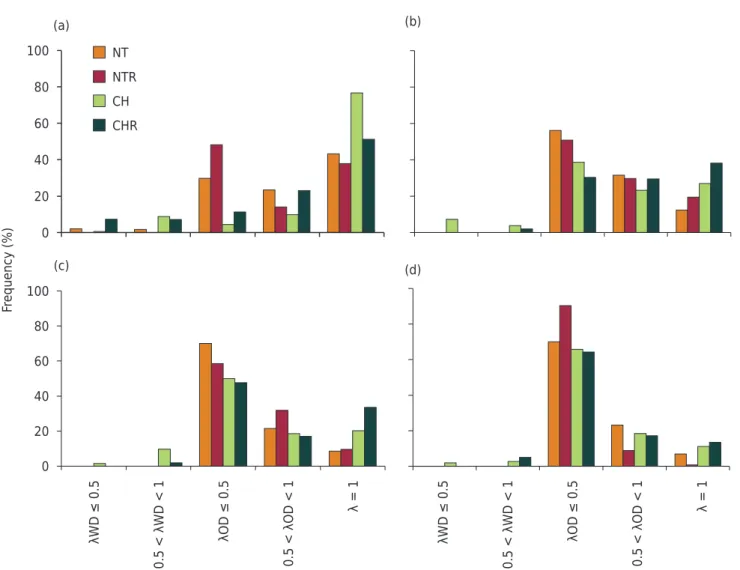
Soil structural changes caused large differences in the empirical transpiration reduction factor (λ). The frequency of λWD did not exceed 10 % in CH, 7 % in CHR, and 2 % in NT
(only in the 0.00-0.10 m layer), and was absent in the NTR (Figure 2). The OD stress in the
λOD ≤0.5 range was the most frequent and increased with depth, and it was always higher
in NT and NTR (from 48 to 90 %) and lower in CH and CHR (4 to 66 %). In the CH and CHR,
the λOD ≤0.5 frequency was not higher than the 0.5< λOD <1 frequency in the first layer. In
the four layers, the no stress condition (λ = 1) occurred from 1 to 77 % of the time, higher in the 0.00-0.10 m layer, with a decrease in depth. Regardless of the layer, the frequency of λ = 1 was always higher in CH and CHR (11 to 77 %) and lower in NT and NTR (1 to 43 %).
The CH and CHR soil conditions favor the occurrence of WD, but decreased the appearance
of OD, whereas NT and NTR had the opposite effect. The reduction in frequency of λOD by chiseling was more significant in the 0.00-0.10 m layer, but there was also a
decrease in the 0.10-0.20 and 0.20-0.30 m layers compared to the same layers in NT
and NTR. Comparison of tillage with and without ridging specifically in the 0.00-0.10 m
Table 2. Saturated hydraulic conductivity in different layers of each soil condition
Sampling
date Layer
CHR CH NTR NT
CV Saturated hydraulic conductivity
m mm h-1
%
11/26/2014
0.00-0.10 300.6 a 383.8 a 38.9 b 1.8 c 23 0.10-0.20 113.1 a 23.5 a 2.5 b 1.6 b 41 0.20-0.30 147.7 a 1.8 b 9.4 b 13.1 b 52 0.30-0.40 2.2 ab 2.3 ab 1.9 b 12.1 a 56
02/04/2015
0.00-0.10 220.2 a 53.2 ab 15.4 b 6.3 c 23
0.10-0.20 50.1 a 16.3 a 0.0 a 0.0 a 41
0.20-0.30 13.2 a 1.0 a 2.6 a 3.5 a 52
0.30-0.40 0.1 a 1.8 a 2.1 a 1.9 a 56
layer (where soil mobilization occurred by the ridge formation) indicates that the ridge
neither provided an efficient environment to reduce the λOD frequency nor to increase
the frequency of λ = 1 (Figure 2a).
Shoot dry matter and soybean yields were higher in CH, followed by CHR, NTR, and NT (Table 4). Under OD conditions, it is natural for shoot dry matter (Correa et al., 2006; Fante et al., 2010) and grain yield (Silva et al., 2007) to decrease, and to observe an increase in grain yield due to the ridge in comparison to no-till (Cassol, 2017).
Low grain yield in NT is not just associated with high frequency of λOD, but also with
reduction in plant population (Table 4) due to flooding after sowing. Strong OD at this
stage reduces seed vigor and emergence and causes seedling death (Wuebker et al., 2001; Githiri et al., 2006). In the CHR and CH with high Ks (Table 3), all water rapidly
Table 3. Air permeability at fourth water tension in different layers of each soil condition
Sampling date Layer CHR CH NTR NT CV
m %
Water tension of 0.6 m
11/26/2014
0.00-0.10 6.63 a 3.84 a 0.39 b 0.15 b 51 0.10-0.20 1.66 a 0.93 a 0.00 a 0.18 a 100 0.20-0.30 1.19 a 0.14 a 0.05 a 0.04 a 102 0.30-0.40 0.25 a 0.00 a 0.05 a 0.06 a 127
02/04/2015
0.00-0.10 3.27 a 1.93 a 2.23 a 1.34 a 51 0.10-0.20 2.62 a 4.99 a 0.12 a 0.07 a 100 0.20-0.30 0.43 ab 6.50 a 0.21 b 0.02 b 102 0.30-0.40 0.33 a 0.45 a 0.01 a 0.06 a 127
Water tension of 1 m
11/26/2014
0.00-0.10 7.67 a 5.42 a 0.47 b 0.21 b 50 0.10-0.20 2.81 a 1.60 a 0.00 a 0.38 a 83 0.20-0.30 2.15 a 0.36 a 0.08 a 0.14 a 73 0.30-0.40 0.61 a 0.17 a 0.12 a 0.21 a 90
02/04/2015
0.00-0.10 3.31 a 2.70 a 2.59 a 2.10 a 50 0.10-0.20 2.93 ab 5.60 a 0.09 ab 0.07 b 83 0.20-0.30 1.09 ab 7.08 a 0.27 ab 0.02 b 73 0.30-0.40 0.72 a 0.53 a 0.15 a 0.06 a 90
Water tension of 3.3 m
11/26/2014
0.00-0.10 8.38 a 5.77 a 0.53 b 0.26 b 48 0.10-0.20 2.24 a 3.06 a 0.00 b 0.53 ab 64 0.20-0.30 2.04 a 0.51 a 0.08 a 0.15 a 58 0.30-0.40 0.95 a 0.19 a 0.14 a 0.25 a 64
02/04/2015
0.00-0.10 3.50 a 4.22 a 2.47 a 2.19 a 48 0.10-0.20 3.49 a 7.06 a 0.12 b 0.07 b 64 0.20-0.30 0.98 ab 8.11 a 0.27 b 0.09 b 58 0.30-0.40 0.81 a 0.83 a 0.27 a 0.42 a 64
Water tension of 10 m
11/26/2014
0.00-0.10 7.91 a 8.87 a 0.73 b 0.73 b 43 0.10-0.20 7.62 a 9.14 a 0.12 b 1.79 ab 49 0.20-0.30 5.98 a 1.52 a 0.61 a 0.77 a 34 0.30-0.40 1.88 a 1.08 a 0.70 a 0.60 a 53
02/04/2015
infiltrated into the soil right after the rain ceased. In the NTR, water was concentrated
in the furrow between the ridges and slowly drained. Thus, CHR, CH, and NTR promoted
drainage sufficient to avoid reduction in plant population (Table 4).
Grain yield was 600 kg ha-1
less in CHR than in CH (Table 4). Consequently, the addition of a ridge on chiseled soil was not effective in increasing grain yield. This agrees with the fact that the ridge neither provided an efficient environment to reduce the frequency of λOD nor increased the frequency of λ = 1 (Figure 2a). In this study, chiseling without
formation of a ridge (CH) was sufficient to improve drainage, reduce the frequency of
OD stress, and ensure greater grain yields.
Figure 2. Frequency of λWD, λOD, and optimal conditions (λ =1) in the 0.00-0.10 m (a), 0.10-0.20 m (b), 0.20-0.30 m (c), and
0.30-0.40 m (d) layers. NT = no-tillage; CH = chiseling; NTR = ridge on no-tillage; CHR = ridge on chiseling. 0
20 40 60 80 100
(a)
NT
NTR
CH
CHR
(b)
0 20 40 60 80 100
Fr
equency (%)
λWD ≤ 0.
5
0.5 < λWD <
1
λOD ≤ 0.
5
0.5 < λOD <
1
λ =
1
λWD ≤ 0.
5
0.5 < λWD <
1
λOD ≤ 0.
5
0.5 < λOD <
1
λ =
1
(c) (d)
Table 4. Plant population, shoot dry matter, and grain yield under different soil tillage systems Soil condition Plant population Shoot dry matter Yield Taproot depth
plants m-2
kg ha-1
m
CH 21 a 4648 a 4610 a 0.13 a
CHR 22 a 4276 b 4001 b 0.16 a
NTR 21 a 2892 c 3565 c 0.09 b
NT 16 b 1426 d 2842 d 0.08 b
CV (%) 9.37 7.36 4.90 5.8
Even if chiseling was performed up to 0.35 m deep, the roots did not go beyond 0.16 m deep in the chiseled soil (Table 4). Root scarcity in the 0.20-0.30 and 0.30-0.40 m layers
is in agreement with the high permanence of λOD in these layers (Figures 2c and 2d) due
to high water contents (Figures 1c and 1d) resulting from the level of the water table and from capillary fringe (Figure 1e). In periods with high rainfall, the water table rises (Gomes et al., 2012), moving the capillary fringe toward the ground surface (Ronen et al., 2000). In this study, the water table level was within the 0.20-0.30 m layer at various
times, especially in the initial period, during intense root growth (Figure 1e). Consequently,
root growth may have been limited to the 0.16 m depth in the CH by interference of the capillary fringe. The success of the chiseling as a option to deepen soybean roots in lowland areas is obviously conditioned by the level of the water table and the extension of the capillary fringe.
Nevertheless, yields above 3,500 kg ha-1 obtained in CH, CHR, and NTR (Table 4) indicate
that high yields of soybean in floodplain areas can be obtained in years with no water deficiency if the surface layer up to 0.10 m is maintained with low OD. These results
corroborate those observed by Sartori et al. (2016b) in 2013/14 and 2014/15 soybean
cultivation, likewise in lowland soils and without the occurrence of water deficiency.
In their study, soybean yield was 3,754 kg ha-1 where sowing was performed after tillage
with a double offset disk, reaching 4,564 kg ha-1 where the soil was chiseled. However,
the low grain yield (2,842 kg ha-1) in NT of this study (Table 4) indicates that lack of ridge
or chiseling means high risk of loss in grain yield by flooding.
The order of soil conditions by descending grain yield is very similar to the order by ascending
frequency of λOD or descending frequency of λ = 1. This finding validates the hypothesis of
our study, indicating that the λ transpiration reduction factor well represented the differences in the water and anoxic stress dynamics faced by the plants in the different treatments. Therefore, quantification of λ is very informative of water and anoxic stress conditions,
since it is conditioned by all the processes determining the soil water dynamics. As a strong
relationship between λ and grain yield is widely used in ecophysiological models (van Lier
et al., 2008; Casaroli et al., 2010), this study suggests that these models can predict well
soybean yield in lowland soils in different climatic and soil conditions. The quantification of
soil structural properties (Table 1) or water (Table 2) and gas (Table 3) transport properties do not indicate the water and anoxic stress to which the plants are subjected throughout their cycle. As a result, the magnitude of these properties was much less associated with
grain yield than λ. Therefore, the modeling of λ is more helpful for assessing the OD and WD effect on soybean yield in lowland soils. In addition, modeling can predict changes in
soybean performance in lowland soils subjected to changes in climate and soil scenarios.
CONCLUSION
Quantification of the transpiration reduction factor (λ) is much more informative of water and anoxic stress conditions than quantification of the soil structural properties related to transport of water and gas. Chiseling decreases the frequency of oxygen deficiency, but increases the frequency of water deficiency; moreover, both are conditioned by the
depth of the water table. Furthermore, chiseling increases soybean yield in lowland soils.
The use of ridge tillage combined with chiseling is not a profitable alternative, but ridge
tillage in untilled soil increases soybean yield.
REFERENCES
Bailey-Serres J, Lee SC, Brinton E. Waterproofing crops: effective flooding survival strategies. Plant Physiol. 2012;160:1698-709. https://doi.org/10.1104/pp.112.208173
Cassol GV. Sistemas de implantação, irrigação e alterações fisiológicas de plantas de soja sob cultivo em terras baixas [tese]. Santa Maria: Universidade Federal de Santa Maria; 2017.
Comissão de Química e Fertilidade do Solo - CQFS-RS/SC. Manual de adubação e calagem para os estados do Rio Grande do Sul e Santa Catarina. 10. ed. Porto Alegre: Sociedade Brasileira de Ciência do Solo; 2004.
Companhia Nacional de Abastecimento - Conab. Acompanhamento da safra brasileira de grãos. Safra 2016/17 - Sétimo levantamento; 2017 [internet]. Brasília, DF: 2017 [accesso em 28 mai 2017]. Disponível em: http://www.conab.gov.br/OlalaCMS/uploads/ arquivos/17_04_17_17_20_55_boletim_graos_abr_2017.pdf
Cornelious B, Chen P, Hou A, Shi A, Shannon JG. Yield potential and waterlogging tolerance of selected near-isogenic lines and recombinant inbred lines from two southern soybean populations. J Crop Improvement. 2006;16:97-111. https://doi.org/10.1300/J411v16n01_07 Correa MF, Zenzen IL, Bueno Junior AAA, Badinelli PG, Colares DS, Amarante L. Diferentes genótipos de soja nodulada sob influência do alagamento no acúmulo de massa seca. In: Anais do XV Congresso de Iniciação Científica e VIII Encontro de Pós-Graduação da UFPel; 2006; Pelotas. Pelotas: Editora da UFPel; 2006.
Costamilan LM, Carrão-Panizzi MC, Strieder ML, Bertagnolli PF. Indicações técnicas para a cultura da soja no Rio Grande do Sul e em Santa Catarina, safras 2012/2013 e 2013/2014. Passo Fundo: Embrapa Trigo; 2012. (Documentos, 107).
Cruciani DE. A drenagem na agricultura. 4. ed. São Paulo: Nobel; 1987.
Decagon Devices. Operator’s manual version 1.3 WP4 dewpointmeter. Pullman: Decagon Devices; 2000.
Drescher MS, Reinert DJ, Denardin JE, Gubiani PI, Faganello A, Drescher GL. Duração das alterações em propriedades físico-hídricas de Latossolo argiloso decorrentes da escarificação mecânica. Pesq Agropec Bras. 2016;51:159-68. https://doi.org/10.1590/S0100-204X2016000200008
Fante CA, Alves JD, Goulart PFP, Deuner S, Silveira NM. Respostas fisiológicas em cultivares de soja submetidas ao alagamento em diferentes estádios. Bragantia. 2010;69:253-61. https://doi.org/10.1590/S0006-87052010000200001
Feddes RA, Kowalik PJ, Zaradny H. Simulation of field water use and crop yield. Wegeningen: Centre for Agricultural Publishing and Documentation; 1978.
Fehr WR, Caviness CE. Stages of soybean development. Ames: State University of Science and Technology; 1977. (Special port, 80).
Fiorin TT, Carlesso R, Michelon CJ, Künz CJ, Andrade JGD, Spohr RB. Profundidade do lençol freático em solos de várzea cultivado com milho em camalhões. In: Anais do XXIX Congresso Brasileiro de Ciência do solo; julho 2003; Ribeirão Preto. Ribeirão Preto: Universidade Estadual Paulista; 2003.
Githiri SM, Watanabe S, Harada K, Takahashi R. QTL analysis of flooding tolerance in soybean at an early vegetative growth stage. Plant Breeding. 2006;125:613-8. https://doi.org/10.1111/j.1439-0523.2006.01291.x
Gomes AS, Porto MP, Parfitt JMB, Silva CAS, Souza RO, Pauletto EA. Rotação de culturas em áreas de várzea e plantio direto de arroz. Pelotas: Embrapa Clima Temperado; 2002. (Documentos, 89).
Gomes MA, Lani JL, Costa LM, Pontes LM, Figueredo NA, Bardales NG. Solos, manejo e aspectos hidrológicos na bacia hidrográfica do Araújos, Viçosa - MG. Rev Arvore. 2012;36:93-102. https://doi.org/10.1590/S0100-67622012000100011
Gubiani PI, Reichert JM, Campbell C, Reinert DJ, Gelain NS. Assessing errors and accuracy in dew-point potentiometer and pressure plate extractor measurements. Soil Sci Soc Am J. 2013b;77:19-24. https://doi.org/10.2136/sssaj2012.0024
Gubiani PI, Reichert JM, Reinert DJ. Indicadores hídrico-mecânicos de compactação do solo e crescimento de plantas. Rev Bras Cienc Solo. 2013a;37:1-10.
https://doi.org/10.1590/S0100-06832013000100001
Klute A. Water retention: laboratory methods. In: Klute A, editor. Methods of soil analysis. Physical and mineralogical methods. 2nd ed. Madison: American Society of Agronomy; 1986. Pt 1. p. 635-62.
Letey J. Relationship between soil physical properties and crop production. Adv Soil S. 1985;1:277-94. https://doi.org/10.1007/978-1-4612-5046-3_8
Libardi PL. Dinâmica da água no solo. São Paulo: Editora da Universidade de São Paulo; 2005. Mentges MI, Reichert JM, Rodrigues MF, Awe GO, Mentges LR. Capacity and intensity soil aeration properties affected by granulometry, moisture, and structure in no-tillage soils. Geoderma. 2016;263:47-59. https://doi.org/10.1016/j.geoderma.2015.08.042
Mentges MI, Reichert JM, Rosa DP, Vieira DA, Rosa VT, Reinert DJ. Propriedades físico-hídricas do solo e demanda energética de haste escarificadora em Argissolo compactado. Pesq Agropec Bras. 2010;45:315-21. https://doi.org/10.1590/S0100-204X2010000300012
Mesquita MGBF, Moraes SO. A dependência entre a condutividade hidráulica saturada e atributos físicos do solo. Cienc Rural. 2004;34:963-9. https://doi.org/10.1590/S0103-84782004000300052
Munareto JD, Beutler AN, Ramão CJ, Dias NP, Ramos PV, Pozzebon BC, Alberto CM, Hernandes GC. Propriedades físicas do solo e produtividade de arroz irrigado por inundação no sistema plantio direto. Pesq Agropec Bras. 2010;45:1499-506. https://doi.org/10.1590/S0100-204X2010001200022 Mundstock CM, Thomas AL. Soja: fatores que afetam o crescimento e rendimento de grãos. Porto Alegre: Universidade Federal do Rio Grande do Sul; 2005.
Peel MC, Finlayson BL, McMahon TA. Updated world map of the Köppen-Geiger climate
classification. Hydrol Earth Syst Sci. 2007;11:1633-44. https://doi.org/10.5194/hess-11-1633-2007 Pires JLF, Soprano E, Cassol B. Adaptações morfofisiológicas da soja em solo inundado. Pesq Agropec Bras. 2002;37:41-50. https://doi.org/10.1590/S0100-204X2002000100006
Prevedello J, Vogelmann ES, Kaiser DR, Reinert DJ. A funcionalidade do sistema poroso do solo em floresta de eucalipto sob Argissolo. Sci For. 2013;41:557-66.
Reinert DJ, Reichert JM. Coluna de areia para medir a retenção de água no solo - protótipos e testes. Cienc Rural. 2006;36:1931-5. https://doi.org/10.1590/S0103-84782006000600044
Rodrigues S, Silva AP, Giarola NFB, Rosa JA. Permeabilidade ao ar em Latossolo vermelho sob diferentes sistemas de manejo. Rev Bras Cienc Solo. 2011;35:105-14. https://doi.org/10.1590/S0100-06832011000100010
Ronen D, Scher H, Blunt M. Field observations of a capillary fringe before and after a rainy season. J Contam Hydrol. 2000;44:103-18. https://doi.org/10.1016/S0169-7722(00)00096-6
Rosa DP, Reichert JM, Mentges MI, Barros CAP, Reinert DJ, Vieira DA. Cultivo mínimo: efeito da compactação e deformação abaixo da atuação da ponteira do subsolador. Rev Bras Eng Agr Amb. 2011;15:1199-205. https://doi.org/10.1590/S1415-43662011001100014
Rosa DP, Reichert JM, Sattler A, Reinert DJ, Mentges MI, Vieira DA. Relação entre solo e haste sulcadora de semeadora em Latossolo escarificado em diferentes épocas. Pesq Agropec Bras. 2008;43:395-400. https://doi.org/10.1590/S0100-204X2008000300015
Santos HG, Jacomine PKT, Anjos LHC, Oliveira VA, Oliveira JB, Coelho MR, Lumbreras JF, Cunha TJF. Sistema brasileiro de classificação de solos. 3. ed. rev. ampl. Rio de Janeiro: Embrapa Solos; 2013. Sartori GMS, Marchesan E, De David R, Carlesso R, Petry MT, Aires NP, Giacomeli R, Aramburu BB, Silva AL. Soybean tillage systems and physical changes in surface layers of two Albaqualf soils. Rev Bras Cienc Solo. 2016a;40:e0160019. https://doi.org/10.1590/18069657rbcs20160019
Sartori GMS, Marchesan E, De David R, Donato G, Coelho LL, Aires NP, Aramburu BB. Sistemas de preparo do solo e de semeadura no rendimento de grãos de soja em área de várzea. Cienc Rural. 2016b;46:492-8. https://doi.org/10.1590/0103-8478cr20150676
Silva CAS, Theisen G, Parfitt JMB, Silva JJC, Pohlmann NF, Carvalho EN, Segabinazi DR. Sistema sulco/camalhão para irrigação e drenagem em áreas de várzea. Pelotas: Embrapa Clima Temperado; 2007. (Comunicado técnico, 165).
Soil Survey Staff. Keys to soil taxonomy. 12th ed. Washington, DC: United States Department of Agriculture, Natural Resources Conservation Service; 2014.
Tavares LC, Rufino CA, Brunes AP, Tunes LM, Barros ACSA, Peske ST. Desempenho de sementes de soja sob deficiência hídrica: rendimento e qualidade fisiológica da geração F1. Cienc Rural. 2013;43:1357-63. https://doi.org/10.1590/S0103-84782013000800003
Thomas AL, Guerreiro SMC, Sodek L. Aerenchyma formation and recovery from hypoxia of the flooded root system of nodulated soybean. Ann Bot. 2005;96:1191-8. https://doi.org/10.1093/aob/mci272
Topp GC, Davis JL, Annan AP. Electromagnetic determination of soil water content: measurement in coaxial transmission lines. Water Resour Res. 1980;16:574-82. https://doi.org/10.1029/WR016i003p00574
van Genuchten MTh. A closed-form equation for predicting the hydraulic conductivity of unsaturated soils. Soil Sci Soc Am J. 1980;44:892-8. https://doi.org/10.2136/sssaj1980.03615995004400050002x
van Lier QJ, Gubiani PI. Beyond the “least limiting water range”: rethinking soil physics research in Brazil. Rev Bras Cienc Solo. 2015;39:925-39. https://doi.org/10.1590/01000683rbcs20140596
van Lier QJ, van Dam JC, Metselaar K, Jong R, Duijnisveld WHM. Macroscopic root water uptake distribution using a matric flux potential approach. Vadose Zone J. 2008;7:1065-78. https://doi.org/10.2136/vzj2007.0083
VanToai TT, Beuerlein JE, Schmitthenner SK, Martin SKSt. Genetic variability for flooding tolerance in soybeans. Crop Sci. 1994;34:1112-5. https://doi.org/10.2135/cropsci1994.0011183X003400040051x