Mortality from external causes in Pernambuco, 2001-2003 and 2011-2013
Mortalidade causas externas em Pernambuco,2001-2003 e 2011-2013
Mortalidad por las causas externas en Pernambuco, 2001-2003 y 2011-2013
Gabriela Bardelini Tavares Melo
I, Sandra Valongueiro Alves
I, Maria Luiza Carvalho de Lima
II,IIII Universidade Federal de Pernambuco, Integrated Postgraduate Program in Public Health. Recife, Pernambuco, Brazil. II Universidade Federal de Pernambuco, Department of Social Medicine. Recife, Pernambuco, Brazil.
III Fundação Oswaldo Cruz, Aggeu Magalhães Research Center. Recife, Pernambuco, Brazil.
How to cite this article:
Melo GBT, Alves SV, Lima MLC. Mortality from external causes in Pernambuco, 2001-2003 and 2011-2013. Rev Bras Enferm. 2015;68(5):573-9. DOI: http://dx.doi.org/10.1590/0034-7167.2015680513i
Submission: 12-18-2014 Approval: 04-07-2015
ABSTRACT
Objective: to describe the mortality from external causes, by Health Regions in Pernambuco, during the periods of2001-2003 and 2011-2013. Method: descriptive study with data from the Mortality Information System. For data analysis we used percentage, percentage variation and proportion ratio. Results: mortality from external causes reduced in Pernambuco, however, mortality increased in some health regions of the countryside. Increased numbers of deaths from accidents and event of undetermined intent were registered. There was an increase of deaths classifi ed as “other/unspecifi ed” event of undetermined intent. Conclusion: there was a change in the spatial distribution of mortality from external causes moving to Pernambuco countryside regions. We found necessity for data classifi cation regarding deaths from external causes and strengthening of the monitoring.
Key words: Mortality; External Causes; Information Systems.
RESUMO
Objetivo: descrever a distribuição dos óbitos por causas externas, por Região de Saúde de Pernambuco, nos períodos 2001-2003 e 2011-2013. Método: estudo descritivo, cuja fonte de dados foi o Sistema de Informação sobre Mortalidade. Para análise foram utilizados percentuais, variações percentuais e razões de proporção. Resultados: os óbitos por causas externas reduziram em Pernambuco, entretanto aumentaram em algumas Regiões de Saúde do interior. Registrou-se aumento dos óbitos por acidentes e intenção indeterminada. Houve aumento dos óbitos classifi cados como “outros/não especifi cados” de intenção indeterminada. Conclusão:
observou-se alteração da distribuição espacial dos óbitos por causas externas, deslocando-se para o interior de Pernambuco. Verifi cou-se ainda a necessidade da qualifi cação dos dados dos óbitos por causas externas e o fortalecimento do monitoramento.
Descritores: Mortalidade; Causas Externas; Sistemas de Informação.
RESUMEN
Objetivo: describir la distribución de óbitos por causas externas, por Región de Salud de Pernambuco, en los períodos de 2001-2003 y 2011-2013. Método: estudio descriptivo, cuya fuente de datos fue el Sistema de Información sobre Mortalidad. Para análisis fueron utilizados porcentajes, variaciones porcentuales y razón de proporción. Resultados: los óbitos por causas externas se redujeron en Pernambuco, pero aumentaron en algunas Regiones de Salud del interior. Se registró un aumento de los óbitos por accidentes e intención indeterminada. Hubo aumento de los óbitos clasifi cados como “otros/no especifi cados” de intención indeterminada. Conclusión: fue posible observar la alteración de la distribución espacial de los óbitos por causas externas para el interior de Pernambuco. Se verifi có también necesidad de la cualifi cación de los datos de los óbitos por causas externas y el fortalecimiento del seguimiento.
Palabras clave: Mortalidad; Causas Externas; Sistema de Información.
INTRODUCTION
In recent decades, external causes have been highlighted in health statistics of most countries, becoming a public health prob-lem(1). They represented the third group of most frequent causes
of death in the country during the period 2000-2010(2-3). They
had as main circumstances assault (homicide) and vehicle and traffic injuries (VTI)(4). In the State of Pernambuco (PE), external
causes ranked second in 2010 (14.6% of deaths), the ones caused by VTI were more frequent(2). According to Minayo(4), mortality
from external causes occurred in the country have characteristics that make them unique compared to other causes. They are: per-sistence of high mortality rates from these causes in the past 25 years, much heterogeneity among municipalities, spatial disper-sion of VTI, increase in suicides among the elderly, concentration in young adult males and high mortality rates from firearms.
Upon the occurrence of mortality from external causes, the body must be sent to the Institute of Legal Medicine (ILM) so that the autopsy and the Death Certificate (DC) can be per-formed and completed by a forensic expert. However, some-times the DC does not have information on the type of accident or assault that caused death. This raises the number of certifi-cate statements coded as “events of undetermined intent”(5-6).
High proportions of these deaths limit the knowledge of their profile and the performance of epidemiological surveil-lance actions(7). In addition, they reveal weakness of the Legal
Medicine System in assessing the reason that led to mortality, which is the underlying cause of death(8).
In PE state, the mortality rate due to external causes for event of undetermined intent increased from 3.4/100,000 in-habitants in 1996 to 7.4/100,000 inin-habitants in 2010(8).
Given the importance of monitoring the mortality from ex-ternal causes as a strategy to assess its progress and its imple-mented policy impacts, this study aimed to analyze the distri-bution of deaths by external causes, in the periods 2001-2003 and 2011-2013, by Health Region (HR) in PE.
METHOD
Descriptive study conducted in PE state and its 12 health regions (HR). Pernambuco has 184 municipalities and a prov-ince (Fernando de Noronha), divided into 12 HR, separated in order to provide support to municipalities and Fernando de Noronha Island. Each HR is responsible for primary care work, restructuring the hospital network, municipal actions, combating endemic diseases and mortality.
The empirical material of the study consisted of all deaths and deaths from external causes recorded in the Mortality In-formation System (MIS) of PE state in the periods 2001-2003 and 2011-2013, according to the place of occurrence.
We selected mortality by place of occurrence because, ac-cording to the Ordinance GM/MS No. 116, 2009(9), typing
and the DC processing are given in the municipality where the death occurred.
We chose the periods 2001-2003 and 2011-2013 in order to perform comparison after ten years. Data were grouped in three-year periods in order to avoid the instability of small numbers.
For analysis, data were extracted from the MIS, on the web-site of the Informatics Department of SUS1 (Datasus). Later,
they were tabulated in TabWin software version 3.5, orga-nized and distributed by HR on tables using Microsoft Office Excel®. We calculated the percentage, the percentage variation
and the proportion ratio. The last two are used to analyze the behavior registry from one period to another from the study.
In order to calculate the percentage variation (PV) we used the following formula: PV = [(percentage of mortality in 2011-2013 - Percentage of mortality in 2001-2003)/ percent-age of mortality in 2001-2003] x 100.
To calculate the proportion ratio we divided the percent-age of mortality in the period 2011-2013 by the percentpercent-age of mortality in the period 2001-2003.
The HR which did not show percentage variation and percentage ratios corresponded to those which did not have death records from 2001-2003 or at neither periods studied. The HR that presented negative percentage variation -100% corresponded to those which did not have death records in 2008-2010, with records only from 2001-2003.
We have also calculated the percentage and the percentage variation of deaths from external causes according to the cir-cumstances of these deaths - accidents (V01-X59), intentional self-harm (suicide - X60-X84), assault (X85-Y09), event of unde-termined intent (Y10 -Y34) and others (Y35-Y98); and according to the nature of the injury (type of injury that caused death) of deaths from external causes for events of undetermined intent - poisoning (Y10-Y19), hanging (Y20), drowning (Y21), handgun discharge/explosive material (Y22-Y25), smoke/fire/flame/hot vapours/gas/hot objects (Y26-Y27), sharp/blunt object (Y28-Y29) and other/unspecified (Y30-Y34).
The research was conducted according to Resolution of the Brazilian National Health Council (CNS) number 466/2012. It was submitted to the Research Ethics Committee (REC) of the Health Sciences Center (CCS) at the Universidade Federal de Pernambuco (UFPE), protocol No. 384184 of September 4, 2013. There was no conflict of interest in performing the study.
RESULTS
There were 22087 deaths registries due to external causes in PE during 2001-2003 and 21,959 in 2011-2013. Although there was a reduction in the percentage of these deaths, from 14.06% to 12.68%, with a negative percentage variation -9.81% (Table 1).
The highest percentages of deaths from external causes oc-curred in the 8th, 1st and 3rd HR in the period 2001-2003, and
in the 9th, 8th and 12th HR in the 2011-2013. There was an
increase registries in the eighth HR, especially in the 10th and
9th HR, respectively (Table 1).
Table 1 - Total mortality, number and percentage, percentage variation and proportion ratio of deaths due to external causes by Health Region, Pernambuco, Brazil, 2001-2003 and 2011-2013
Health region (HR)
Mortality Mortality caused by external causes
Proportion ratio (b/a)
2001-2003 2011-2013 2001-2003 2011-2013 Variation %
n % (a) n % (b)
1st HR 82.122 94.989 12.887 15.69 11.927 12.56 -19.99 0.80
2nd HR 7.330 7.893 939 12.81 929 11.77 -8.12 0.92
3rd HR 8.827 7.274 1.241 14.06 984 13.53 -3.78 0.96
4th HR 21.390 23.199 2.639 12.34 2.965 12.78 3.59 1.04
5th HR 8.856 9.706 926 10.46 1.092 11.25 7.60 1.08
6th HR 5.771 5.549 612 10.60 664 11.97 12.84 1.13
7th HR 1.938 2.133 210 10.84 257 12.05 11.19 1.11
8th HR 6.009 6.958 1.004 16.71 1.063 15.28 -8.56 0.91
9th HR 3.950 4.551 496 12.56 801 17.60 40.17 1.40
10th HR 2.965 3.155 161 5.43 260 8.24 51.77 1.52
11th HR 3.662 3.995 418 11.41 468 11.71 2.63 1.03
12th HR 4.304 3.802 554 12.87 549 14.44 12.18 1.12
Ignored region 1 - - -
-Pernambuco 157.125 173.204 22.087 14.06 21.959 12.68 -9.81 0.90
Source: MIS, 2001-2003 and 2011-2013.
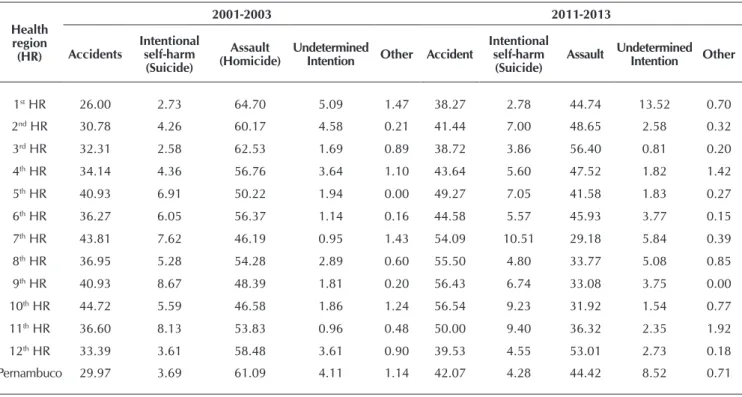
Table 2 - Percentage* of mortality from external causes according to their circumstances by Health Region, Pernambuco, Brazil, 2001-2003 and 2011-2013
Health region
(HR)
2001-2003 2011-2013
Accidents
Intentional self-harm
(Suicide)
Assault (Homicide)
Undetermined
Intention Other Accident
Intentional self-harm
(Suicide)
Assault Undetermined
Intention Other
1st HR 26.00 2.73 64.70 5.09 1.47 38.27 2.78 44.74 13.52 0.70
2nd HR 30.78 4.26 60.17 4.58 0.21 41.44 7.00 48.65 2.58 0.32
3rd HR 32.31 2.58 62.53 1.69 0.89 38.72 3.86 56.40 0.81 0.20
4th HR 34.14 4.36 56.76 3.64 1.10 43.64 5.60 47.52 1.82 1.42
5th HR 40.93 6.91 50.22 1.94 0.00 49.27 7.05 41.58 1.83 0.27
6th HR 36.27 6.05 56.37 1.14 0.16 44.58 5.57 45.93 3.77 0.15
7th HR 43.81 7.62 46.19 0.95 1.43 54.09 10.51 29.18 5.84 0.39
8th HR 36.95 5.28 54.28 2.89 0.60 55.50 4.80 33.77 5.08 0.85
9th HR 40.93 8.67 48.39 1.81 0.20 56.43 6.74 33.08 3.75 0.00
10th HR 44.72 5.59 46.58 1.86 1.24 56.54 9.23 31.92 1.54 0.77
11th HR 36.60 8.13 53.83 0.96 0.48 50.00 9.40 36.32 2.35 1.92
12th HR 33.39 3.61 58.48 3.61 0.90 39.53 4.55 53.01 2.73 0.18
Pernambuco 29.97 3.69 61.09 4.11 1.14 42.07 4.28 44.42 8.52 0.71
Source: MIS, 2001-2003 and 2011-2013. Note:
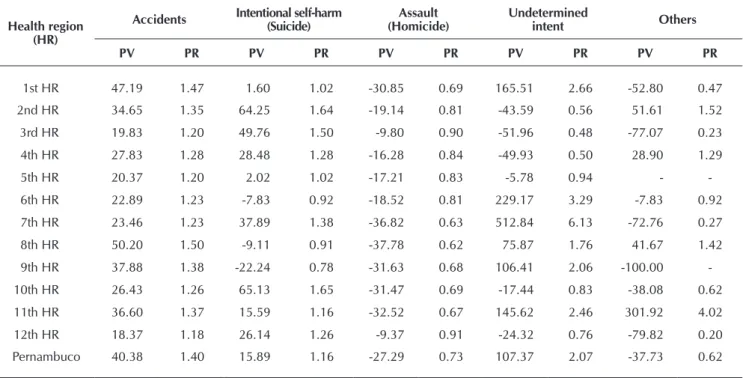
Table 3 - Percentage variation and proportion ratio of deaths according to their circumstance by Health Region, Pernambuco, Brazil, 2000-2002 and 2008-2010
Health region (HR)
Accidents Intentional self-harm (Suicide) (Homicide)Assault Undetermined intent Others
PV PR PV PR PV PR PV PR PV PR
1st HR 47.19 1.47 1.60 1.02 -30.85 0.69 165.51 2.66 -52.80 0.47
2nd HR 34.65 1.35 64.25 1.64 -19.14 0.81 -43.59 0.56 51.61 1.52
3rd HR 19.83 1.20 49.76 1.50 -9.80 0.90 -51.96 0.48 -77.07 0.23
4th HR 27.83 1.28 28.48 1.28 -16.28 0.84 -49.93 0.50 28.90 1.29
5th HR 20.37 1.20 2.02 1.02 -17.21 0.83 -5.78 0.94 -
-6th HR 22.89 1.23 -7.83 0.92 -18.52 0.81 229.17 3.29 -7.83 0.92
7th HR 23.46 1.23 37.89 1.38 -36.82 0.63 512.84 6.13 -72.76 0.27
8th HR 50.20 1.50 -9.11 0.91 -37.78 0.62 75.87 1.76 41.67 1.42
9th HR 37.88 1.38 -22.24 0.78 -31.63 0.68 106.41 2.06 -100.00
-10th HR 26.43 1.26 65.13 1.65 -31.47 0.69 -17.44 0.83 -38.08 0.62
11th HR 36.60 1.37 15.59 1.16 -32.52 0.67 145.62 2.46 301.92 4.02
12th HR 18.37 1.18 26.14 1.26 -9.37 0.91 -24.32 0.76 -79.82 0.20
Pernambuco 40.38 1.40 15.89 1.16 -27.29 0.73 107.37 2.07 -37.73 0.62
Source: MIS, 2001-2003 and 2011-2013. Note:
PV: Percentage Variation; PR: Poportion ratio.
Table 4 - Percentage* of mortality from external causes of undetermined intent by nature of injury and Health Region, Per-nambuco, Brazil, 2001-2003 and 2011-2013
Health region (HR)
2001-2003 2011-2013
A B C D E F G A B C D E F G
1st HR 5.64 3.20 26.07 5.34 5.18 26.52 28.05 2.79 1.24 6.02 0.68 0.93 8.19 80.15
2nd HR 2.33 11.63 30.23 11.63 2.33 9.30 32.56 4.17 20.83 20.83 4.17 4.17 33.33 12.50
3rd HR - 4.76 28.57 9.52 4.76 9.52 42.86 - 12.50 37.50 - - 25.00 25.00
4th HR 3.13 12.50 35.42 16.67 5.21 18.75 8.33 12.96 7.41 11.11 - 3.70 33.33 31.48
5th HR 11.11 - 27.78 16.67 - 5.56 38.89 35.00 5.00 25.00 5.00 - 10.00 20.00
6th HR 14.29 - 14.29 42.86 14.29 - 14.29 8.00 16.00 32.00 4.00 - 4.00 36.00
7th HR 50.00 50.00 - - - 13.33 13.33 33.33 - - 20.00 20.00
8th HR 10.34 3.45 34.48 3.45 - 24.14 24.14 0.00 7.41 48.15 1.85 1.85 7.41 33.33
9th HR 33.33 22.22 22.22 - - 11.11 11.11 3.33 6.67 40.00 3.33 - 10.00 36.67
10th HR - 100.00 - - - 25.00 - 25.00 25.00 - - 25.00
11th HR 25.00 25.00 25.00 - - 25.00 - 9.09 27.27 18.18 - - 18.18 27.27
12th HR - 10.00 45.00 - 5.00 10.00 30.00 - - 53.33 - - - 46.67
Pernambuco 5.73 5.40 27.75 7.16 4.74 23.13 26.10 3.58 2.46 9.51 0.91 1.01 9.35 73.18
Source: MIS, 2001-2003 and 2011-2013. Note:
* Percentage of mortality from external causes of undetermined intent by nature of injury in relation to the mortality from external causes of undetermined intent by Health Region and Pernambuco.
With regard to the mortality circumstances, it was observed that PE registration focused on assaults and accidents in both periods (Table 2).
In mortality caused by accidents, the highest rate was reg-istered in the 10th HR, in the two periods of the study. Since
deaths from assaults, were often recorded in the 1st HR, during
2001-2003 and in the 3rd HR in 2011-2013 (Table 2).
Analyzing the percent variation and the proportion ratio, it was found an increased mortality due to accidents, intentional self-harm and undetermined intention (Table 3).
In the HR, we found that deaths due to accidents increased in all the HR, with higher values in the 1st and 8thHR,
re-spectively. For deaths by intentional self-harm, there was an increase in nine HR, especially for the 10th and 2nd HR. For
deaths of undetermined intent, there was increase in six HR, standing out with highest values, the 7th and 6th HR (Table 3).
Regarding the nature of the injury of deaths by external causes for undetermined intent in PE in the period 2001-2003, deaths from drowning were the most frequent. The deaths classified as “other/unspecified” were the most frequent in the period 2011-2013 (Table 4).
From deaths by drowning, the highest frequencies were found in the 12th HR in both study periods. For those classified
as “other/unspecified”, the highest frequencies were found in the 3rd HR in the period 2001-2003 and the 1st HR in the
pe-riod 2011-2013 (Table 4).
In PE there was an increase in deaths classified as “other/ unspecified”. In the HR, we highlight the deaths by drowning which increased in five HR and classified as “other/unspeci-fied” which showed an increase in six HR (Table 5).
DISCUSSION
We found reduction of mortality from external causes in the state and in some HR. This was also observed in São Paulo (SP) state, where mortality from external causes was also de-creased. It was the third leading cause of death in 2000, with 14.1% and the fourth cause in 2010, with 9.5%(10).
However, there was increase in external causes, mainly in the countryside. Waiselfisz(11) states that violence has shifted
from the capital to countryside. This phenomenon is called “countryside violence”. It results from the economic stagna-tion of the capital and metropolitan regions, and the security of investments in these locations.
It was observed that there was reduction in deaths from as-saults in the HR and in the state, however, it was the most fre-quent in PE and in the HR. Of these, the vast majority showed high frequency in HR with the Metropolitan Region Munici-palities or next to it. This confirms the impact of existing vio-lence in big cities and their metropolitan areas.
Mortality from assault is considered an important indica-tor of social violence. It is related to social and economic
Table 5 - Percentage variation and proportion ratio of deaths due to external causes of undetermined intent by nature of in-jury, Pernambuco, Brazil, 2001-2003 and 2011-2013
Health region (HR)
A B C D E F G
PV PR PV PR PV PR PV PR PV PR PV PR PV PR
1st HR -50.51 0.49 -61.24 0.39 -76.92 0.23 -87.21 0.13 -82.05 0.18 -69.13 0.31 185.75 2.86
2nd HR 79.17 1.79 79.17 1.79 -31.09 0.69 -64.17 0.36 79.17 1.79 258.33 3.58 -61.61 0.38
3rd HR - - 162.50 2.63 31.25 1.31 -100.00 - -100.00 - 162.50 2.63 -41.67 0.58
4th HR 314.81 4.15 -40.74 0.59 -68.63 0.31 -100.00 - -28.89 0.71 77.78 1.78 277.78 3.78
5th HR 215.00 3.15 - - -10.00 0.90 -70.00 0.30 - - 80.00 1.80 -48.57 0.51
6th HR -44.00 0.56 - - 124.00 2.24 -90.67 0.09 -100.00 - - - 152.00 2.52
7th HR -73.33 0.27 -73.33 0.27 - - -
-8th HR -100.00 - 114.81 2.15 39.63 1.40 -46.30 0.54 - - -69.31 0.31 38.10 1.38
9th HR -90.00 0.10 -70.00 0.30 80.00 1.80 - - -10.00 0.90 230.00 3.30
10th HR - - -100.00 - - -
-11th HR -63.64 0.36 9.09 1.09 -27.27 0.73 - - - - -27.27 0.73 -
-12th HR - - -100.00 18.52 1.19 - - -100.00 - -100.00 - 55.56 1.56
Pernambuco -37.50 0.62 -54.47 0.46 -65.74 0.34 -87.31 0.13 -78.57 0.21 -59.58 0.40 180.38 2.80
Source: MIS, 2001-2003 and 2011-2013. Note:
inequalities, the precariousness of the public safety, depriva-tion of opportunities and human rights violadepriva-tions(12-14).
Mortality due to accidents may be mainly related to VTI. They are the result of development model focused on roads, large and medium cities and the increasing number of circu-lating vehicles.
The VTI are the second cause for mortality from external causes in the country, representing in 2009, 26.5% of deaths from external causes in Brazil(3). Its high frequency can
re-late to, especially those caused by motorcycles. According to Bacchieri and Barros(15), motorcycles have become efficient
means of transportation and work due to acquisition facilities, precariousness of public transportation and traffic congestion. However, the way of conducting this type of transport exposes more users. In 2010, the motorcycle accidents were the lead-ing cause of death among VTI in PE(2).
The present study also highlighted increased registration of deaths from self-harm intention. Much progress in studies and discussion of these deaths have been made, however, its occurrence is a not yet resolve dissue.
Deaths from self-harm intention are relevant in the coun-try’s mortality scenario. Its understanding is difficult because the occurrence is closely linked to social issues and the com-plexity of the human being(16).
Suicide prevention requires public policy action involving multidisciplinary teams and actions that consider the family and socioeconomic aspects, mental health and social support in all its dimensions.
Another important point was the registries of deaths from external causes of undetermined intent. What caught the at-tention of these deaths was the high increase in the 7th and 6th
HR and in PE.
Despite its decline in Brazil, in 2010, approximately 10.3% of all deaths from external causes were classified as undetermined intent. Thus, it reveals the persistent weakness in health care, reflected in information regarding deaths from this cause(8).
The study showed difficulties in the improvement of infor-mation about mortality, especially as regards the fulfillment of the DC cause. In this case, the inadequate completion of the cause, by the Legal Medical physician, which underestimates death rates from external causes.
According to the Ordinance GM/MS No. 116, 2009(9),
typ-ing DC should be done in the municipality where the death occurred. Therefore, the recording quality can also be related to the functioning and organization of the information system in the place of occurrence.
For Melo and collaborators(17), the main factors leading to
the increase of the registries of deaths are filling only the na-ture of the injury that caused the death and physicians assign this responsibility to the description of the circumstances of the death to the police. This expresses a reductionist view of the physician’s role in completing this document and their possible legal implications.
Registration and disclosure of these deaths can also be re-lated to political and economical interests of certain places, such as the tourism industry and state and municipal elections.
One can cite as an example the case occurred in the city of Rio de Janeiro, where a law enacted in 2007 prohibited shar-ing information of criminal deaths with other people, except to those working for the Civil Police, Ministry of Public Affairs and Judiciary. That same year, just from the period when the law was enacted, the number of deaths from external causes of undetermined intention in the city doubled(8).
Regarding the nature of the injury, the study highlighted the deaths classified as “other/unspecified” bringing to light the continuing problems in filling in the DC. In Rio de Janeiro’s city, from 2000 to 2006, these were the most frequent deaths from external causes of undetermined intent(18).
It is essential to rescue the importance of the DC in the analysis of mortality. Improving the information quality is related to system quality, from the training of professionals for the registration of each variable, the encoders from basic causes from MIS to the active search (qualification) of these deaths information(7).
As this is a descriptive cross-sectional study, whose re-search was carried out only once, it had the limitation not to carry out causal hypotheses testing and analyzing the tem-poral sequence of events involving the deaths from external causes(19). So it was not possible to identify the real reasons
for the increase in such deaths in some HR and decrease in others, as well as its variation in PE. However, its results made possible to contribute to implementation of monitoring of the occurrence of deaths from external causes, as well as to the qualification of the MIS registries.
CONCLUSION
We found a reduction of deaths from external causes in PE and an increase in health regions (HR) in the state. It shows a change in the spatial distribution of the occurrence of violence from the capital and metropolitan region to the countryside.
The distribution of deaths by external causes according to their circumstances and health regions, there was an increase of deaths mainly from accidents and undetermined intention in the state countryside and PE. This fact may confirm the dis-placement of the occurrence of deaths from external causes for the state countryside.
Regarding the nature of the injury due to deaths from exter-nal causes of undetermined intent, we highlight those classi-fied as “other/unspeciclassi-fied” in PE and in the 1st HR, in the
peri-od 2011-2013. In this case, it is noteworthy that the 1st HR has
an Institute of Legal Medicine (ILM), located in Recife, capital of PE, responsible for performing most autopsies in cases of deaths from external causes in the state. This data may dem-onstrate the fragility of the registration by ILM professionals or failure in the epidemiological investigation of cases. It can also mask the true situation of mortality from external causes.
REFERENCES
1. Tristão KM, Leite FMC, Schmildt ER, Leite EC, Castro DS, Vi-lela APM. [Mortality due to external causes in the micro-Re-gion of São Mateus, state of Espírito Santo, Brazil: trends from 1999 to 2008]. Epidemiol Serv Saúde [Internet]. 2012 Jun [cited 2014 Dec 18];21(2):305-13. Available from: http://sci elo.iec.pa.gov.br/pdf/ess/v21n2/v21n2a13.pdf Portuguese.
2. Ministério da Saúde (BR). Sala de Apoio à Gestão Estraté-gica. Indicadores de mortalidade [Internet]. Brasília (DF): Ministério da Saúde; [cited 2013 May 01]. Available from: http://189.28.128.178/sage/.
3. Mascarenhas MDM, Monteiro RA, Sá NNB, Gonzaga LAA, Neves ACM, Roza DL, et al. Epidemiologia das causas exter-nas no Brasil: mortalidade por acidentes e violências no perí-odo 2000 a 2009. In: Ministério da Saúde (BR), Secretaria de Vigilância em Saúde, Departamento de Análise de Situação em Saúde. Saúde Brasil 2010: uma análise da situação de saú-de e saú-de evidências selecionadas saú-de impacto saú-de ações saú-de vigi-lância em saúde [Internet]. Brasília (DF): Ministério da Saúde; 2011 [cited 2014 Dec 18]. p. 225-49. Available from: http:// bvsms.saude.gov.br/bvs/publicacoes/saude_brasil_2010.pdf
4. Minayo MCS. Seis características das mortes violentas no Brasil. Rev Bras Estud Popul [Internet]. 2009 Jan-Jun [cited 05 May 2013];26(1):135-40. Available from: http://www. scielo.br/pdf/rbepop/v26n1/v26n1a10.pdf
5. Campos-Silva T, Oliveira RC, Abreu DMX. [Analysis of quality of information about mortality by injuries in Minas Gerais from 1997 to 2005]. Cad Saúde Colet [In-ternet]. 2010 [cited 2013 Apr 02];18(3):371-9. Available from: http://www.cadernos.iesc.ufrj.br/cadernos/images/ csc/2010_3/artigos/CSCv18n3_pag371-9.pdf Portuguese.
6. Lozada EMK, Mathias TAF, Andrade SM, Aidar T. [Data on mortality from external causes and events of undetermined intent, Paraná State, Brazil, 1979 to 2005]. Cad Saúde Pú-blica [Internet]. 2009 Jan [cited 2013 Apr 02];25(1):223-8. Available from: http://www.scielo.br/pdf/csp/v25n1/24.pdf Portuguese.
7. Jorge MHPM, Gotlieb SLD, Laurenti, R. [The national mor-tality information system: problems and proposals for solving them II - Deaths due to external causes]. Rev Bras Epidemiol [Internet]. 2002 Aug [cited 2013 May 06];5(2):212-23. Avail-able from: http://www.scielo.br/pdf/rbepid/v5n2/08.pdf Portuguese.
8. Cerqueira, D. Mapa dos Homicídios Ocultos no Brasil. Bra-sília (DF): Instituto de Pesquisa Econômica Aplicada; 2013.
9. Ministério da Saúde (BR). Portaria nº 116, de 11 de fevereiro de 2009. Regulamenta a coleta de dados, fluxo e periodici-dade de envio das informações sobre óbitos e nascidos vi-vos para os Sistemas de Informação em Saúde sob gestão da
Secretaria de Vigilância em Saúde [Internet]. Diário Oficial da União 12 2009 Feb [cited 2013 May 05]. Available from: http://bvsms.saude.gov.br/bvs/saudelegis/svs/2009/prt011 6_11_02_2009.html
10. Mendes JDV. Mortalidade por causas externas no Estado de São Paulo em 2010. Boletim Eletrônico do GAIS [Internet]. 2012 Apr [cited 2013 Jun 02];4(13):1-9. Available from: http://portal.saude.sp.gov.br/resources/ses/perfil/profissio nal-da-saude/destaques//gais_jornal_13.pdf
11. Waiselfisz JJ. Mapa da violência 2012: os novos padrões da violência homicida no Brasil. São Paulo (SP): Instituto Sagari; 2011.
12. Soares Filho AM. Homicide victimization according to ra-cial characteristics in Brazil. Rev Saúde Pública [Internet]. 2011 Aug [cited 2013 May 06];45(4):745-55. Available from: http://www.scielo.br/pdf/rsp/v45n4/en_2640.pdf.
13. Souza ER, Lima MLC. The panorama of urban violence in Brazil and its capitals. Cienc Saúde Colet [Internet]. 2006 Apr-Jun [cited 2013 Jun 01];11(2)363-73. Available from: http://www.scielo.br/pdf/csc/v11n2/30424.pdf
14. Villela LCM, Moraes SA, Suzuki CS, Freitas ICM. Homicide mortality trends in Belo Horizonte and Metropolitan Area: 1980- 2005. Rev Saúde Pública [Internet]. 2010 Jun [cited 2013 Jun 01];44(3):486-95. Available from: http://www.sci elo.br/pdf/rsp/v44n3/en_AO1121.pdf
15. Bacchieri G, Barros AJD. Traffic accidents in Brazil from 1998 to 2010: many changes and few effects. Rev Saúde Pública [Internet]. 2011 Oct [cited 2013 Jun 01];45(5):949-63. Avail-able from: http://www.scielo.br/pdf/rsp/v45n5/en_2981.pdf
16. Vidal CEL, Gontijo ECDM, Lima LA. [Attempted sui-cide: prognostic factors and estimated excess mortality]. Cad Saúde Pública [Internet]. 2013 Jan [cited 2013 May 15];29(1):175-87. Available from: http://www.scielo.br/pdf/ csp/v29n1/20.pdf Portuguese.
17. Melo CM, Bevilacqua PD, Barletto M. [Production of in-formation on mortality from external causes: meanings and significances in the filling out of death certificates]. Cienc Saúde Colet [Internet]. 2013 May [cited 2013 May 06];18(5):1225-34. Available from: http://www.scielo.br/ pdf/csc/v18n5/07.pdf Portuguese.
18. Cerqueira D. Mortes violentas não esclarecidas e impuni-dade no Rio de Janeiro. Economia Aplicada [Internet]. 2012 Apr-Jun [cited 2013 May 06];16(2):201-35. Available from: http://www.scielo.br/pdf/ecoa/v16n2/v16n2a01.pdf