Decline and Unevenness of Infant Mortality
in Salvador, Brazil,
1980-198S1
JAIRNILSON SILVA PAIM~ & MARIA DA CONCEI@O
N.COSTAR
444
Data relating to infant mortality in Salvador, Brazil, were analyzed in order to determine how infant mortality evolved in various parfs of the city during the period 1980-1988. This analysis showed sharp drops in the numbers of infant deaths, proportional infant morfality (infant deaths as a percentage of total deaths), and fhe infant mortality coefficient (infant deaths per thousand live birfhs) during the study period despite deteriorating economic
conditions. It also suggested that while these declines occurred throughout the city, the overall distribution of infant mortality in d#erent reporting zones remained uneven. Among other things, fhese findings call attention to a need for further investigation of the roles played by various health measures (including immunization, control of respiratory and diarrhea1 diseases, encouragement of breast-feeding, and monitoring of growth and devel- opment) and of reduced fertility (resulting from birth spacing, use of contraceptives, and female sterilization) in bringing about declines in infant mortality during hard economic times.
I
nfant mortality studies in the Region of the Americas have revealed a downward trend with persisting geo- graphic and social inequalities (1-3). Us- ing different methodologies (4-6), stud- ies done in Brazil have yielded results consistent with this trend. In general, Brazilian data since 1940 show declines‘Edited version of a paper presented in “Coordi- nated Communications” of the 1st Brazilian Con- gress of Epidemiology (ABRASCO.DMPS/FCM/ UNICAMP) held in Campinas, Slo Paulo, Brazil, on 2-6 September 1990. This contribution will also be published in Portuguese in the B&tin de la Ofi- cina Sanitaria Panamericana, vol. 114, no. 3, 1993. 2Associate Professor, Department of Preventive Medicine, School of Medicine, Federal University of Bahia. Researcher, National Council for Scien- tific and Technologic Development, Brazil. Cor- respondence should be addressed to Dr. Paim at Departamento de Medicina Preventiva da Facul- dade de Medicina da Universidade Federal da Bahia; Rua Padre Feijb; 29 4” andar 40140; Salvador, Bahia, Brazil.
3Associate Professor, Department of Preventive Medicine, School of Medicine, Federal University of Bahia. Technical Adviser, Health Information Center, State Secretariat of Health, Bahia.
in both the infant mortality coefficient (IMC, the number of infant deaths per thousand live births) and proportional in- fant mortality (PIM, the number of infant deaths per hundred total deaths) (7). These declines tended to level off in the mid- 196Os, especially in SBo Paula, and later in other state capitals (g-20), before re- suming in the 197Os, especially in the sec- ond half of the decade.
Becker and Lechtig (11), examining the evolution of infant mortality in Brazil from 1977 through 1984, indicated that “while on the one hand the last decade saw a greater proportional reduction of this coefficient, in recent years there has been an interruption in the downward trend, with a reversal of the curve beginning in 1983.” Their results indicated that “the North and Northeast regions were those with the greatest absolute reductions from 1977 to 1982 and also had the greatest increases from 1982 to 1984” (II), leading the authors to suggest a relationship with the economic recession beginning in 1983.
A 1988 UNICEF publication (12), draw- ing on a battery of indicators, showed
that both the infant mortality coefficient and mortality among children under five years of age had continued to decline in most countries, including Brazil, despite the recession. (The estimated infant mor- tality coefficient in Brazil in 1986 was 65 deaths per 1 000 live births.) These find- ings serve to reaffirm the complex nature of the determinants of infant mortality- especially when factors such as reduction in the birth rate, wider spacing of preg- nancies, expansion of basic sanitation, health services interventions, and so forth are operating at the same time as chang- ing living conditions.
The purpose of the study reported here was to examine how infant mortality evolved in various areas of Salvador, cap- ital of the state of Bahia, during the pe- riod 1980-1988 by estimating changes in proportional infant mortality and the in- fant mortality coefficient in different parts of the city.
MATERIALS
AND METHODS
Salvador, situated in the Northeast Re- gion, was the Brazilian state capital with the third-largest recorded population (1 945 467 inhabitants) in 1988. The re- search project described below obtained data on total deaths and infant deaths (deaths of children less than one year old) from publications of the Ministry of Health for 1980-1985 (23) and from the Center for Health Information (CIS) of the Secretariat of Health of the State of Bahia (SESAB) for 1986-1988.
Data used to study the distribution of infant deaths in 76 reporting zones of Salvador were obtained by reviewing the death certificates of Salvador residents from 1980 through 1988. The 76 reporting zones, corresponding to those shown on maps prepared by the Salvador Metro- politan Development Company (Com- panhia de Desenvolvimento da Regiao Metropolitana de Salvador-CONDER),
divide Salvador on the basis of various administrative, planning, and physical urbanization criteria while retaining com- patibility with census districts of the Bra- zilian Institute for Geography and Statis- tics (IBGE). Total deaths and infant deaths were codified and aggregated by zone, based on the decedent’s place of resi- dence, according to a procedure used in a previous study that has been described elsewhere (24). Zones 45, 46, 56, and 72 (see Annex and Figures l-4) were ex- cluded from the infant mortality coeffi- cient portion of the study because they presented an infant mortality coefficient equal to zero in 1988 and had low pop- ulation densities.
The data were analyzed in terms of variations in proportional infant mortal- ity and the infant mortality coefficient. To study changes in proportional infant mortality during the study period, the reporting zones were separated into quartiles using 1980 data. That is, each zone was placed into a quartile where the proportional infant mortality in 1980 was “low” (3.9 to 17.1 infant deaths per 100 total deaths), “intermediate” (17.9 to 25.8), “high” (26.5 to 37.5), or “very high” (37.5 to 52.5); the average value for each quar- tile was calculated; and then the average value for each quartile was calculated again using 1988 data. This made it possible to show estimated changes in the quartiles from 1980 to 1988, as well as changes in all the reporting zones.
For the purpose of deriving infant mor- tality coefficients, the live birth rates em- ployed were the city-wide rates used by the CISKESAB. For 1980 the rate was 33.4 live births per 1 000 inhabitants, and for all years in the 1981-1988 period the rate was 31.4 per 1 000.
In a manner similar to that described above, reporting zones were classified by quartile in terms of their infant mortality coefficients (deaths per thousand live births) for 1980, the value ranges for the
quartiles being4.9-27.9,28.8-53.9,54.1- 80.8, and 89.4-333.3 infant deaths per 1 000 live births. The average values for each quartile were then calculated, first for 1980 and then for 1988.
These procedures generated certain distortions that call for caution in inter- preting the results. To begin with, the proportional infant mortality figures de- rived in this manner could have been in- fluenced by changes in the general pop- ulation’s age structure and also by changes in the mortality of those at least one year of age. In addition, regarding the coef- ficient of infant mortality, the practice of assuming a uniform birth rate in all of the reporting zones and throughout the 1981- 1988 period presumably intro- duced distortions, as it is unlikely that the birth rate was uniform-either in all the zones or throughout the 1981-1988 period.
The reason such problems were hard to avoid is that data on the Salvador pop- ulation’s age structure and birth rate are not broken down by reporting zone. Such information will only become available in the future, when data from the 1991 cen- sus are released. The possible distortions
arising from use of the limited data cur- rently available are described in more de- tail in the Discussion and Conclusions.
RESULTS
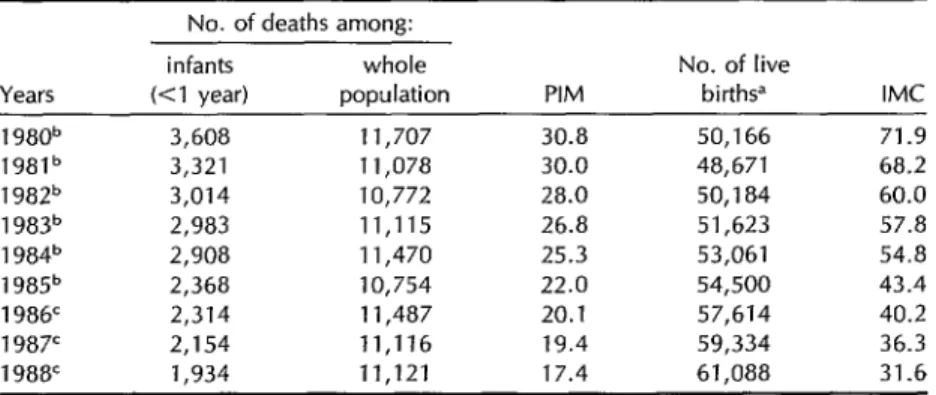
Table 1 shows sharp drops in both pro- portional infant mortality and infant mor- tality coefficients over the course of the study period. Specifically, proportional infant mortality fell from 30.8% of total mortality in 1980 to 17.4% in 1988, a re- duction of 43.5%; and the coefficient of infant mortality fell from 71.9 deaths per thousand live births in 1980 to 31.6 in 1988, a decline of 56.1%. It should also be noted that these downward trends are supported by a steady reduction in the absolute numbers of infant deaths throughout the period.
Table 2 shows declines in the propor- tional infant mortality found for each of the reporting zone quartiles (9). As may be seen, the apparent rates of decline were greatest in the three quartiles having “in- termediate,” “high,” and “very high” proportional infant mortality in 1980, al- though an uneven distribution of infant
Table 1. Changes in the numbers of infant deaths, numbers of total deaths, proportional infant mortality (PIM), and infant mortality coefficients (IMC) in Salvador, Brazil, 1980-l 988.
Years
No. of deaths among: infants whole
(Cl year) population PIM
No. of live
births” IMC 1 980b 3,608 11,707 30.8 50,166 71.9 1981b 3,321 11,078 30.0 48,671 68.2 1 982b 3,014 10,772 28.0 50,184 60.0 1983” 2,983 11,115 26.8 51,623 57.8 1 984b 2,908 11,470 25.3 53,061 54.8 1 985b 2,368 10,754 22.0 54,500 43.4 1986’ 2,314 11,487 20.1 57,614 40.2 1987’ 2,154 11,116 19.4 59,334 36.3 1988’ 1,934 11,121 17.4 61,088 31.6 Wntil 1980 SESAB used a crude annual birth rate of 33 4 births per 1,000 inhabitants, and from 1981 through 1988 it used a crude rate of 31.4 per 1,000.
bMinistry of Health (13).
CCIS/SESAB, preliminary data subject to revision.
Table 2. Changes in proportional infant mortality (PIM) in the “low,” “inter- mediate,” “ high,” and “very high” 1980 PIM quartiles, showing averages for those quartiles in 1980 and 1988.
Averages for 1980 PIM quartiles in:
1980 PIM auartile 1980 1988 % change “LOW” (3.9-17.1) 11.8 9.0 -23.7 “intermediate” (17.9-25.8) 21.7 12.9 -44.7 “High” (26.5-37.5) 31.4 21.5 -31.5 “Very high” (37.5-52.5) 42.5 22.7 -46.6
Figure 1. 1980 proportional infant mortality in Salvador by reporting zones, showing zones in different quartiles (“low” = 3.9-l 7.1%, “intermediate” = 17.9-25.8%, “high” = 26.5-37.5%, and “very high” = 37.5-52.5%).
PROPORTIONAL INFANT MORTALITY (PIM) 1980 BY REPORTING ZONES
q
39-1710/oq 179-2580/o
q
265-375010375-5250/o
0
or Areas excluded from this porl~on of sludvFigure 2. 1988 proportional infant mortality in Salvador by reporting zones, showing zones below the maximum values of the former (1980) quartiles (“low” 5 17.1%, “intermediate” =
17.2-25.8%, “high” = 25.9-37.5%, and “very high” = 37.5-52.5%).
PROPORTIONAL INFANT MORTALITY (PIM). 1988, BY REPORTING ZONES
q
* Areas excluded from this port1011 of studydeaths appeared to persist in the differ- ent quartiles in 1988.
The Figure 1 map shows the geo- graphic location of the reporting zones within each quartile, the upper limits of proportional infant mortality in 1980 being 17.1% in the “low” quartile, 25.8% in the “intermediate” quartile, 37.5% in the “high” quartile, and 52.5%4 in the “very higlY’ quartile.
*The only exception to this upper Iimit occurred in zone 67 (see Annex), where the number of live births was very small.
These upper limits were used to pre- pare the Figure 2 map, which shows the geographic location of reporting zones where the upper limits of proportional infant mortality were 17.1%, 25.8%, 37.5%, and 52.5% according to the 1988 data. Comparison of these two figures shows a marked reduction in the areas with “high” proportional infant mortality in 1988 and a near-absence of areas with “very high” proportional infant mortality.
Table 3 shows declines in the average infant mortality coefficients found for each
Table 3. Changes in infant mortality coefficients (IMC) in the “low,” “inter- mediate,” “high,” and “very high” 1980 IMC quartiles, showing averages for those quartiles in 1980 and 1988.
Averages for 1980 IMC quartiles in: 1980 IMC quartile 1980 1988 “LOW” (4.9-27.9) 18.7 18.2 “Intermediate” (28.8-53.9) 42.6 21.7 “High” (54.1-80.8) 65.9 26.4 “Very high” (89.4-333.3) 120.3 58.8
% change -2.7 -49.1 - 59.9 -51.1
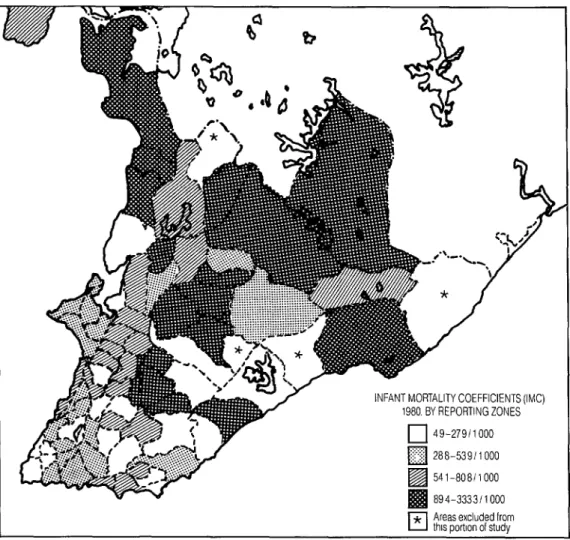
Figure 3. 1980 infant mortality coefficients in Salvador by reporting zones, showing zones in different quartiles (“low” = 4.9-27.9 infant deaths per 1 000 live births, “intermediate” = 28.8-53.9, “high” = 54.1-80.8, “very high” = 89.4-333.3).
q
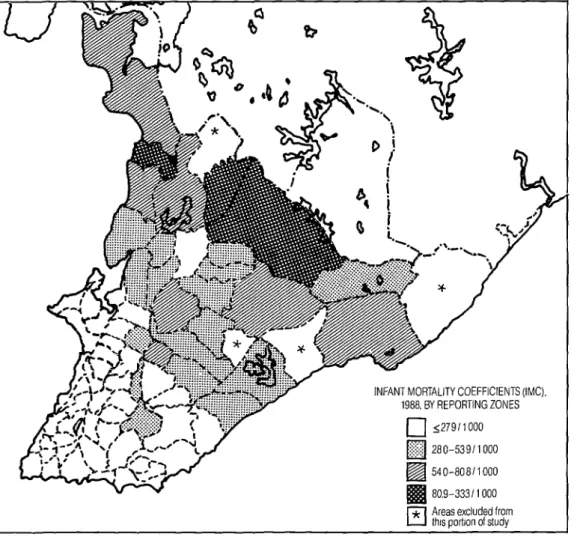
* Areas excluded from this porilon of studyof the reporting zone quartiles during the Finally, the Figure 3 and 4 maps, con- study period, these declines being mark- structed in the same manner as the Fig- edly greater in the zone quartiles with ure 1 and 2 maps but using infant mor- “intermediate,” “high,” and “very high” tality coefficients instead of proportional coefficients than in the zone quartile infant mortality, indicate a marked re- with “low” coefficients, where the ob- duction of the areas with “very high” served decline (2.7%) was small. Even infant mortality coefficients (above 80.8 so, average infant mortality coeffi- infant deaths per thousand live births) as cients remained unequally distributed of 1988 in comparison to 1980, and a in 1988, ranging from 18.2 infant deaths marked increase in the areas with “low” per thousand live births in the “low” and “intermediate” coefficients below the quartile to 58.8 in the “very high” quar- respective upper limits of 27.9 and 53.9 tile. infant deaths per thousand live births.
Figure 4. 1988 infant mortality coefficients in Salvador by reporting zones, showing zones below the maximum values of the former (1980) quartiles (“low” 5 27.9 infant deaths per 1 000 live births, “intermediate” = 28.0-53.9, “high” = 54.0-80.8, “very high” = 80.9-333.3).
DISCUSSION
AND
CONCLUSIONS
The results of this study show a decline in mortality among Salvador infants in the 1980-1988 period, a decline reflected by declines in both proportional infant mortality and infant mortality coefficients in all of the quartiles studied. Although these results should be interpreted with caution, it should be noted that the de- clines registered in proportional infant mortality were not affected by inaccura- cies in the live birth rate, this rate not being employed in calculating propor- tional infant mortality. And although ap- parent declines in proportional infant mortality could be artificially increased by increased mortality in noninfant age groups, no such increase was noted in Salvador over the course of the study pe- riod. Moreover, when one observes the numbers of infant deaths in each year during the study period (see Table l), one finds a downward trend that is man- ifested regularly throughout the period. (Downward trends in infant mortality have also been observed elsewhere in Brazil-notably in Fortaleza, Recife, Belo Horizonte, Rio de Janeiro, and S&o Paulo over the period 1980-1987 (15, 26). Other recent studies in Brazil (17-22) point in the same direction.)
This downward trend, found in most areas of the city (see Annex), is also ev- ident in the above analysis of propor- tional infant mortality and the infant mortality coefficient by quartiles. This quartile analysis, the limitations of which have been noted, shows reductions in all the quartiles examined (in both propor- tional infant mortality and infant mortal- ity coefficients); and it also suggests that inequalities persist within the different zones of the city.
Regarding the above-mentioned limi- tations, it seems especially possible that the true differences in the infant mortal-
ity coefficient in different zones of the city were actually less than those differ- ences indicated by the results. Many ex- amples of negative correlations between high birth rate and income and also of positive correlations between infant mor- tality on the one hand and a high birth rate and high overall fertility on the other have been reported in the literature (I, 23-25).
Consequently, it would be logical to expect relatively high birth rates in zones with low average incomes and high in- fant mortality; and since the 1980 Salva- dor quartiles with the highest infant mortality coefficients had the highest proportions of low-income families (26), it certainly seems possible that the true infant mortality coefficients in these quartiles could have been lower than those found, since it had been assumed that the rate of live births in all of the quartiles was the same. Conversely, the true in- fant mortality coefficients for the quar- tiles with “low” and “intermediate” val- ues could have been higher than those found, because the rates of live births in those quartiles could have been lower.
Even interpreting the results with res- ervations, it should be noted that in 1988 there were marked differences in the fig- ures for low and high quartiles. That is, the 1980 quartile with the lowest pro- portion of infant mortality showed an av- erage value of 9% in 1988, while the quar- tile with the highest showed an average value of 22.7%. Similarly, the 1980 quar- tile with the lowest coefficient of infant mortality showed an average value of 18.2 deaths per thousand live births in 1988, white the quartile with the highest showed an average value of 58.8. This evidence strongly suggests uneven distribution of infant mortality in Salvador.
Moreover, prior work by our group (26) demonstrated that in the 1980 quartile where proportional infant mortality was highest, 98% of the families had an in-
come less than five times the minimum wage, and 43% of the people lived in substandard housing (shacks). They tended to consume less water (an aver- age of 64 liters per person per day) than those in the other quartiles, had an av- erage of only two physicians per 10 000 inhabitants at health centers and posts, and had only 0.4 hospital beds per 1 000 inhabitants.
In contrast, only 23% of the families in the quartile with the lowest proportional infant mortality earned less than five times the minimum wage, and only 2% of the people lived in shacks. Also, people in this quartile tended to consume more water (an average of 110 liters per day), had an average of six physicians per 10 000 inhabitants at health centers and posts, and had four hospital beds for every 1 000 residents. Analysis of correlations be- tween these variables yielded statistically significant values (26).
Though the initial aim of this study was not to analyze factors responsible for the decline and persistently uneven dis- tribution of infant mortality in Salvador, some ideas on this subject merit discus- sion because they could heIp to orient future studies.
Since the mid-1980s a decline in infant mortality has been observed in Latin America. Indeed, several studies have been performed and meetings held in or- der to assess this trend. The basic prob- lem was how to explain the downward trend in infant mortality during a period of economic crisis, when there was a si- multaneous deterioration of living con- ditions in many of the countries in- volved.
Studies brought together in a PAHO publication (27) suggested that specific primary health care interventions would have a positive impact in reducing infant mortality, even under adverse socioeco- nomic conditions. Writing from another perspective, Taucher (28) highlighted the
impact of a decline in fertility on infant mortahty, theorizing that “greater spac- ing between births and the decline in fer- tility that can be attained with contracep- tion will diminish the proportion of Iive births with high risk of death.” On ana- lyzing the situation in Chile, where fer- tility fell 23% from 1972 to 1978, she called attention to the fact that women “who have children at excessively early or late ages, have them in rapid succession, or have children with high birth orders ex- pose them to a greater risk of death within the economic stratum to which they belong.”
In the case of Salvador’s state, Bahia, during the first half of the 1980s the pop- ulation experienced recession, declining real wages, unemployment, and concen- tration of income. In Salvador itself there was no expansion of the water supply network during the 1980-1988 period, a time in which the percentage of resi- dences linked to the city’s sewer system was among the lowest found in any of Brazil’s state capitals (29).
All this suggests a strong need to in- vestigate how expansion of certain health measures-immunizations, control of diarrhea1 diseases through ora rehydra- tion therapy, encouragement of breast- feeding, control of acute respiratory in- fections, and monitoring of growth and development, among others-may have contributed to reducing infant mortality in Salvador. It also seems noteworthy that there was a marked decline in fertility during the early 1980s in Brazil, espe- cially in the Northeast (3U), as a result of voluntary and induced demand for con- traceptives combined with a high rate of female sterilization (31, 32). Even women with a relatively low level of education registered a 12% drop in fertility in the Northeast during the first years of the 198Os, and in Salvador fertility fell 20% from 1980 to 1984 (33). Therefore, the role of reduced fertility in bringing about the
considerable fall in infant mortality dur- ing the study period is something that urgently needs further examination. (With regard to specific actions, swift dissemi- nation of knowledge about birth spacing, expansion of immunizations, and the spread of oral rehydration therapy were all significant interventions of the 1980s in Salvador that were directed at im- proving infant health.)
In general, future studies seeking to investigate the influence of these various factors should consider that “the decline in infant mortality merits a more detailed analysis in at least two dimensions: a longer time series needs to be evaluated, so as to better assess the trend, and an analytical frame of reference is needed that considers the possibility of reductions in infant mortality occurring simultaneously with increases in unemployment rates and concentration of income” (34).
It should also be noted that despite evidence of progressively reduced infant mortality in most parts of Salvador over the course of the study period, as the 1980s drew to a close the unequal distri- bution of infant deaths persisted. Com- parison of the 1988 results with those of the early 1980s suggests that adverse so- cial conditions continue to affect infant mortality within certain segments of the population.
Acknowledgments. The authors would like to express special gratitude to public health nurse Maria Roseilda Bispo Bar- reto da Silva for assistance in data col- lection and to Dr. Carlos Mauricio Car- deal Mendes for technical assistance with the data analysis and map preparation.
REFERENCES
1. Barros FC, Victora CG. Epidemiologia da satide infanfil: urn manual para diagnosficos comunifdrios. 50 Paulo: HUCITECUNI- CEF; 1991:19.
2. Riveron Corteguera R, Rfos Massabot NE, Carpio Sabatela R. Infant mortality in Cuba, 1969-1988. Bull Pan Am Health Or- gan. 1989;23(3):273-283.
3. Gonzales Perez G, Gonzales AMG, Vila- rreal MJ. Fatores socio-economicos y mor- talidad infantil en Equador, 1970-1981. Rev Salide Publica (Sao Paula). 1988;22: 273-280.
4. Ortiz LP. Estimativas da mortalidade in- fantil atraves do metodo do filho previo. In: Associacao Brasileira de Estudos Po- pulacionais. Anais, VI Encontro National de Esfudos Populacionais, Olinda-Pe, 16 a 20 de oufubro de 1988 (vol 4). Olinda: 1988: 433-450.
5. Sirnoes CC. Novas estimativas da mor- talidade infantil, 1980-87. In: Brasil, Se- cretaria de Planejamento e Coordenacao da Presidencia da Repdblica; Fundacao Instituto Brasileiro de Geografia e Estatis- tica; UNICEF. Perjil esfafistico de criangas e mlies no Brasil: mortalidade infanfil e satide no decada de 80. Rio de Janeiro: IBGE; 1989: 14-48.
6. Teixeira P, Perillo SR. Mortalidade infantil recente estimada em Teresina: avaliacao dos resultados face ao context0 nordes- tino. In: Associacao Brasileira de Estudos Populacionais. Anais, VI Enconfro National de Esfudos Populacionais, Olinda-Pe, 16 a 20 de oufubro de 1988 (vol 4). Olinda: 1988: 221-236.
7. Yunes J, Ronchezel VS. EvolucBo do mor- talidade geral, infantil e proportional do Brasil. Rev Satide Publica (Sdo Paulo). 1974; 8(suppl 1):3-48.
8. Paim JS. Estrutura da mortalidade infantil proportional no Brasil. Rev Baiana Satide Publica (Salvador). 1985;12(4):84-97. 9. Paim JS, Costa MCN. Variacao da mor-
talidade infantil em diferentes capitais brasileiras (1960-1979). Rev Baiana de Salide Publica (Salvador). 1982;9(3-4):125-135. 10. Yunes J. EvolucBo da mortalidade infantil
proportional no Bras& Pediatria (Sao Paula). 1981;3(1):42-53.
11. Becker RA, Lechtig A. Brasil: evolu@o da morfalidade infantil no period0 de 1977-1984. Brasflia: Ministerio da Satide, Secretaria National de Acbes Basicas de Satide, Div- isao National de Epidemiologia, Centro de Documentagao do Ministerio da Saude; 1986. (S&e C, estudos e projectos, 3). 12. Grant JP. Situacao mundial da infkia 1988.
Brasilia: UNICEF; 1988.
13. Brasil, Minis&i0 da Sabde, Secretaria National de AFoes Basicas de Saiide, Div- isao National de Epidemiologia. Esfaffs- ticas de mortalidade: Brasil U980,1981,1982, 1983, 2984, 1985). Brasilia: Centro de Do- cumenta@o do Ministerio da Saude. (Se- rie 6: estatistica e informa@o em sadde, nos. 3, 7, 8, 9, 15, 16).
14. Paim JS, Costa MCN, Cabral V, Mota IA, Neves RBB. Mortalidade infantil propor- cional: Salvador, Bahia, Brasil. Bol Of Sanif Panam. 1987;103(2):113-122.
15. Becker RA. Brasil: tendencias recentes das causas de mortalidade na infancia. In: Brasil, Secretaria de Planejamento e Coor- denacbo da Presidencia da Republica; Funda@o Instituto Brasileiro de Geografia e Estatistica; UNICEF. Perjil esfaffstico de criaqas e maes no Brasil: mortalidade infanfil e salsde no decada de 80. Rio de Janeiro: IBGE; 1989:55-83.
16. Simbes CCS, Oliveira LAP. Algumas in- dicacoes sobre a mortalidade infantil no Nordeste nos primeiros anos da decada de 80. In: Associacao Brasileira de Estudos Populacionais. Anais, VI Enconfro National de Estudos Populacionais, Olinda-Pe, 16 a 20 de outubro de 1988 (vol 4). Olinda: 1988: 155-161.
17. Drumond M Jr, Morais Neto OL. Morte infantil e espaco urbano: o municfpio de Belo Horizonte na decada de 80. In: As- sociacao Brasileira de Sadde Coletiva; De- partamento de Medicina Preventiva e SociaVFaculdade de Ciencias Medicas/ Universidad de Campinas. Programa: lo Congresso Brasileiro de Epidemiologia- epidemiologia e desigualdade social: OS desafios do final do skulo. Campinas, SBo Paulo: 1990. (Summary 54).
18. Duarte CML. Como morrem as criancas do Rio de Janeiro? In: Associa@o Brasi- leira de Sadde Coletiva; Departamento de Medicina Preventiva e Social/Faculdade de Ciencias MedicasKJniversidad de Cam- pinas. Programa: lo Congresso Brasileiro de Epidemiologia-epidemiologia e desigualdade social: OS desafios do final do seculo. Campi- nas, Sao Paulo: 1990. (Summary 55). 19. Govern0 de Sergipe, UNICEF. Criancas e
adolescenfes em Sergipe: a sazide, a educacao, o trabalho. Aracajd: 1990:6-S.
20. Oliveira LP. A mortalidade infantil re- cente e a dinamica social. In: Bras& Se- cretaria de Planejamento e Coordena@o da Presidencia da Republica; FundacBo
Instituto Brasileiro de Geografia e Estatis- tica; UNICEF. Per@ esfatfsfico de criancas e m&es no Brasil: mortalidade infantil e saride na decada de 80. Rio de Janeiro: IBGE; 1989: 49-54.
21. Ortiz LP. A mortalidade infantil em SBo Paul0 durante o period0 1975-87. In: Bra- sil, Secretaria de Planejamento e Coor- denaclo da Presidencia da Repbblica; Funda@o Institute Brasileiro de Geografia e Estatfstica; UNICEF. Perfil estatfsfico de criaqas e mries no Brasil: morfalidade infanfil e salide na decada de 80. Rio de Janeiro: IBGE; 1989:84-90.
22. Szwarcwald CL, Castilho EA, Pinto CB. Caracteristicas da mortalidade no Estado do Rio de Janeiro, 1977-86. In: Brasil, Se- cretaria de Planejamento e Coordenacao da Presidencia da Repbblica; Funda@o Instituto Brasileiro de Geografia e Estatis- tica; UNICEF. Perfil estatktico de criangas e maes no Bras& morfalidade infanfil e satide no decada de 80. Rio de Janeiro: IBGE; 1989: 91-102.
23. Schlarepfer-Pedrazzini L, Bobadilla JL. Relation entre patrones reproductivos y mortalidad infantil: interpretaciones al- temativas. Salud Pub Mex. 1990;32(4): 381-394.
24. Solis JA. Salud maternoinfantil y planifi- cation familiar. In: Salud maternoinfantil y afencion primaria en las Americas: hechos y tendencias. Washington, DC: Organiza- cion Panamericana de la Salud; 1984:178- 193. (PAHO scientific publication 461). 25. Breilh J, Granda E, Campana A, Betan-
court 0. Ciudad y muerfe infantil: investi- gacion sobre el deferioro de la salud en el cap- ifalismo afrasado: un mefodo. Quito: Centro de Estudios y Asesorfa en Salud; 1983. 26. Paim JS, Costa MCN, Cabral V, Mota I,
Neves RBB. Spatial distribution of pro- portional infant mortality and certain so- cioeconomic variables in Salvador, Bahia, Brazil. Bull Pan Am Health Organ. 1987; 21(3):225-239.
27. Organization Panamericana de la Salud. Salud maternoinfan til y afencion primaria en las Americas: hechos y tendencias. Washing- ton, DC: 1984. (PAHO scientific publica- tion 461).
28. Taucher E. Mortalidad infantil en Chile. In: Pan American Health Organization/ World Health Organization. Taller regional sobre esfrategias de afencion primaria y mor- falidad de1 nirio (vol I). Mexico City: 1984.
29.
30.
31,
Bahia; Govern0 do Estado; Secretaria do Planejamento, CiQncia e Tecnologia- Coordena@io Central de Planejamento. Piano esfraft?gico de a@o: 1988-1991. Sal- vador: 198835-85.
Arruda JM, Morris L, Ferraz EA, Gold- berg H. Tendkicias recentes da fecundi- dade e do planejamento familiar na Re- giio Nordeste 1980-1986. In: AssociacBo Brasileira de Estudos Populacionais. An- ais, VI Enconfro National de Esfudos Popu- lacionais, Olinda-Pe, 16 a 20 de oufubro de 1988 (vol 4). Olinda: 1988:111-136. Berquo E. A esteriliza@o feminina do Bra- zil hoje. In: Conselho National dos Dir- eitos da Mulher. Quando a paciente e mu- lher: relafdrio do Encontro National de Satide da Mulher: urn direito a ser conquistado (4” mesa). Brasilia: 1989:79-85.
32.
33.
34.
Silva NLP, Oliveira LAP, Sirnoes CCS. OS metodos anticonceptivos coma urn dos fa- tores de redu@o de fecundidade nordes- tina na decada de 80. In: Associacho Bras- ileira de Estudos Populacionais. Anais, VI Encontro National de Estudos Populacionais, Olinda-Pe, 16 a 20 de outubro de 1988 (vol 4). Olinda: 1988:137-153.
Santos, TF. Tendencias recentes da fe- cundidade na Regiao Nordeste e regioes metropolitanas: Fortaleza, Recife e Sal- vador. In: Associacao Brasileira de Estu- dos Populacionais. Anais, VI Enconfro Na- cional de Estudos Populacionais, Olinda-Pe, 26 a 20 de outubro de 2988 (vol 9). Olinda: 1988:91-110.
Brasil. Mortalidade infantil. R4DIS: Da- dos. Rio de Janeiro: 1986.
Annex. Total deaths, infant deaths, live births, proportional infant mortality (PIM), and infant mortality coefficient (IMC), by reporting area and year in Salvador, Brazil, 1980 and 1988.
1980 1988
Infant Infant Total deaths Live Total deaths LlVe
Reporting areas deaths (<l year) births PIM IMC deaths (<l year) berths PIM IMC 1 2 3 4-5 6 7 8 9 10 11-12 13 14 15 16 17 18 19 20 21 Barra Jardim Apipema,
Mono do Gato, Morro do lpiranga Ondina
Rio Vermelho Amaralina Nordeste de
Amaralina Pituba Vithria, Camp0
Grande Craga
Federa@o, Engenho Velho da Federac%o, Slo Lkaro, Alto das Pombas Cardeal, Horto
Forestal Canela Centro HistClnco Garcia Barris
Engeno Velho de Brotas, Vila America Acupe Brotas Itaigara, Parque
Nossa Senhora da Luz
199 20 I 207 10.1 16.6 137 11 1 252 a.0 a.8 36 13
31 8 199 47 89 16
3 5 8 28 295 a7
158 27
38 14 51 98 2 8
433 36.1 30.0 39 181 25.8 44.2 31 664 23.6 70.8 143 960 18.0 16.7 214 1 303 29.5 66.0 154 831 17.1 32.5 176 303 3.9 6.6 29 454 a.2 17.6 108
2 4
525 7.7 5.7 219 16.1 22.8 811 5.6 9.9 1 166 13.1 24.0 1 588 24.7 23.9
1 014 8.0 13.8 366 6.9 5.5 549 3.7 7.3
440 91 1 994 20.7 45.6 393 49 2 430 12.5 20.2 23 7 304 30.4 23.0 23 3 372 13.0 8.1 47 3 285 6.4 10.5 41 4 280 9.8 14.3 179 32 729 17.9 43.9 151 14 916 9.3 15.3 100 14 430 14.0 32.6 121 6 525 5.0 11.4 100 14 501 14 0 27.9 97 13 635 13.4 20.5
204 59 398 44 11 77 2
1 079 21.6 40.8 154 711 18.6 15.5 .44 866 19.3 88.9 370
14 4 39 3
1 313 9.1 10.7
867 9.1 4.6
1 056 10.3 36.9 12 404 16.7 5.0 53 494 5.7 6.1
Reporting areas
1980 I 988
infant Infant Total deaths Live Total deaths Live
deaths (<l year) births PIM IMC deaths (<I year) births PIM IMC 22 23 24 25 26 27 28 29 30 31 32 33 34 35 36 37 38 39-40 41 42 43 44 45 46 47 48 49 50-51 52 53 54 55 56
Sindicato dos Trabalhadores da lndljstria de Extraclo do Petroleo (STIEP), ArmacBo Frederic0 Pontes Pilar, Rua Chile,
Baixa dos Sapateiros Nazare
Matatu, Pitangueiras Cosme de Farias Luiz Anselmo, Vila
Laura Cabula, Bew Pernambues Boca do RIO Barbalho, Lapinha Caixa D’dgua Quintas, Pau Miudo,
Cidade Nova Avenida Heitor Dlas,
Acesso None 1 V” Batalhao de
Cavalaria Pituacu Calcada, Mares,
Roma, Baixa do Fiscal, Boa Viagem Liberdade
Institute de Aposentadoria y PensBes dos lndustridrios (IAPI) Fazenda Grande do
Retiro SZo Concalo do
Retiro Engomadeira Centro Administrative
da Bahia (CAB) Pi&i, Patamares Bonfim, Ribeira, Monte Serrat, Caminho Areia Massaranduba, Jardim
Cruzeiro, ltapagipe Urugual, Alagados II Slo Caetano Mata Escura Sussuarana Paralela, Estrada
Velha do Aeroporto ItapoI
Aeroporto, Praias do Flamengo, Stella Mares
40 9 466 32 5 66 158 26 492 261 28 797 120 9 419 270 a2 1 142 52 10 501 311 124 549 315 123 1046 277 90 976
la0 35 614 102 16 992 309 68 1217
33 a 24 5 1 173 21 6 226 264 26 772 700 167 2 905
168 53 980 299 aa 1263 139 57 408
93 36 1 375 12
3 1 - 20 227 28 971 392 a2 1 692
271 69 1290 616 164 2 770 111 51 397 167 a2 619
38 206 32 17 75 15
424 44.7 40.1 746 36.4 100.5 40 46.9 375.0 22.5 19.3 15.6 75.8 16.5 52.8 10.7 35.1 7.5 21.5 30.4 71.8 19.2 20.0
39.9 255.9
39.0 117.6 32.5 92.2 19.4 57.0 15.7 16.1 22.0 55.9 24.2 333.3 20.0 5.8 28.6 26.5
9.8 33.7 23.9 57.5
31.5 54.1 29.4 69.7 41.0 139.7 38.7 26.2 a.3 -
- - 12.3 28.8 20.9 48.5 25.5 53.5 26.6 59.2 45.9 128.5 49.1 132.5
77 11 568 14.3 19.4
19 1 79 5.3 12.7 119 22 ala 18.5 26.9
212 19 788 9.0 24.1 115 10 513 a.7 19.5 227 35 1 392 15.4 25.1 39 4 653 10.3 6.1 152 11 665 7.2 16.5 287 64 1 276 22.3 50.2 182 43 1 la5 23.6 36.3 159 20 751 12.6 26.6 114 13 1 215 11.4 10.7 227 21 1484 9.3 14.2 17 1 30 5.9 33.3 41 9 213 22.0 42.3 45 a 274 17.8 29.2 144 7
578 65
940 4.9 3 737 11.2
7.4 17.4
la9 22 1 191 11.6 la.5 292 55 1539 la.8 35.7 105 29 494 27.6 58.7 313 61 1 673 19.5 36.5
2 -
6 - -
303 33 I la5 10.9 27.8 258 37 2 058 14.3 180 266 40 1 569 15.0 25.5 439 72 3 380 16.4 21.3 128 28 482 21.9 58.1 122 39 751 32.0 51.9 113
279 5
39 519 34.5 75.1 63 965 22.6 65.3 -
Reporting areas
1980 I 988
Infant Infant Total deaths Live Total deaths Live
deaths (<I year) births PIM IMC deaths (<I year) births PIM IMC 57 58 59 60 61 62 63 64 65 66 67 68 69 70 71 72 73 74 75 76
Lobato, Piraja Campinas, Piraja Pau da Lima Sete de Abril,
Marechal Rondon Mussurunga, S5o
Cristovao Plataforma Piraja
Port0 Seco, Pirajl, Brasilgas Castelo Branco Escada, Periperi,
Praia Crande Parque Slo
Bartolomeu Valdria Aguas Claras Estrada Centro
Industrial de Arato- Aeroporto Coutos Limite corn Usina
Sidenkgica da Bahia (USIBA) Paripe, Base Naval llhas Capeta, Born
Jesus, Frades Madre Deus llha de Mare Incomplete address Unregistered address
247 84 1 076 34.0 78.1 249 63 76 29 538 38.2 53.9 110 31 329 144 1001 43.8 143.9 273 44 139 64 459 46.0 139 4 109 ia 134 56 713 41.8 78.5 145 31 346 113 1417 32.7 79.7 371 91 148 56 468 37.8 119.7 134 26
40 15 217 105 24 498
37.5 69.1 22.9 48.2 33.8 89.5 100.0 66.7 45.1 216.0 52.5 131.7
22 101
- 19
314 106 I la5 358 a5 1484 23.7 57.3 2 2 30
102 46 213 61 32 243
3 2 93 29 254 52 56 20 126 35.7 158.7 14 3 116 50 521 43.1 96.0 263 94
1 - 21 302 109 1 154
- - 36.1 94 5 33.3 27.0 35.9 52.8 37.5 66.7 24.1 -
321 - 106 6 2 74
39 14 265 16 6 a4 199 48 - 167 ii8 -
2 29 3 129 70.7 - 78
- 6 1 24
55 - 70.5 1331 25.3
739 28.2 1 221 16.1 555 16.5 867 21.4 1 722 24.5 586 19.4 268 - 604 18.8
36 66.7 262 31.2 415 20.5 152 21.4 641 35.7
1343 33.0 "97 -
322 20.7 109 33.3 - 18.6
47.3 41.9 36.0 32.4 35.8 52.8 44.4 31.5 55.6 110.7 125.3 19.7 146.6 - 78.9 - 18.6 92 - -