Factors associated with hospital
mortality in Rio Grande do
Sul SUS network in 2005:
Application of a Multilevel
Model
Andréa Silveira Gomes
IMariza Machado Klück
IIJandyra M. Guimarães Fachel
I,IIIJoão Riboldi
I,IIII Programa de Pós-Graduação em Epidemiologia. Faculdade de Medicina.
Universidade Federal do Rio Grande do Sul, RS, Brasil.
II Departamento de Medicina Social. Faculdade de Medicina. Universidade
Federal do Rio Grande do Sul. RS, Brasil.
III Departamento de Estatística, Instituto de Matemática, Universidade Federal
do Rio Grande do Sul, RS, Brasil.
Correspondence: Andréa Silveira Gomes, Av. Padre Cacique, 372, 3º andar, Porto Alegre, RS - CEP 90810-240. E-mail: [email protected].
Abstract
Objective: To use a multilevel analysis me-thodology to evaluate hospital mortality from the data available in the Hospital Infor-mation System of the National Uniied Heal-th System. Methods: Cross-sectional study with data obtained from Authorization For-ms for Hospital Admissions in Rio Grande do Sul, Brazil in 2005. The modeling was performed using multilevel logistic regres-sion, with variables from the individual level (hospital admissions) and the context level (hospital proile). The variability originated from individual variables was analyzed as well as the participation of the proile of hospitals in the rate of hospital mortality.
Results: The crude death rate calculated for all hospitals was 6.3%. The variables “Use of Intensive Care Unit” followed by “Patient Age” were the main predictors for hospital death at the individual level. The context variables that were related most closely to hospital death (outcome) were: size of hospital, legal nature, and average length of stay. The OR for deaths at large hospitals was 1.85 times the odds for small hospitals and the OR for medium hospitals was 1.69 times the odds for small ones. The chance of deaths in public hospitals was 67% higher than in private ones. Conclusions: The hospital proile has an important role in hospital mortality in the Hospital Informa-tion System of the NaInforma-tional Uniied Health System. Multilevel analysis should be used to estimate the contribution of the proile of mortality in hospitals.
Introduction
Hospital mortality is an important and traditional indicator of hospital performan-ce1; as the final outcome of treatment in
hospital, it is a crucial measure of the quality of care provided. No other characteristic of health care is more closely linked to the mis-sion of health institutions than their activities to prevent or to delay death1. Hospital
mor-tality rate, whether observed or estimated, should be used by hospitals, professionals and funding agencies both as a measure of the quality of care given to patients, and to give a better appreciation of how such care can be improved1.
The evaluation of health service per-formance has been focused on services of medical assistance. This is a consequence of the search for greater eficiency by ensuring that health service systems perform their functions in the best possible way, under conditions of ever greater inancial strin-gency3. Emphasis on the evaluation of health
care provided by hospitals is important both to promote better knowledge of care effec-tiveness and to ensure greater eficiency of programmes for evaluating and controlling assistance4.
Differences in mortality rates between hospitals may be a consequence of differen-ces in general health of the populations that they serve5, and of institutional
characteris-tics6. When studying such differences, there
are hierarchical differences in the available information, at the micro level on the one hand, and at the macro level on the other: that is, at the individual case level, and at the contextual (hospital) level. Multilevel models have been developed for the purpose of distinguishing between such sources of variation, given data organized hierarchically with the existence of intraclass or within-group correlation7-9.
A number of authors have therefore proposed the use of multilevel modeling for evaluating hospital mortality. However in contrast to what happens at the international level, few studies at the national level have been reported which use multilevel models
to evaluate hospital performance in terms of their mortality rates10,11.
In Brazil, the Unified Health Service’s Hospital Information System (SUS-HIS)12
has proved a good way of analyzing hospital internments since it holds extensive records which are available for use shortly after the period of hospitalization4, although
infor-mation about secondary diagnostics13,14, the
nature of the costs involved, and the clinical condition of patients are limitations that must be recognized. However a number of studies6,13 have veriied that the SUS-HIS
ar-chive holds reliable data for use in evaluating hospital performance.
Under these conditions, it is possible, opportune and useful to evaluate hospital mortality by using multilevel analysis of data both of patients and hospitals, held in the SUS-HIS data-base.
Methods
The data-base was derived from the record of periods spent in the SUS hospitals of Rio Grande do Sul for the year 2005, and were abstracted from the Hospital Informa-tion System SUS-HIS. The AuthorizaInforma-tions for Hospital Admission (AHAs) form an informa-tion data-bank that is processed nainforma-tionally by SUS-HIS and is internet-accessible for public use. The AHA is the instrument for in-formation and costings of all SUS services. To develop the model, a sample of 10 000 Type I AHAs was selected randomly from the total record of 453 515 admissions to medical and surgical clinical specialization in Rio Grande do Sul in the year 2005. Thus admission was the basic unit for statistical analysis.
Where data are hierarchically structured into two groups belonging to different levels, units within the same group are rarely inde-pendent. The fact that units share the same environment, or are otherwise more similar to each other than to units in other groups, may also result in greater similarity in the ou-tcomes of interest7-9. Failure to take account
becau-se magnitudes of standard errors have been under-estimated7-9. Multilevel models were
developed as a means of overcoming analyti-cal difficulties when data are organized hierarchically and intraclass or within-group correlations exist. They take hierarchies into account and correctly estimate variances of model coeficients, thus allowing risk factors at levels higher than the irst to be analyzed directly and eficiently7-9. It is also possible to
adjust for confounding between factors at the same level and at different levels, to estimate possible interactions between effects at indi-vidual and contextual levels, and to model complex variance structures7-9.
The multilevel model is made up of a ixed component which measures the mag-nitude of associations between the variables, and a random component which shows the differences between second-level compo-nents and the variances in the different le-vels15. The random coeficients are measures
of the random effects derived from variability between units, shown either as variation between intercepts or as variation between slopes in itted regression lines16.
The multilevel modeling followed recom-mendations of Snijders and Bosker17 and
Rasbash et al.18. When evaluating hospital
mortality a hierarchical two-level structure is found: the irst level being admissions and the second, hospitals. Mortality as an out-come of hospitalization can vary as a func-tion of explanatory variables which might be measured at the irst level, as characteristics of admissions, or at the second, in terms of hospital proiles, with both individual and contextual effects estimated.
T h e m u l t i l e v e l l o g i s t i c m o d -el used was given by the equation10
where is
the natural logarithm of the odds that pa-tient i dies in hospital j;xij is the matrix of explanatory variables at the individual level; and zj is the matrix of explanatory variables at the hospital level; b and g are vectors of parameters, respectively associated with individual and hospital variables. The
random effect uj, which captures the cor-relation between observations, is assumed to be Normally distributed with mean zero and variance s2
u.
Model parameters corresponding to the second level can be written as b0j = b0 + u0j and [u0j] ~ N(0,Ωu):Ωu = [s2
u0], where the
random intercept b0j consists of two terms: a fixed component b0 and a component speciic for the contextual level. Thus the random effect u0j represents random varia-tion at the second level. It is assumed that the intercept b0 varies randomly between hospitals and that u0j has a Normal distribu-tion with mean zero and variance s2
u0 0 2
u
σ
. With these assumptions a value can be calculated that is two standard deviations larger than the mean, giving the increased odds of a patient dying in hospital, from the expression10e2x√s2u0.The multilevel regression model yields a statistic termed the intraclass correlation coefficient (ICC), defined as r = s2
u0/(s2e0
+ s2
u0), where s2e0 and s2u0are the irst- and
second-level variances respectively. The ICC gives the proportion of total residual variation (the sum of the variances at irst and second levels) which is attributable to hospital (the second level). In the logistic model it is assumed that the irst-level vari-ance is p2/3 ≈ 3.29.
The variables derived from AHA data that were chosen as explanatory variables at the admission (irst) level, were: sex, pa-tient age, UTI (time spent in intensive care unit); type of treatment (medical and surgi-cal clinisurgi-cal), type of admission (voluntary/ emergency), length of hospital stay. In this study, the diagnosis variable was considered most important, following the chapters of CID-10. The variable type of treatment was subsequently eliminated because it is highly correlated with the variable diagnosis. After fitting the model at the individual level, variables at the hospital level were subse-quently included.
Whether or not variables were retained in the model was determined by theoretical considerations, by statistical signiicance9
a smaller ICC was obtained, within the spe-ciic theoretical context.
Variables at the hospital (second) level were selected from AHA data and also from information about institutional profiles given in the National Register of Health Service Establishments (CNES) which was obtained from State Secretary for Health. Variables used at the hospital level were: mean age of admitted patients, mean time spent in hospital, hospital size (small, me-dium or large), mean rate of transfer (where patients are transferred to other hospitals), hospital legal status (public, private), com-plexity of treatment (low, medium, high), presence of teaching activities (yes, no) and mean number of admissions.
It is also possible in multilevel models to analyze whether the effects of explana-tory variables are different for different units at the second level. By adding a random component to the explanatory variables, its effect can be observed on variability at the second level. Thus with another random term contributing to vari-ance at the second level, we have bxj, where x is the explanatory variable at the second level, with b0j = b0 + u0j and bxj = bx + uxj, with
All irst-level explanatory variables were tested to see whether there were differences between estimated coeficients obtained for second-level units (hospitals).
Variables were put into discrete form for the analysis, so that continuous variables were dichotomized and classed as greater than, or less than, their mean values. Tables 1 and 2 show the cut-off points for each category together with the categories used. Interactions were not tested.
Data were analyzed using the statisti-cal programs SPSS version 13 and MLwiN version 2.0.
Results
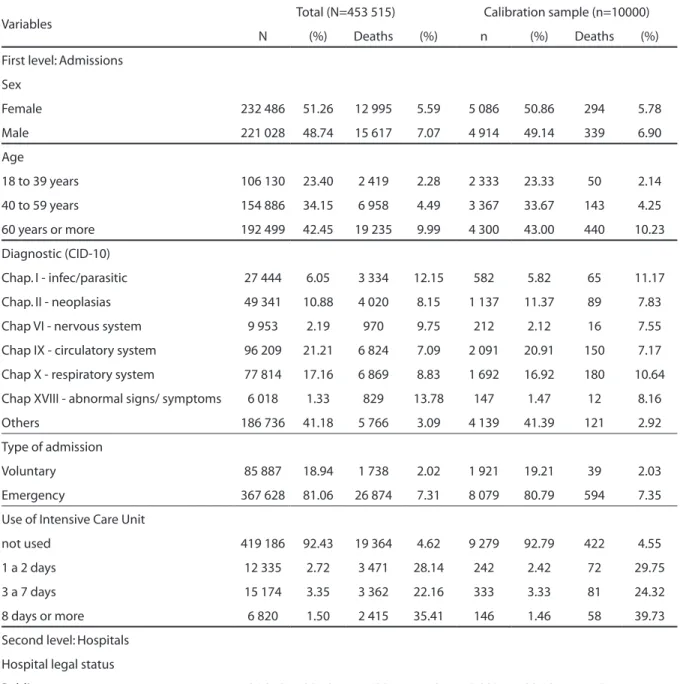
The set of 332 hospitals (453 515 AHAs) had an overall mortality rate of 6.3%.
The mean age of patients at admission
was 54.6 years, the mean length of stay in hospital was 6.1 days, the mean rate of admissions was 1366 admissions/hospital and the transfer rate per 100 admissions over all 453 515 AHAs was about 1.6, but fell to 1.2 after high values from certain hospitals with unusual proiles were omit-ted. Teaching activities were undertaken in 23.30% of hospitals. Over all hospitals, 2.40% gave treatment of low complexity, 39.06% of medium complexity and 58.54% of high complexity.
Table 1 shows admission characteristics and hospital proiles in the data-base de-rived from the 332 hospitals (453 515 AHIs) and of the random sample of 10 000 AHIs used to develop the multilevel model.
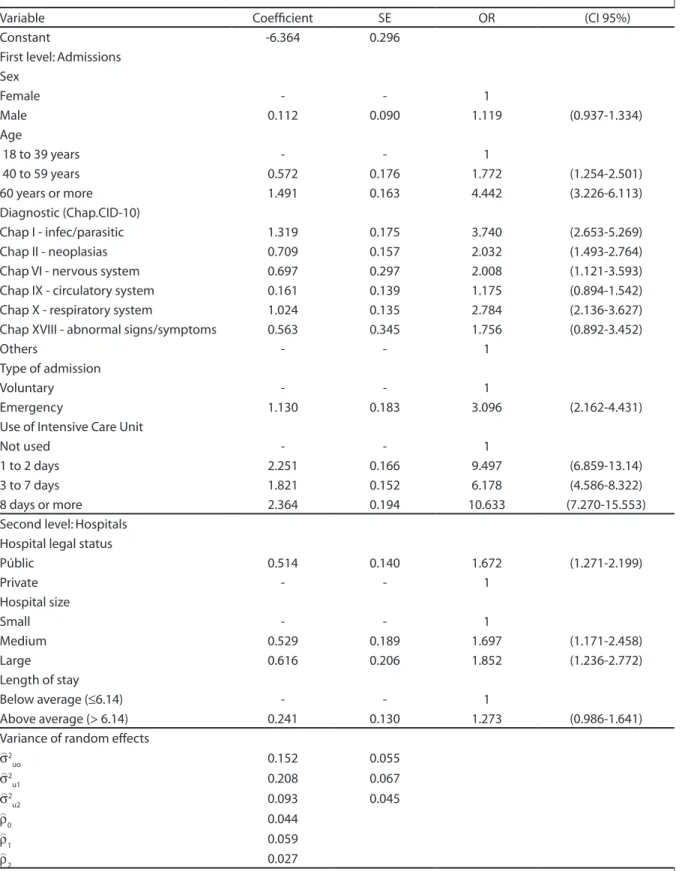
Table 2 shows the inal model itted in the multilevel analysis. This was the model which, as well as including variables shown to be important from theoretical consid-erations and/or from their statistical sig-niicance (p ≤ 0.05), showed less variability in mortality between hospitals. The inal model, developed from the random sample of 10.000 AHAs, had area under the ROC curve ROC=0.805 (CI95% 0.788-0.822) when itted, and area under the ROC curve 0.780 (CI95%=0.762-0.798) when validated. The model was therefore considered adequate for predicting hospital deaths.
At the individual level, time spent in intensive care (UTI) is the variable which in this context was the best predictor of the chances of death, which were greater for those who had spent time in intensive care than for those who had not. However it was found that the chances of death did not increase with the length of time spent in intensive care. Patients older than 60 years had greater chance of death in hospital than patients aged between 18 and 39. For patients diagnosed at admission as having infecto-parasitic or respiratory illnesses, the chances of death were greater. No difference between the sexes was found.
Table 1 - Caracteristics of admissions and hospitals studied. AHAs, RS, 2005.
Variables Total (N=453 515) Calibration sample (n=10000)
N (%) Deaths (%) n (%) Deaths (%)
First level: Admissions
Sex
Female 232 486 51.26 12 995 5.59 5 086 50.86 294 5.78
Male 221 028 48.74 15 617 7.07 4 914 49.14 339 6.90
Age
18 to 39 years 106 130 23.40 2 419 2.28 2 333 23.33 50 2.14
40 to 59 years 154 886 34.15 6 958 4.49 3 367 33.67 143 4.25
60 years or more 192 499 42.45 19 235 9.99 4 300 43.00 440 10.23
Diagnostic (CID-10)
Chap. I - infec/parasitic 27 444 6.05 3 334 12.15 582 5.82 65 11.17
Chap. II - neoplasias 49 341 10.88 4 020 8.15 1 137 11.37 89 7.83
Chap VI - nervous system 9 953 2.19 970 9.75 212 2.12 16 7.55
Chap IX - circulatory system 96 209 21.21 6 824 7.09 2 091 20.91 150 7.17
Chap X - respiratory system 77 814 17.16 6 869 8.83 1 692 16.92 180 10.64
Chap XVIII - abnormal signs/ symptoms 6 018 1.33 829 13.78 147 1.47 12 8.16
Others 186 736 41.18 5 766 3.09 4 139 41.39 121 2.92
Type of admission
Voluntary 85 887 18.94 1 738 2.02 1 921 19.21 39 2.03
Emergency 367 628 81.06 26 874 7.31 8 079 80.79 594 7.35
Use of Intensive Care Unit
not used 419 186 92.43 19 364 4.62 9 279 92.79 422 4.55
1 a 2 days 12 335 2.72 3 471 28.14 242 2.42 72 29.75
3 a 7 days 15 174 3.35 3 362 22.16 333 3.33 81 24.32
8 days or more 6 820 1.50 2 415 35.41 146 1.46 58 39.73
Second level: Hospitals
Hospital legal status
Public 106 212 23.42 7 639 7.19 2 290 22.90 178 7.77
Private 347 303 76.58 20 973 6.04 7 710 77.10 455 5.90
Hospital size
Small 54 299 11.97 1 713 3.15 1 146 11.46 39 3.40
Medium 159 618 35.20 8 776 5.50 3 636 36.36 207 5.69
Large 239 598 52.83 18 123 7.56 5 218 52.18 387 7.42
Length of hospital stay
Below average (≤6.14) 263 678 58.14 13 507 5.12 5 800 58.00 301 5.19
Above average (> 6.14) 189 837 41.86 15 105 7.96 4 200 42.00 332 7.90
Table 2 – Multi-level logistic model of hospital death. Estimates, standard errors (SE), OR of the itted model for irst and second levels. n=10.000. AHAs, RS, 2005.
Variable Coeficient SE OR (CI 95%)
Constant -6.364 0.296
First level: Admissions Sex
Female - - 1
Male 0.112 0.090 1.119 (0.937-1.334)
Age
18 to 39 years - - 1
40 to 59 years 0.572 0.176 1.772 (1.254-2.501)
60 years or more 1.491 0.163 4.442 (3.226-6.113)
Diagnostic (Chap.CID-10)
Chap I - infec/parasitic 1.319 0.175 3.740 (2.653-5.269)
Chap II - neoplasias 0.709 0.157 2.032 (1.493-2.764)
Chap VI - nervous system 0.697 0.297 2.008 (1.121-3.593)
Chap IX - circulatory system 0.161 0.139 1.175 (0.894-1.542)
Chap X - respiratory system 1.024 0.135 2.784 (2.136-3.627)
Chap XVIII - abnormal signs/symptoms 0.563 0.345 1.756 (0.892-3.452)
Others - - 1
Type of admission
Voluntary - - 1
Emergency 1.130 0.183 3.096 (2.162-4.431)
Use of Intensive Care Unit
Not used - - 1
1 to 2 days 2.251 0.166 9.497 (6.859-13.14)
3 to 7 days 1.821 0.152 6.178 (4.586-8.322)
8 days or more 2.364 0.194 10.633 (7.270-15.553)
Second level: Hospitals Hospital legal status
Públic 0.514 0.140 1.672 (1.271-2.199)
Private - - 1
Hospital size
Small - - 1
Medium 0.529 0.189 1.697 (1.171-2.458)
Large 0.616 0.206 1.852 (1.236-2.772)
Length of stay
Below average (≤6.14) - - 1
Above average (> 6.14) 0.241 0.130 1.273 (0.986-1.641)
Variance of random effects σ^2
uo 0.152 0.055
σ^2
u1 0.208 0.067
σ^2
u2 0.093 0.045
ρ
^
0 0.044
ρ
^
1 0.059
ρ
^
2 0.027
σ
^
2
uovariance of second level without explanatory variables (null model); σ
^
2
u1variance of second level with only explanatory variables of individual level; σ
^
2 u2 vari-ance of second level with explanatory variables of individual and hospital level; ρ^
0intra-unit correlation without explanatory variables (null model); ρ
^
1intra-unit correlation with explanatory variables of individual level; ^ρ
than in small ones. The chance of death in public hospitals was greater than in private hospitals. Length of hospital stay showed no signiicant relationship with hospital death. The variance of the random effect at hospital level in the null model, before the inclusion of any explanatory variables, was 0.152, corresponding to an intraclass cor-relation of 4.4%. This shows that 4.4% of the total unexplained variation in outcome is associated with the hospital, and is an in-dicator of the value of grouping the data and of the magnitude of the hospital effect. The variance of this random effect decreased to 0.093 after inclusion of the explanatory variable in the inal model, so that inclusion of the explanatory variables reduced the intraclass correlation to 2.7%, a reduction of 39% in unexplained variation.
Although variance of the random effect was small, it could have an important effect on the chance of patient death. Recalling that the random effect is Normally distrib-uted with variance 0.093, it was compdistrib-uted that a patient admitted to a hospital with mortality rate two standard deviations greater than the mean mortality rate, would have chances of death in hospital increased by 84% (e2√0,093 = 1,84).
There was close correlation between the variable teaching activities present and the variables legal status and size. Other models tested were found to have greater variability at the hospital level than the inal model given in Table 2, showing that they offered no improvement in model it. Although included in the inal model, the variable teaching activities present was not statistically signiicant.
Discussion
Few studies in Brazil have used hospital characteristics to evaluate hospital perfor-mance by multilevel modelling10,11.
Inclu-ding both comparisons between hospitals as well as characteristics of admissions and the patients admitted, it was decided to compare results from the present study with those of others done in the country.
Howe-ver caution is needed because other studies had different objectives, methods and target populations from the work reported here.
Regarding admission characteristics and/or the people admitted, various studies have been undertaken to evaluate hospital mortality using variables such as use of UTI19,20, principal diagnosis14,21, age14, sex10,21
and nature of admission14.
Since the variable use of UTI was the most important predictor of hospital death, it should be mentioned that other authors19
found that patients who spent longer in UTI (>9 days) had higher risk of dying than patients who were there for a shorter time (from 3 to 9 days). Other research22 found
that children who died while in hospital showed higher probability of being sent to UTI than those who had survived. These indings agree with the premise that the variable use of UTI is an indirect measure of the gravity of a patient’s condition. In the present study, patients in the intermediate group for time spent in UTI (from 3 to 7 days) had less chance of dying than those in the lower (from 1 to 2 days) or higher (8 days or more) groups. This may be related to the fact that patients who survive for 48 hours in UTI may be in a less grave condi-tion than those who spent less time there, or who spent 8 days or more.
In terms of the contribution of hospi-tal proile to morhospi-tality rate, results of the present study both agree and disagree with those reported elsewhere in the literature. They disagree with the results of Martins et al.10, who studied admissions for
in the itted multilevel model that included variables describing hospitals.
The higher chances of death in public hospitals may be related both to the gravi-ty of the patient’s condition and, possibly, to less successful treatment, especially in public hospitals in the interior of the state. A study of the mortality of elderly pa-tients in the city of Rio de Janeiro21 has been
reported which did not include variables at the hospital level. Overall, it was found that mortality rate was lower in university hospi-tals. In that study, although itting for patient characteristics reduced the differences in mortality rates between establishments, university hospitals continued to have mortality rates that were signiicantly lower than those of other hospitals. However in the present study the presence or otherwise of teaching activities did not signiicantly affect mortality rate.
As in other reports10, hospital-level
va-riables such as volume of admissions, mean age of patients and length of hospital stay showed no evidence of statistical signiican-ce. Although the use of length of hospital stay as a variable in predictive models may be controversial since it may indicate either the gravity of cases as well as low treatment quality1, it was decided to retain it in the
pre-sent study. The result is consistent with that of Martins et al.10 who found that the length
of hospital stay was greater for patients who died than for those who lived. In the present study, length of hospital stay reduced varia-bility at the hospital level and, as expected, showed that hospitals where length of stay was longer had higher chances of death. In addition, the mean time of hospital stay was greater for public than for private hospitals, which is consistent with another study22
that reported lower times of hospital stay in contracted/philanthropic hospitals. In both studies, public hospitals and hospitals with longer durations of hospital stay had higher probabilities of hospital death.
Noronha et al.19, who evaluated the
vo-lume of surgical operations for miocardial revasculation (CRVM) and its relation to hospital deaths, found that, in hospitals with
higher volumes of CRVM, patients who were operated were less likely to die than those in hospitals where the volume of surgical operations was smaller. In the present study, the volume of admissions did not contribute greatly to the model, which is consistent with Martins et al.10. Volume of admissions is
probably more important in studies which, unlike the one reported here, aim to relate hospital mortality to speciic diagnoses.
The limitations of the work are related to the use of an administrative data-base with relatively few variables; also, since the inherent purpose of AHAs is to evaluate costs, the information supplied may be biased, although this should be minimized by the aggregation of diagnoses. The limited information on hospital proiles that relates to the care process and hospital structure, especially where human resources are con-cerned, may be such that a better evaluation at hospital level is not possible. Extending the number of clinical variables recorded on patients, together with variables which better describe hospital profiles, could improve estimates of the probability of hospital death in different establishments within the SUS-HIS system.
However, although on the one hand the limited number of published national studies of the issue, all with different meth-odologies or target populations, makes comparison of results dificult, on the other hand it underlines the relevance of the pres-ent study.
Conclusion
Collaborators
AS Gomes reviewed the literature, did the statistical analysis and drafted the paper.
Referências
1. Travassos C, Noronha JC, Martins M. Mortalidade hospitalar como indicador de qualidade: uma revisão. Ciênc saúde coletiva. 1999;4(2):367-81. Disponível em http://www.scielo.br/scielo.php?script=sci_ abstract&pid=S1413-81231999000200011&lng=pt&nrm= iso&tlng=pt.
2. Iucif Jr N, Rocha JSY. Estudo da desigualdade na mortalidade hospitalar pelo Índice de Comorbidade de Charlson. Rev Saúde Públ. 2004;38(6):780-6. Disponível em
3. Viacava F, Almeida C, Caetano R, Fausto M, Macinko J, Martins M, et al. Uma metodologia de avaliação do desempenho do sistema de saúde brasileiro. Ciênc saúde coletiva. 2004;9(3):711-24. Disponível em
4. Gouvêa CSD, Travassos C, Fernandes C. Produção de serviços e qualidade da assistência hospitalar no Estado do Rio de Janeiro, Brasil - 1992 a 1995. Rev Saúde Públ. 1997;31(6):601-17. Disponível em http://www. scielo.br/scielo.php?script=sci_arttext&pid=S0034-89101997000700009&lng=pt&nrm=iso.
5. Iezzoni LI. Risk adjustment - measuring health care outcomes. Chicago, Illinois: Health Administration Press; 2003.
6. Guerra HL, Giatti L, Lima-Costa MF. Mortalidade em internações de longa duração como indicador da qualidade da assistência hospitalar ao idoso. Epidemiologia e Serviços de Saúde. 2004;13(4):247-53. Disponível em http://portal.saude.gov.br/portal/ arquivos/pdf/6artigo_mortalidade_internacoes_longa. pdf.
7. Goldstein H, Healy MJR. The Graphical Presentation of a Collection of Means. J R Stat Soc A. 1995;158(1):175-7. Disponível em http://www.jstor.org/stable/2983411
8. Sanchez-Cantalejo E, Ocana-Riola R. [Multilevel models or the importance of ranking]. Gac Sanit. 1999 Sep-Oct;13(5):391-8. Disponível em http://www.ncbi.nlm. nih.gov/entrez/query.fcgi?cmd=Retrieve&db=PubMed& dopt=Citation&list_uids=10564851.
9. Hox J. Applied multilevel analysis. Amsterdam: TT-Publikaties; 1995.
10. Martins M, Blais R, Leite IC. [Hospital mortality and length of stay: comparison between public and private hospitals in Ribeirão Preto, São Paulo State, Brazil]. Cad Saúde Pública. 2004;20 Suppl 2:S268-S82. Disponível em http://www.scielo.br/scielo.php?script=sci_ arttext&pid=S0102-311X2004000800021&lng=pt&nrm=i so.
11. Lansky S, Subramanian SV, Franca E, Kawachi I. Higher perinatal mortality in National Public Health System hospitals in Belo Horizonte, Brazil, 1999: a compositional or contextual effect? BJOG. 2007 Oct;114(10):1240-5. Disponível em http://www.ncbi. nlm.nih.gov/entrez/query.fcgi?cmd=Retrieve&db=PubM ed&dopt=Citation&list_uids=17877675
12. Ministério da Saúde, SUS D-DdId. Sistemas de Informação em Saúde - SIS; 2006 2006/05/21/. Disponível em http://w3.datasus.gov.br/datasus/ datasus.php?area=361A3B367C5D467E2F361G61HIJr0L 0M0N&VInclude=../site/din_sist.php&VMapa=1
13. Escosteguy CC, Portela MC, Medronho RA, Vasconcellos MT. [Hospital admissions forms versus medical records to assess risk of in-hospital death from acute myocardial infarction in Rio de Janeiro, Brazil]. Cad Saúde Pública. 2005;21(4):1065-76. Disponível em http://www.scielo. br/scielo.php?script=sci_arttext&pid=S0102-311X200500 0400009&lng=pt&nrm=iso.
14. Martins M, Travassos C, Carvalho de NJ. [Hospital Information Systems as risk adjustment in performance indicators]. Rev Saúde Públ. 2001;35(2):185-92. Disponível em http://www. scielo.br/scielo.php?script=sci_arttext&pid=S0034-89102001000200013&lng=pt&nrm=iso.
15. Merlo J. Multilevel analytical approaches in social epidemiology: measures of health variation compared with traditional measures of association: considering both distribution and determinants of health. (Editorials)(Editorial). J Epidemiol. 2003;57(8):550(3). Disponível em http://ind.galegroup.com/itx/infomark. do?&contentSet=IAC-Documents&type=retrieve&tabI D=T002&prodId=AONE&docId=A106941403&source= gale&srcprod=AONE&userGroupName=capes48&versi on=1.0
16. Kreft I, Leeuw Jd. Introducing multilevelmodeling. Thousand Oaks: Sage Publications Inc.; 1998.
17. Snijders T BR. Multilevel analysis: An introduction to basic and advanced multilevel modeling. London: Sage Publications Ltd.; 2002.
18. Rabash J SF, Browne W, Prosser B. A user’s guide to MLwiN: Centre for Multilevel Modelling. University of Bristol; 2005. Disponível em http://www.cmm.bristol. ac.uk/MLwiN/download/MLwiN-userman-09.pdf.
19. de Noronha JC, Travassos C, Martins M, Campos MR, Maia P, Panezzuti R. [Volume and quality of care in coronary artery bypass grafting in Brazil]. Cad Saúde Pública. 2003;19(6):1781-9. Disponível em http://www. scielo.br/scielo.php?script=sci_arttext&pid=S0102-311X2003000600022&lng=pt&nrm=iso.
20. Evangelista PA, Barreto SM, Guerra HL. Acesso à internação e fatores associados ao óbito hospitalar por doenças isquêmicas do coração no SUS. Arq Bras Cardiol. 2008;90:130-8. Disponível em http://www. scielo.br/scielo.php?script=sci_arttext&pid=S0066-782X2008000200009&nrm=iso
21. Amaral AC, Coeli CM, Costa MC, Cardoso VS, Toledo AL, Fernandes CR. [Morbidity and mortality proile of hospitalized elderly patients]. Cad Saúde Pública. 2004;20(6):1617-26. Disponível em http://www.scielo. br/scielo.php?script=sci_arttext&pid=S0102-311X200400 0600020&lng=pt&nrm=iso.
22. Bittencourt SA, Leal MC, Santos MO. [Hospitalization due of infectious diarrhea in Rio de Janeiro State]. Cad Saúde Pública. 2002;18(3):747-54. Disponível em http:// www.scielo.br/scielo.php?script=sci_arttext&pid=S0102-311X2002000300023&lng=pt&nrm=iso.