online | memorias.ioc.fiocruz.br Visceral leishmaniasis (VL) is a tremendous public
health issue caused by the intracellular protozoan Leish-mania parasite, which is transmitted by phlebotomine sandflies. The World Health Organization (WHO 2008) recently reported on the diversity of this disease. This report stated that 2.4 million new cases of leishmaniasis occur each year and 367 million people are at risk in 88 countries, with 12 million people currently infected. The annual incidence of VL is estimated at 500,000 cases per year worldwide with 40,000-80,000 deaths a year (Hussein 2004). At present in India, Bihar (31 out of 38 districts), West Bengal (10 out of 24 districts), Ut-tar Pradesh (4 districts), that border Bihar, and a small portion of the Jharkhand district are endemic at varying levels. In the Indian sub-continent, VL, also known as Kala-azar, is caused by Leishmania donovani transmit-ted by Phlebotomus argentipes (Swaminath et al. 1942). These insects prefer warm climates and are generally abundant during monsoon season (Sharma & Singh 2008). The Vaishali district in Bihar is the most affected by this disease, with more than 2,000 of cases derived
from this district over the last five years. The fluctuation in the number of VL reported cases in the last 30 years in Vaishali can be linked to ineffective control strategies for P. argentipes. Additionally, due to a lack of knowl-edge of the ecology of P. argentipes, control strategies are not being conducted properly because P. argentipes is constantly changing foci and establishing new areas of disease. Hence, understanding the ecology of the sand-fly is of the upmost requirement for successfully imple-menting a control strategy.
Presently, there is a dearth of scientific informa-tion defining the ecosystem of sandflies. Analysing the distribution of leishmaniasis (i.e., its identification, standardisation, and location) along with monitoring environmental variables with conventional ground surveys is time consuming, laborious and expensive. With increasing accessibility to new technologies, such as remote sensing (RS), it is possible to monitor land-use features on the earth’s surface over various time intervals to develop methods for rapid stratification of highly susceptive areas and to design remedial mea-sures (Bakkeret al. 2000, De La Rocque et al. 2004, Mushinzimanaet al. 2006, Bhunia et al. 2010a). An-other recent development is the use of satellite data to acquire increasing amounts of geographical data avail-able in conjunction with geographic information sys-tems (GISs) to assist with interpretation of ecosyssys-tems and environmental parameters related to sandfly-genic conditions (Sharma & Srivastava 1997, Bergquist2001, Moore 2008, Bhunia et al. 2011). With increasingly Financial support: ICMR
+ Corresponding author: [email protected] SK and GSB contributed equally to this paper. Received 29 October 2010
Accepted 2 June 2011
A comparative evaluation of end emic and non-endemic region
of visceral leishmaniasis (Kala-azar) in India
with ground survey and space technology
Shreekant Kesari1,Gouri Sankar Bhunia1, Vijay Kumar1,
Algarswamy Jeyaram2, Alok Ranjan1, Pradeep Das1/+
1Department of Vector Biology and Control, Rajendra Memorial Research Institute of Medical Sciences, Agamkuan, Patna 800 007, Bihar, India 2Regional Remote Sensing Service Centre, IIT Campus, Kharagpur, West Bengal, India
In visceral leishmaniasis, phlebotomine vectors are targets for control measures. Understanding the ecosystem of the vectors is a prerequisite for creating these control measures. This study endeavours to delineate the suit-able locations of Phlebotomus argentipeswith relation to environmental characteristics between endemic and non-endemic districts in India. A cross-sectional survey was conducted on 25 villages in each district. Environmental data were obtained through remote sensing images and vector density was measured using a CDC light trap. Simple linear regression analysis was used to measure the association between climatic parameters and vector density. Using factor analysis, the relationship between land cover classes and P. argentipes density among the villages in both districts was investigated. The results of the regression analysis indicated that indoor temperature and relative humidity are the best predictors for P. argentipes distribution. Factor analysis confirmed breeding preferences for P. argentipes by landscape element. Minimum Normalised Difference Vegetation Index, marshy land and orchard/ settlement produced high loading in an endemic region, whereas water bodies and dense forest were preferred in non-endemic sites. Soil properties between the two districts were studied and indicated that soil pH and moisture content is higher in endemic sites compared to non-endemic sites. The present study should be utilised to make criti-cal decisions for vector surveillance and controlling Kala-azar disease vectors.
widespread and combined implementation of RS and GIS technology, professionals have been provided with efficient and accurate tools for mapping, maintaining and managing information on landscape features to further our understanding of the epidemiology for the purpose of controlling of VL in India (Palit et al. 2001, Sudhakar et al. 2006, Bhunia et al. 2010b, 2011).
To delineate the suitable habitats of the VL vector, P. argentipes density in relation to environmental characteris-tics between different ecosystems was assessed in endemic (Bihar) and non-endemic (Jharkhand) Indian states.
MAteRIAlS AnD MethoDS
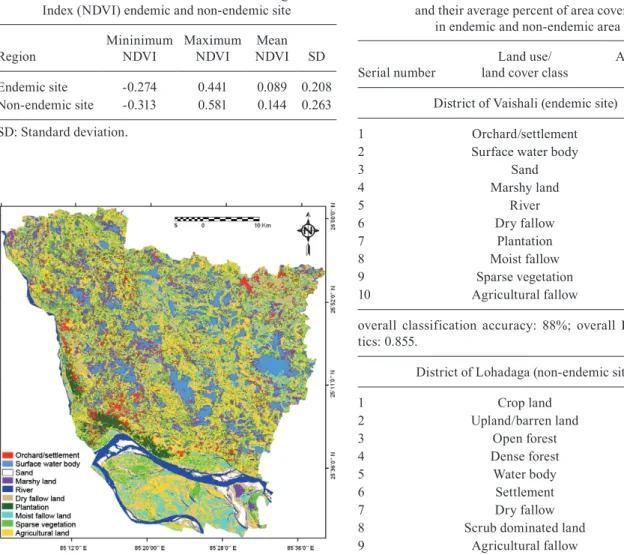
Study area - Cross-sectional descriptive studies were carried out in two different ecological regions of two states of India. Vaishali (25º43’N 26º00’N; 85º04’E 85º38’E), which had the highest prevalence of Kala-azar cases, was selected as the representative endemic site. The Lohardaga district, Jharkhand (23º30’N 23º40’N; 84º40’E 84º50’E) with almost no Kala-azar cases over the past decades, was selected as the representative non-endemic site (Fig. 1). Data on sandfly distribution, fre-quency and biology (Kesari et al. 2010), as well as on the sampling areas of Lohardaga and Vaishali (Kumar et al. 2009), have been reported. Similar to other regions in the upper Gangetic plain, the climate of Vaishali is hu-mid and tropical. The summers are hot (maximum tem-perature ~45ºC), whereas the winters are cold (minimum temperature ~6ºC). The region is a relatively flat plain with no relief. The principal soil type found throughout the district is alluvial and alkaline (pH 7.0-8.3). The total estimated annual rainfall in this area is 2,500-5,500 mm. The humidity ranges from 50% (winter) to 95% (rainy and summer seasons).
The non-endemic district (Lohardaga) is a hilly plain with abundant relief in the form of scattered hills and seasonally flowing watercourses. The principal soil found throughout this area is laterite and acidic (pH -5.7 to -6.1). The climate of this area is dry and sub-tropical with an estimated annual rainfall of 900-1,100 mm.
Twenty-five villages in each district were selected randomly from different cardinal locations (East, West, North, South and centre) for two reasons: (i) to garner knowledge about the vector distribution for the study sites and (ii) to understand the influence of local eco-logical parameters on vector distribution.
RS and collateral data - RS data for this study in-cluded data from the Indian RS 1D (IRS-1D) satellites, which maintain near polar, sun-synchronous orbits. Im-ages were acquired nominally at 10.30 am local time on a descending path. The orbit altitude was 817 km and provided 25 days of repetition (358-orbit cycles). It has three payloads: panchromatic, Linear Imaging Self Scanning-III (LISS-III) and Wide Field Sensor. LISS-III scenes with Date of Pass (DoP) for Vaishali were collect-ed on 11 November 1999 and 15 March 2000, with Path/ Row 105/53, 105/54. The DoP for Lohardaga was on 3 January 2000 and 23 March 2000 with Path/Row 104/55, 105/55. Resolution for visible and near infrared region (21.2-23.5 m) and resolution in shortwave infrared region (63.6-70.5 m) were used in the present study. The entire
scenes were registered to aUniversal Transverse Merca-tor co-ordinate system (zone 45N and datum WGS-84) based on second order polynomial algorithm and nearest neighbour re-sampling method. Mosaics were created from two satellite scenes covering the said districts for each site and the study area was cropped based on their administrative boundary from the mosaic image.
The block boundary map of both districts was scanned and registered with the satellite data. The vil-lage boundary layer for each site was also digitised and vector layers were generated.
Ground data collection - Ground data were recorded from October 2007-July 2009 in the endemic area and from February 2008-October 2009 in the non-endemic site. Twenty-five villages from each district were ran-domly selected from different cardinal locations (East, West, North, South and centre) to perform this research work. In each village from the endemic and non-endemic sites, 10 houses were randomly selected and were sam-pled both indoors (living rooms) and/or outdoors (e.g., cattle sheds) to collect sandflies using a CDC light trap (Table I). Sandfly collection was made between dusk and dawn (06.00 pm-06.00 am). The female sandflies collect-ed were confincollect-ed for egg laying in a Hilton’s pot. Dead sandflies were preserved in 70% alcohol and transported to the laboratory. Sandfly number, type, gender and vec-tor species were also recorded for each site. All species were mounted on microslides using Canada balsam as mounting media (Remaudière 1992). Species identifica-tion (Lewis 1978) was also performed.
Data on relative humidity and temperature indoors were recorded from the relevant sites of vector collection by installing a polymer and were compared with weather parameters to evaluate favourable environmental condi-tions for vector habitation.
Land use/land covers (LULC) habitat characterisation - LULC maps were produced to identify different classes of land from IRS-1D LISS-III imagery. A supervised clas-sification technique with the Maximum Likelihood al-gorithm was used to assign the pixels into 10 land cover classes based on the following parameters: (i) their spectral reflectance characteristics, (ii) the author’s a priori knowl-edge of the study area, which was guided by research ob-jectives, and (iii) an expected certain degree of accuracy in image classification. To perform accurate classification assessments, an error matrix table was derived that repre-sents a square array of numbers laid out in rows and col-umns, which expresses the number of sample units (e.g., clusters of pixel) assigned to a particular category relative to the actual category as verified in the field. Kappa sta-tistics were used to measure agreement or map accuracy (Rosenfield & Fitzpatrick 1986, Congalton 1991). All im-age-processing operations were processed using ERDAS IMAGINE 9.2 software (Leica Geosystems 2008).
Estimation of Normalised Difference Vegetation In-dex (NDVI) - NDVI is an important vegetation inIn-dex be-cause it monitors seasonal and inter-annual changes in vegetation growth and activity (Lillesand et al. 2004). An
NDVI image was generated from the LISS-III bands [Red
Channel 3 and Near infrared (NIR) Channel 4] of IRS-1D (Chan-nel4 (NIR) – Channel3 (Red))/(Channel4 (NIR) + Channel3 (Red)). Channel3 is the reflectance in the visible wavelengths (0.62-0.68 µm) and Channel4 is the reflectance in the reflective infrared wavelengths (0.77-0.86 µm). The in-dex normalises the difference between the bands, so that values range between -1 and +1. Minimum, maximum, mean and standard deviation (SD) of NDVI for each grid square for each village were calculated for each site.
Soil samples - Individual soil samples were collected from five sites in each village from the endemic and non-endemic areas during the ground survey. At each collec-tion type, the soil was dug up to a depth of about 5-6 cm. Each soil sample (at least 200 g was collected in a plastic pot, covered with fine muslin cloth and transported to the laboratory where it was maintained at room temperature (27ºC ± 2) for 45-60 days. Chemical properties were ex-amined to identify favourable breeding characteristics in the soil. The chemical properties of the soil [silicon di-oxide (SiO2), aluminium oxide (Al2O3), iron oxide (Fe2O3), calcium (Ca), magnesium (Mg), sodium oxide (Na2O), po-tassium oxide (K2O), phosphorous pentoxide (P2O5)and TABLE I
Abundance of Phlebotomus argentipes in endemic and non-endemic villages
Villages
Endemic site
Total Villages
Non-endemic site
Total
Male Female Male Female
Akiladabad Diara 0 0 0 Hesal 6 3 9
Daulatpur Chandi 5 8 13 Nandinagra 3 0 3
Bishunpur Basant 9 14 23 Nigni 5 9 14
Randaha 11 5 16 Bhunjaniya 0 0 0
Bazidpur 6 8 14 Manho 6 4 10
Harpur Gangaram 18 10 28 Putrar 3 3 6
Bishunpur Balbhadar 4 3 7 Deodariya 5 7 12
Hussainipur 0 0 0 Hesri 7 4 11
Damodarpur 6 9 15 Hutap 0 0 0
Paharpur 9 13 22 Kekrang 7 4 11
Dhudhua 3 7 10 Porha 0 0 0
Gangapur Lachhmi 12 8 20 Pajhri 6 4 10
Kajri Bhath 7 5 12 Hati 0 0 0
Soharthi 4 3 7 Kanjo 9 3 12
Pirapur 3 9 12 Khanda 5 8 13
Bhanpur Barewa 9 14 23 Dhawra 0 0 0
Mahammadpur Daria 4 6 10 Kharta 10 8 18
Ismailpur 12 13 25 Lawagain 0 0 0
Bakhri Dua 10 5 15 Kuru 1 3 4
Rasulpur 0 0 0 Doba 5 3 8
Sukhwarpur 12 16 28 Bari 3 2 5
Karmupur 7 8 15 Jhaljamira 0 0 0
Mallikpur 5 12 17 Badla 1 3 4
Pirmahammadpur 7 6 13 Nindi 4 3 7
titanium dioxide (TiO2)levels and pH] were employed to assess the breeding ecology of vector P. argentipes. Mois-ture content was determined by the ratio of the weight of water in the soil to the weight of the dry soil.
Statistical analysis - Statistical analysis was per-formed with SPSS 10.0 software (SPSS Inc, Chicago, IL, USA). Multivariate linear regression analysis was per-formed to observe the effect of climatic parameters, such as indoor temperature, relative humidity and type of area (endemic/non-endemic) on sandfly density (flies per trap/ per night). After processing land cover maps (calculating areas occupied by land cover types) and NDVI computa-tion, data were analysed with the density of P. argentipes in SPSS software. Factor analysis (FA) was used to inves-tigate if there was any relationship between land cover classes and the density of P. argentipes among different villages in the endemic and non-endemic study sites. FA allows for data reduction and is used to identify underly-ing variables or factors that explain the pattern of correla-tions within a set of observed variables. In this study, we were only considering five important variables of LULC classes for both sites due to the small sample size. If we considered the total variables of LULC classes, it might not be possible to obtain significant results. FA generates a table in which the rows are observed raw indicator vari-ables and the columns are the factors or latent varivari-ables, which explain the variance in these variables. The cells in this table are factor loadings. The meaning of the factors was deduced from observing which variables were most heavily loaded on which factors. A principal component analysis (PCA) method was used to conduct factor analy-sis. Eigenvalues are the variances of the factors. PCA can be used for data reduction. Each factor will tend to have either positive or negative loadings of a large or small amount for any particular variable.
ReSultS
Sandfly capture and distribution - From October 2007-July 2009, a total of 355 P. argentipes were col-lected from 25 villages in an endemic site (Vaishali: 47.04% male, 52.96% female). Similarly from villages in the non-endemic site (Lohardaga: 53.01% male, 46.99% female), a total of 166 P. argentipes were collected from 25 villages. Sandfly density (flies per trap/per night) in the endemic site varied from 4.56-8.07, whereas in the non-endemic site varied from 2.24-4.89.
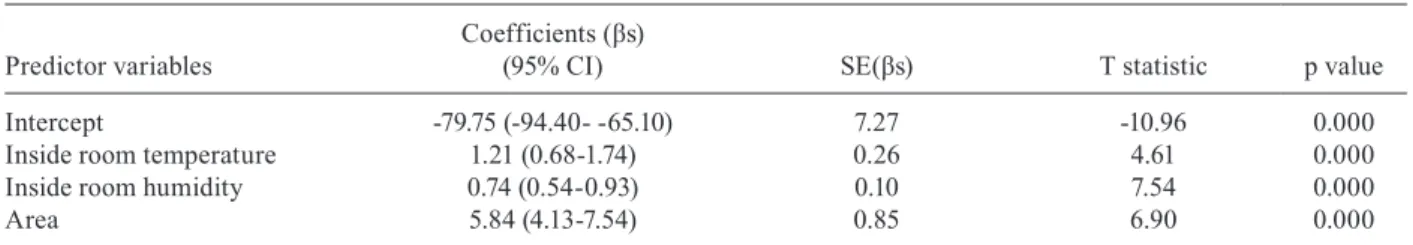
Climatic variables and vector abundance - In situ in-door temperature and relative humidity for the endemic and non-endemic site were recorded at the time of sandfly collection and considered for risk analysis. Multivariate linear regression analysis was performed to determine the predictor variable for sandfly density. Results showed a significant effect of climatic variables, such as indoor temperature, humidity and type of area (endemic/non-endemic) on vector density (Table II). In this analysis, the non-endemic area was considered as a referent category.
The final model was highly significant (63.27, p value < 0.0001). This finding indicates that these three variables in concert are significant predictors of sand-fly density. The adjusted R2 = 0.79, indicates that nearly 79% of the variance of sandfly density could be attrib-uted to these three predictor variables.
Spatial relationship between sandfly abundance and vegetation health (NDVI) - Concerning vegetation health, the NDVI value ranged from -0.24 to +0.44 in the endemic site, while in the non-endemic site, it var-ied from -0.31 to +0.58. Negative or minimum values for NDVI (0 or < 0) were characterised by non-vegetated land (barren land, water bodies, urban land), while posi-tive or maximum values demarcated vegetated land (e.g., crop land, dense forest). For each village, descriptive sta-tistics for NDVI (minimum, maximum, mean and SD) were calculated (Table III). In general, the maximum NDVI value corresponded with a higher vegetation ac-tivity level. Additionally in rice paddies, NDVI values were low at planting time, rose as rice plants grew and dropped again when crops were harvested. The NDVI values were also higher in plantation lands than in agri-cultural lands. The highest NDVI value corresponds to the zone of minimum suitability. Maximum suitability is recorded in the zones where the vegetation shows the minimum NDVI values (< 0.21).
Spatial distribution of vector P. argentipes in rela-tion to LULC characteristics - LULC characteristics are not similar between endemic and non-endemic sites (Figs 2, 3). Analysis of LULC characteristics within the test villages demonstrated that a majority of the area was covered by agricultural fallow, sparse vegetation, moist fallow land and marshy land in the endemic region (Table IV). In the non-endemic region, a majority of the area was covered with agricultural fallow, dry fallow, crop land and open forest land (Table IV). An accuracy
TABLE II
Significant predictor variables of sandfly density
Predictor variables
Coefficients (βs)
(95% CI) SE(βs) T statistic p value
Intercept -79.75 (-94.40- -65.10) 7.27 -10.96 0.000
Inside room temperature 1.21 (0.68-1.74) 0.26 4.61 0.000
Inside room humidity 0.74 (0.54-0.93) 0.10 7.54 0.000
Area 5.84 (4.13-7.54) 0.85 6.90 0.000
assessment of the results, using additionally known land cover sites as test areas (5 test polygon per class), showed an overall classification accuracy of greater than 85%. Kappa statistics were collected for each land cover cate-gory in each study from the public health centres (PHCs) to measure the agreement between the land cover cate-gories. The values of the kappa ranges suggested almost perfect agreement (0.76-0.82) between these land cover classes of an endemic and non-endemic site.
To form our FA analysis dataset, we considered the following variables for the endemic and non-endemic sites: P. argentipes density, minimum NDVI, agricul-tural fallow, water body surface and orchard/settlement. Marshy land and dense forest were also considered for endemic and non-endemic sites, respectively. We con-ducted FA separately on two different datasets. For both Fig. 3: land use/land cover map of district of Lohardaga, India
(non-endemic site).
Fig. 2: land use/land cover map of district of Vaishali, India (en-demic site).
TABLE IV
Land use/land cover classes of 25 villages and their average percent of area covered
in endemic and non-endemic area
Serial number
Land use/ land cover class
Area covered (%)
District of Vaishali (endemic site)
1 Orchard/settlement 3.42
2 Surface water body 12.16
3 Sand 0.60
4 Marshy land 10.94
5 River 3.77
6 Dry fallow 4.76
7 Plantation 3.04
8 Moist fallow 11.32
9 Sparse vegetation 16.50
10 Agricultural fallow 33.50
overall classification accuracy: 88%; overall Kappa statis-tics: 0.855.
District of Lohadaga (non-endemic site)
1 Crop land 20.36
2 Upland/barren land 8.50
3 Open forest 12.54
4 Dense forest 3.11
5 Water body 0.27
6 Settlement 3.52
7 Dry fallow 11.55
8 Scrub dominated land 2.77
9 Agricultural fallow 37.38
Overall classification accuracy: 86% Overall Kappa statistics: 0.8105
overall classification accuracy: 88%; overall Kappa statistics: 0.855.
TABLE III
Calculation of value of Normalized Difference Vegetation Index (NDVI) endemic and non-endemic site
Region
Mininimum NDVI
Maximum NDVI
Mean
NDVI SD
Endemic site -0.274 0.441 0.089 0.208
Non-endemic site -0.313 0.581 0.144 0.263
datasets, we extracted two factors using PCA: group, ac-cording to scatter plot and eigenvalue greater than 1.
We found with variables in an endemic site that the density of P. argentipes has a positive load on minimum NDVI, marshy land and orchard/settlement, whereas ag-ricultural fallow and water body surface have a negative load on the first factor in an endemic site (Table V). For the second factor, it was found that water body surface has a high load, while marshy land and orchard/settlement have a lesser load. The density of P. argentipes, minimum NDVI and agricultural fallow have a negative load.
In the non-endemic site, results demonstrated that the density of P. argentipes has a positive load on settle-ment, water body, dense forest and minimum NDVI, whereas agricultural fallow has a negative load on the first factor. It was observed that P. argentipes density
and settlement have a positive load on the second factor, whereas water body, dense forest, minimum NDVI and agricultural fallow have a negative load.
Soil properties of the endemic and non-endemic sites - Estimation results from the chemical analysis of soil in the endemic and non-endemic foci were highly variable. Results indicate that Al2O3, Na2O, K2O, Ca and Mg are higher in the endemic site, whereas SiO2, P2O5 and TiO2 are higher in the non-endemic site (Table VI). The pH of the soil in breeding locations was alkaline in nature (range 7.50-8.50, mean 7.84, SD 0.30) in the en-demic site; however, in the non-enen-demic site, the pH was slightly acidic (range 6.05-6.18, mean 6.12 SD 0.06). The moisture content in the endemic site was much higher (12.21%) than in the non-endemic site, which symbol-ised suitable conditions for vector habitation.
TABLE VI
Test lanes and sample number including chemical properties and water retaining capacity of the soil
Area Test lanes SiO2 Al2O3 Fe2O3 CaO MgO Na2O K2O P2O5 TiO2 pH Water molecules
Endemic 1 41.10 10.76 9.62 8.12 4.61 8.76 2.11 0.02 0.01 7.50 12.45
2 42.43 11.76 8.96 6.20 3.76 9.24 2.14 0.04 0.00 7.80 15.01
3 41.90 14.75 8.34 4.76 2.43 8.76 1.76 0.06 0.01 8.10 11.73
4 41.04 12.66 10.42 5.62 2.42 12.76 2.43 0.08 0.03 8.20 10.12
5 41.12 14.72 8.34 4.76 2.43 8.76 1.76 0.05 0.01 7.60 11.73
Average 41.52 12.93 9.14 5.89 3.13 9.66 2.04 0.05 0.01 7.84 12.21
SD 0.62 1.78 0.89 1.39 1.01 1.75 0.28 0.02 0.01 0.30 1.78
Non-endemic 1 61.22 9.23 12.57 1.23 0.56 2.41 1.83 2.72 1.66 6.18 3.72
2 62.32 9.43 12.87 1.32 0.58 2.45 1.83 2.76 1.68 6.18 3.80
3 62.20 9.13 12.77 1.28 0.58 2.30 1.80 2.66 1.56 6.10 3.70
4 62.00 9.02 12.67 1.22 0.55 2.38 1.81 2.68 1.46 6.05 3.77
5 61.88 9.40 12.81 1.30 0.57 2.44 1.79 2.58 1.62 6.08 3.75
Average 61.92 9.24 12.74 1.27 0.57 2.40 1.81 2.68 1.60 6.12 3.75
SD 0.43 0.17 0.12 0.04 0.01 0.06 0.02 0.07 0.09 0.06 0.04
Al2O3: aluminium oxide; CaO: calcium oxide; Fe2O3: iron oxide; K2O: potassium oxide; MgO: magnesium oxide; Na2O: sodium oxide; P2O5: phosphorous pentoxide; SD: standard deviation; SiO2: silicon dioxide; TiO2: titanium dioxide.
TABLE V
Factor loading (pattern matrix), extraction method - principal component analysis
Variables Endemic area Variables Non-endemic area
Factor 1 Factor 2 Factor 1 Factor 2
Presence and/or absence of Phlebotomus argentipes
0.7688 -0.1902 Presence and/or absence
of Phlebotomus argentipes
0.4580 0.4894
Minimum NDVI 0.6641 -0.3520 Settlement 0.0620 0.8793
Agricultural fallow -0.5243 -0.3937 Water body 0.5271 -0.6831
Surface water body -0.2219 0.8478 Dense forest 0.9028 -0.1344
Marshy land 0.6816 0.4151 Agricultural fallow -0.8227 -0.2896
Orchard/settlement 0.6910 0.1141 Minimum NDVI 0.1533 -0.2315
DIScuSSIon
Climate data (indoor temperature and relative humid-ity) derived from ground survey by in situ measurements were used to determine predictor climatic variables that affect sandfly density. Temperature and relative humid-ity were shown to play important roles in the transmis-sion by influencing vector survival, parasite develop-ment rate and sandfly feeding behaviour (WHO 2000, Benkova & Volf 2007, Dineshet al. 2008). Our study indicates that indoor relative humidity and temperature are highly associated with increased risk for P. argenti-pes breeding and leishmaniasis infection. Previous work reported that prediction of disease occurrence is based on climatic and/or environmental requirements of sand-fly (Cringoli et al. 2005, Rinaldi et al. 2006). However, our results showed significant associations between vector abundance, indoor temperature and relative hu-midity, which might be a relevant predictor for disease prevalence. One study (Kumar et al. 2009) supports that the presence of cracks and crevices, due to high levels of relative humidity and temperature, generates essen-tial breeding conditions for P. argentipes. These find-ings are also supported by another study (Ready 2008), which demonstrated spatiotemporal modelling of the distributions of the leishmaniasis and their sandfly vec-tors in relation to climate change in Europe.
A knowledge, attitude and practices study was re-cently conducted in endemic and non-endemic areas for the purpose of socio-economic and house structure as-sessment (Kesari et al. 2010). During this study, it was found that houses with mud plastered walls, thatched roofs and mixed dwellings were suitable areas for the breeding and propagation of P. argentipes. It was also observed that cattle sheds, mixed dwellings and inter-connections between the houses strongly were associ-ated with the presence/absence of vector.
Analysis of LULC variables using space technology in Kala-azar endemic and non-endemic regions indicated varying composition and depicted unique environments, which influence the availability of suitable habitat for the vector, as well as its abundance. The physiographical characteristics of the surface environment derived from the land cover data play an important role in the dynam-ics of leishmaniasis transmission (Defries & Townshend 1999). Different land cover classification approaches vary in their potential for discernment and consequently in their utility for meeting specific needs (e.g., the iden-tification of all examples of a particular habitat) (Rog-ers 1991, Patza et al. 2000, Franklin & Wulder 2002). FA analysis results corroborated breeding preferences of P. argentipes by landscape elements. Minimum NDVI (areas with grass/weed cover or crop land), marshy land [high sediment water bodies containing grass/weeds, mass green colour in the standard false colour composite (FCC) image] (Sudhakar et al. 2006) and orchard/settle-ment (soft stem plants, e.g., banana, bamboo, sugarcane associated with hamlets) produced high loading when analysed with P. argentipes density in an endemic re-gion. Water bodies, which are a blue colour in the stand-ard FCC image (Lillesand & Kiefer 1999) and dense
for-est, which are a deep red colour in the standard FCC image (Lillesand & Kiefer 1999), generate a high load in the non-endemic site. Marshy land maintains damp-ness near its surface and increases humidity in the sur-rounding environment, which might be important for sandfly oviposition and breeding. Marshy areas might promote opportunistic growth of commonly found sec-ondary vegetation (such as bamboo and banana) that provides the sandfly with a sugar meal within the study site. Similarly, human settlement has been associated with vector density because humans are feed on by their preferred host and also act as a reservoir. These results are consistent with previous studies where water bodies and vegetation influence sandfly density thus affecting leishmaniasis incidence (Kalluri et al. 2006, Sudhakar et al. 2006). Contrary to our hypothesis, we observed a strong negative relationship with agricultural fallow, which was potentially due to this analysis being based on dry season data.
Satellite-derived proxy for vegetation status derived from NDVI values showed that the majority of sandflies are present in the less dense vegetation zone. This rela-tionship is potentially due to the fact that areas surrounded by peridomestic soft stem plants or less vegetation might help the male sandflies feed (i.e., take their sugar meal) (Schlein & Jacobson 1999). The minimum NDVI value positively correlated with sandfly density. Therefore, the NDVI values are extremely valuable and effective in ana-lysing the conditions of Kala-azar occurrence (Cross et al. 1996, Bavia et al. 2005). Non-endemic areas have shown that proximity to the dense forest is an important deter-minant of the risk of Kala-azar transmission and can in-crease vector densities. Forest areas maintain the sub-sur-face soil moisture and influence the local climate, which might aid suitable sandfly propagation. The distance of the dense forest from hamlets, approximated using GIS analysis with distance criteria and proximity analysis, helped in prioritising the villages prone to high sandfly populations. In areas where the predominant land use is forest, the temperature is generally much cooler because of the abundance of shade provided by trees. Contrarily, humidity is greater because of the increased ability of the vegetation and soil to retain moisture. In this situation, there is a high probability that permanent breeding sites will be present and this condition would suggest the pos-sibility of high Kala-azar transmission. The close proxim-ity of the forest to human settlements might also enable trees to provide refuge for digesting sandflies and thereby protect the vector from insecticides.
moisture content were higher in the non-endemic site, whereas the percentage of TiO2 SiO2 and P2O5 was lower in the endemic site (Table V). In general, high clay con-tent in the soil and an average pH of 9.0 were identified as significant features of the areas where leishmaniasis was prevalent in endemic in India and Sudan (Hoogstraal & Heyneman 1969, Singh et al. 2008). Our data support these previous studies. In sum, the chemical properties and water retaining capacity of the soil in endemic sites mitigates the abundance of vector P. argentipes.
AcKnoWleDGeMentS
To AJ Kumar, NK Sinha, M Prasad, B Kumar and BB Pras-ad, of the Vector Biology and Control division of RMRIMS, for their kind co-operation and laboured during the field studies and data collection.
ReFeRenceS
Adler S, Theodor O 1957. Transmission of disease agents by phlebo- tomine sandflies. Annu Rev Entomol2: 203-225.
Bakker B, Hay SI, Rogers DJ 2000. Remote sensing for epidemiolo-gists: what can satellite data contribute. Geoscience and Remote Sensing Symposium, Proceedings. IGARSS 2000. IEEE 2000 International Conference4: 1449-1451.
Bavia ME, Carneiro DD, Gurgel H da C, Madureira Filho C, Barbosa MG 2005. Remote sensing and geographic information systems and risk of American visceral leishmaniasis in Bahia, Brazil.
Parassitologia(Rome)47: 165-169.
Benkova E, Volf P 2007. Effect of temperature on metabolism of
Phlebotomus papatasi (Diptera: Psychodidae). J Med Entomol 44: 150-154.
Bergquist NR 2001. Vector-borne parasitic diseases: new trends in data collection and risk assessment. Acta Tropica79: 13-20.
Bhunia GS, Kesari S, Chatterjee N, Pal DK, Kumar V, Ranjan A, Das P 2011. Incidence of visceral leishmaniasis in the Vaishali district of Bihar, India: spatial patterns and role of inland surface water bodies. Geospatial Health5: 205-215.
Bhunia GS, Kesari S, Jeyaram A, Kumar V, Das P 2010a. Influence of topography on the endemicity of Kala-azar: a study based on remote sensing (RS) and Geographic Information Systems (GIS).
Geospatial Health4: 155-165.
Bhunia GS, Kumar V, Kumar AJ, Das P, Kesari S 2010b. The use of remote sensing in the identification of the eco-environmental factors associated with the risk of human visceral leishmaniasis (kala-azar) on the Gangetic plain, in north-eastern India. Ann Trop Med Parasitol104: 35-53.
Congalton RG 1991. A review of assessing the accuracy of classifica-tions of remote sensed data. Remote Sens Environ37: 35-46.
Cringoli G, Rinaldi L, Veneziano V, Musella V 2005. Disease map-ping and risk assessment in veterinary parasitology: some case studies. Parassitologia47: 9-25.
Cross ER, Newcomb WW, Tucker CJ 1996. Use of weather data and remote sensing to predict the seasonal distribution of Phlebotomus papatasi in southwestern Asia. Am J Trop Med Hyg54: 530-536.
De La Rocque, S, Michel V, Plazanet D, Pin R 2004. Remote sensing and epidemiology: examples of applications for two vector-borne dis-eases, comparative immunology. Clin Microbiol Infect27: 331-341.
Defries RS, Townshend JRG 1999. Global land cover characterization from satellite data: from research to operational implementation?
Global Ecol Biogeogr 8: 367-379.
Dinesh DS, Kumar V, Kesari S, Kumar AJ, Das P 2008. Is Phle-botomus argentipes Annandale and Brunetti (Diptera: Psychodi-dae) autogenous? J Vector Borne Dis45: 174-175.
Franklin SE, Wulder MA 2002. Remote sensing methods in medium spatial resolution satellite data land cover classification of large areas. Progr Phys Geogr26: 173-205.
Hoogstraal H, Heyneman D 1969. Leishmaniasis in the Sudan Repub-lic. Am J Trop Med Hyg18: 1091-1209.
Hussein A 2004. A clinical and laboratories study for kala-azar in Thiqar city, PhD Thesis, College of Medical and Health Technol-College of Medical and Health Technol-ogy Baghdad, 289 pp.
Kalluri S, Gilruth P, Rogers D, Szczur M 2006. Surveillance of ar-thropod vector-borne infectious diseases using remote sensing techniques: a review. PLoS Pathog3: 116.
Kesari S, Bhunia GS, Kumar V, Jeyaram A, Ranjan A, Das P 2010. Study of house-level risk factors associated in the transmission of Indian Kala-azar. Parasit Vectors3: 94.
Kesari S, Palit A, Kishore K 1991. Study of breeding habitats of sand-flies - Preliminary approach. J Commun Dis 24: 62-63.
Kumar V, Kesari S, Kumar AJ, Dinesh DS, Ranjan A, Prasad M, Sinha NK, Kumar R, Das P 2009. Vector density and the control of kala-azar in Bihar, India. Mem Inst Oswaldo Cruz 104: 1019-1022.
Leica Geosystems 2008. Leica Geosystems geospatial imaging ER-DAS IMAGINE® 9.2. Norcross, USA.
Lewis DJ 1978. The phlebotomine sandflies (Diptera: Psychodidae) of the oriental region. Bull Br Mus (Nat Hist) Entomol 37: 217-343.
Lillesand TM, Kiefer RW 1999. Remote sensing and image interpre-tation, John Wiley & Sons, New York, 708 pp.
Lillesand TM, Keifer RW, Chipman JW 2004. Remote sensing and im-age interpretation, 5th ed., John Wiley & Sons, New Jersey, 645 pp.
Moore CG 2008. Interdisciplinary research in the ecology of vector-borne diseases: opportunities and needs. J Vector Ecol 33: 218-224.
Mushinzimana E, Munga S, Minakawa N, Li L, Chen C, Bian L, Kitron U, Schmidt C, Beck L, Zhou G, Githeko AK, Yan G 2006. Land-scape determinants and remote sensing of anopheline mosquito larval habitats in the western Kenya highlands. Mala J5: 13.
Napier LE, Smith ROA 1926. A study of the biopnomics of Phleboto-mus argentipes with special reference to the conditions in Cal-cutta. Indian Med ResMem4: 161-172.
Palit A, Sudhakar S, Srinivas T, Kesari S, Ranjan A, Kumar V, Kishore K, Adiga S, Bhattacharya SK 2001. Remote sensing and GIS in Kala-azar transmission prediction in Bihar - Application of new tools. Strategies on control of Kala-azar and Malaria,
Proceedings of WHO workshop, WHO, Geneve, 10 pp.
Patza JA, Graczykb TK, Gellera N, Vittor, AY 2000. Effects of en-vironmental change on emerging parasitic diseases. Internat J Parasitol 30: 1395-1405.
Ready PD 2008. Leishmaniasis emergence and climate change. Im-pact on the epidemiology and control of animal diseases. Rev Sci Tech Off Int Epiz27: 399-412.
Remaudière G 1992. A simplified method for mounting aphids and oth-er small insects in Canada balsam. Rev Fr Entomol14: 185-186.
Rinaldi L, Musella V, Biggeri A, Cringoli G 2006. New insights into the application of geographical information systems and remote sensing in veterinary parasitology. Geospatial Health 1: 33-47.
Rosenfield GH, Fitzpatrick L 1986. Kappa coefficient of agreement as a measure of thematic classification accuracy. Photogram Eng Remote Sensing52: 223-227.
Schlein Y, Jacobson RL 1999. Sugar meals and longevity of the sand-flyPhlebotomus papatasi in an arid focus ofLeishmania major
in the Jordan Valley.Med Vet Entomol13:65-71.
Singh R, Lal S, Saxena VK 2008. Breeding ecology of visceral leishmaniasis vector sandfly in Bihar state of India. Acta Trop-ica107: 117-120.
Sivagnaname N, Amalraj DD 1997. Breeding habitats of vector sand-flies and their control in India. J Commun Dis 29: 153-159.
Sharma S, Singh S 2008. Insect vectors of Leishmania: distribution, physiology and their control. J Vector Borne Dis45: 255-272.
Sharma VP, Srivastava A 1997. Role of Geographical Information System in malaria control. Indian J Med Res106: 198-204.
Sudhakar S, Srinivas T, Palit A, Kar SK, Battacharya SK 2006. Map-ping of risk prone areas of kala-azar (visceral leishmaniasis) in parts of Bihar state, India: an RS and GIS approach. J Vect Borne Dis43: 115-122.
Swaminath CS, Short HE, Anderson LAP 1942. Transmission of In-dian kala-azar to man by the bite of P. argentipes. Indian J Med Res30: 473-477.
WHO - World Health Organization 2000. WHO Report on global sur-veillance of epidemic-prone infectious diseases. WHO/CDS/CSR/ ISR/20001. Available from: whqlibdoc.who.int/hq/2000/WHO_ CDS_CSR_ISR_2000.1.pdf.