i
ESCOLHA DE INDICADORES PARA UM RELATÓRIO
SELECTION OF INDICATORS FOR A REPORT
Mariana Stobbaerts de Faria Pereira Nunes
i
MEGI
2015
Título: Escolha de Indicadores para um Relatório Mariana Stobbaerts de Faria Pereira
ii
NOVA Information Management School
Instituto Superior de Estatística e Gestão de Informação
Universidade Nova de Lisboa
ESCOLHA DE INDICADORES PARA UM RELATÓRIO
por
Mariana Stobbaerts de Faria Pereira Nunes
Dissertação apresentada como requisito parcial para a obtenção do grau de Mestre em Gestão de Informação, Especialização em Gestão dos Sistemas e Tecnologias de Informação
Orientador: Roberto Henriques
iii
RESUMO
Esta dissertação visa organizações que implementaram um sistema de Business Intelligence (BI), sem documentar a razão para a escolha dos indicadores utilizados. Tomámos como exemplo para apresentar a metodologia um estudo de caso fictício de uma organização chamada, BestBread. O objetivo desta dissertação é demonstrar e identificar não só os indicadores necessários num relatório, mas também descrever a sua necessidade através de uma representação dos objetivos de negócio da organização.
A abordagem apresentada nesta dissertação foca-se principalmente na utilização de duas metodologias, uma notação simplificada do modelo de Business Intelligence (BIM) e uma abordagem sistemática que visa justificar indicadores de BI através de uma taxonomia e dos objetivos de um relatório.
A abordagem criada fornece orientação para as organizações que já implementaram uma ferramenta de BI, fornecendo um método para comparar a escolha de indicadores através de duas prespectivas, intuitiva e sistemática, considerando as possibilidades existentes no sistema BI de uma organização. A abordagem é aplicada com o objetivo de definir os indicadores significativos para um relatório. As etapas necessárias a executar são as seguintes:
1- Modelar os objetivos da organização;
2- Escolher os indicadores através de uma perspetiva intuitiva;
3- Verificar a existência dos indicadores identificados na perspetiva intuitiva; 4- Escolher os indicadores através de uma perspetiva sistemática;
5- Verificar a existência dos indicadores identificados na perspetiva sistemática; 6- Fazer uma comparação global.
A abordagem descrita na dissertação pode permitir uma maior facilidade na identificação e na explicação dos indicadores a utilizar num relatório. Além disso, a metodologia apresentada pode ajudar na fase de implementação do sistema BI a permitir aos utilizadores visualizar e identificar, através das representações criadas, quais os indicadores que avaliam os seus objetivos de negócio. Desta forma, o resultado da abordagem apresentada na dissertação poderá provocar uma melhoria ao nível do uso e aceitação da ferramenta, podendo contribuir para uma melhor satisfação dos utilizadores.
PALAVRAS-CHAVE
iv
ABSTRACT
This dissertation is aimed at helping organizations that implemented a Business Intelligence (BI) system without documenting to identify the reasons for the indicators choice either in the conception phase of the project or other. The example taken to present the methodology is a fictitious case study of an organization named BestBread.
The aim of this dissertation is to demonstrate not only the necessary indicators in a report but also to describe why they are needed through a business goal representation.
This dissertation approach focus mainly in using two methodologies, a simplified notation of the Business Intelligence model (BIM) and a systematic approach that aims to justify BI indicators through modelling report goals.
This approach provides guidance to organizations that already implemented a BI tool by presenting a method to compare intuitive and systematic selection of indicators with the BI system existing indicators.
The approach is applicable to define in a report its significant indicators. The steps needed to be executed are the following:
1- Model business goals;
2- Select indicators through an intuitive perspective;
3- Verify the indicators existence identified in the intuitive perspective; 4- Select indicators through a systematic perspective;
5- Verify the indicators existence identified in the systematic perspective; 6- Make a global comparison.
The dissertation approach allowed an easier way to identify and explain the purpose of indicators to be used in a report. Also, the methodology presented could help the BI deployment phase to be quicker since users would be able to visualise through the representations the evaluation that the indicators could evoke in their business goals. Therefore, it could improve the use of the BI tool, its
acceptance and maybe even users’ satisfaction with the tool.
KEYWORDS
v
TABLE OF CONTENTS
1.
Introduction ... 1
2.
State-of-the Art ... 3
2.1. Business Intelligence Modelling ... 4
2.2. Modelling Report Goals To Justify BI Indicators ... 6
2.2.1.
Methodology to Model Report Goals and to Justify BI Indicators ... 8
3.
Approach Proposed ... 11
3.1. Adaptation of the Business Intelligence Model ... 11
3.2. Adaptation of the Modelling reporting goals to justify BI indicators ... 13
4.
Methodological Process ... 14
4.1. Model Business goals ... 14
4.2. Select indicators through an intuitive perspective ... 15
4.3. Verify the indicators existence identified in the intuitive perspective ... 17
4.3.1.
Represent the existing indicators selected intuitively ... 17
4.3.2.
Calculate the dissimilarity ... 18
4.4. Select indicators through a systematic perspective ... 20
4.5. Verify the indicators existence identified in the systematic perspective ... 22
4.5.1.
Represent the existing indicators selected systematically ... 22
4.5.2.
Calculate the dissimilarity ... 23
4.6. Make a global comparison ... 25
5.
Discussion ... 27
6.
Conclusion ... 28
7.
Limitations and Recommendations for Future Work ... 29
8.
References ... 30
9.
Appendix ... 32
9.1. Representation of BestBread Reporting intentions ... 32
vi
TABLE OF FIGURES
Figure 1 - Fragment of BIM schema for banking industry ... 4
Figure 2 - Taxonomy of Reporting Goals ... 7
Figure 3 - Reporting Intentions ... 8
Figure 4 - Representation of BestTech Reporting Intentions ... 8
Figure 5 - Fictitious example of the BIM adaptation ... 12
Figure 6 - Meta-Model of the adapted BIM created for the approach ... 12
Figure 7 - Representation of BestBread Business Goals ... 15
Figure 8 - Representation of the BestBread reporting indicators selected intuitively ... 16
Figure 9 - Representation of BestBread current existing indicators selected intuitively ... 17
Figure 10 - Representation of BestBread percentage of indicators effect on the business
goals ... 19
Figure 11 - Representation of BestBread Reporting intentions (appendix 1) ... 21
Figure 12 - Representation of the BestBread reporting indicators selected systematically ... 22
Figure 13 - Representation of BestBread current existing indicators selected systematically 23
Figure 14 - Representation of BestBread percentage of indicators effect on the business
goals ... 24
Figure 15 - Representation of BestBread indicators selection for the S&OP report ... 25
TABLE INDEX
Table 1 - List of indicators candidates for BestTech ... 9
vii
LIST OF ACRONYMS AND ABBREVIATIONS
BI Business Intelligence BIM Business Intelligence Model BMM Business Motivation Model BSC Balance Scorecards
CRM Customer Relationship Management
DA Data Access
ERP Enterprise Resource Planning GM Goal Modelling
IS Information System IT Information Technology R&D Research & Development RE Requirements Engineering S&OP Sales & Operations Planning
SM Strategy Maps
1
1.
Introduction
Business Intelligence (BI) focuses on the evaluation of facts through measures (Richard Dealtry 1994). It should suppport the finding of indicators values that could be considered by the decision maker in a decision-making process (Fülöp 2001). In this way, it would allow the transformation of data into meaningful and useful information. However, to create such valuable information, facts need to be evaluated by the right indicators.
Identifying indicators to use in a report is always possible. The difficulty is to be able to choose the indicators that have a real significance for the report goals. In most cases the process of identifying the report indicator is done intuitively by experienced controllers. The result is the selection of the indicators needed and, normally, there is no demonstration of why are these indeed needed. Consequently, there is an absence of justification for choosing an indicator making its relevance difficult to perceive by users.
Therefore, it is not always clear to those receiving a report, the reason an indicator is included. Although, if the link between purpose and indicator were identified it could be easier to understand the choice made.
From organization to organization and from person to person, the functions, the processes and the information needed to make decisions can vary. Before making a decision or acting, it is important to have a better understanding of the organization reality and by recognising the indicators that evaluate the organisation goals we are able to examine the current situation contemplitying what are the indicators that effect each goal.
As a result, the scope of the methodology presented in this work intends to help organizations to not only use the right indicators to evaluate the report goals but also to suggest a represention model that allows the recognition of the link between the report goals and its indicators.
Furthermore, the methodology created concernes organizations that have already implemented a BI solution. It aims to help organization in:
Identifying what are the relevant indicators needed to make a decision.
Identifying if there are new indicators that should be collected.
Defining how the BI tool can be a mean to analyse business goals.
Increasing the users’ acceptance level.
Increasing the proper use of the BI tool.
Accelerating and standardizing the deployment process.
2 applied a systematic and intuitive approach to a real case study example for an organization that had this experience.
Similarly, the dissertation aimed to demonstrate and elicit not only the significant indicators needed in a report but also to describe why they were needed through a representation of the report goals. In this dissertation, we had also a focus on the Business Intelligence model (BIM) and a systematic approach that aims to justify BI indicators through modelling report goals methodologies.
The steps needed to be executed in the approach were the followings: 1- Choose report;
2- Model report goals;
3- Model intuitive users’ perspective of the report;
4- Model existing system regarding intuitive users’ perspective;
5- Model a systematic users’ perspective of the report: preliminary analysis, define candidate indicators, define activity area, define focus, define source, define time horizon, define goals, select final indicators;
6- Model existing system regarding the systematic users’ perspective; 7- Compare all models.
3
2.
State-of-the Art
Information systems (IS) have become a main component of enterprises (Nurcan et al. 2010) and meaningful for their success. IS are software and hardware systems that support people to capture, storage, process and transmit data. “To improve business operations or processes” is one of the prevalent motivations for the adaption of IS (Cruz-Cunha 2009).
Currently business processes are mainly covered through the use of Enterprise Resource Planning (ERP) systems, whereas relationships with partners and clients are considered in Supply Chain Management (SCM) and Customer Relationship Management (CRM) systems (Cheng 2009). Through the use of these systems, data regarding the organization has become easier to obtain. Business Intelligence (BI) systems intend to collect data from these different systems (ERP, SCM and CRM). Within the context of key business processes, BI is used to identify, extract, and analyse business data that may lead to decisions and actions and that may result in improved business performance
(Jandoš 2012). The BI can not only enable an organization to react quickly, analyse trends in customer behaviour and make informed decisions but also unify and provide a single point of truth for the main indicators while supporting direct data consolidation.
Despite these possibilities, “experience of working with and talking to business and IT leaders in major companies in a variety of industries suggests that companies are still data1-rich but information2-poor” (Williams & Williams 2007). In other words, enterprises lack relevant information3 that allows them to perform appropriate actions.
BI tries to fulfil this need: it is about getting the right information, to the right decision makers, at the right time. Through lagging4 and leading5 metrics, the evaluation of cycles and restructuration of processes (Deming cycle6) can be monitored through BI systems. Since the BI gives insight into the business it might be considered essential to gain competitive edge.
Many organizations merely use BI to “produce reports, with a vague understanding of how information can benefit the organization. Others, as Western digital, have used BI to reduce
operating costs by 50%” (Williams & Williams 2007). We can state that BI has proven potential to improve profits and performance, but it will only be reached if it is used properly.
To have the best possible return on a BI investment, “business information, business analyses, and
business decisions, and the way it creates business value must be specifically determined for each
company” (Williams & Williams 2007). It is essential to contemplate that “BI investments are wasted
1Data are symbols of the reality, i.e. facts, numbers, images, drawings (Boisot & Canals 2004).
2Information is data that has been given meaning by way of relational connection. The interpretation of
information can be relative depending with the way individuals interpret the model that gives meaning to the data (Boisot & Canals 2004).
3Relevant information is information that is available at the right time and detail level, accurate, reliable,
accessible and presented in correct form (Boisot & Canals 2004).
4Lagging metrics are metrics related to current events (Burnay et al. 2014) 5Leading metrics are metrics related to future events (Burnay et al. 2014)
6Deming cycle defines the cycle, Plan-Do-Check-Act, which is a model for continual process
4 unless they are connected to specific business goals, analyses, decisions, and actions that result in
improved performance” (Williams & Williams 2007).
There are several existing modelling techniques that offer concepts that are useful in bridging the business landscape to BI data, as Business Motivation Model (BMM) (OMG 2009), Strategy Maps (SM) (Kaplan & Norton 2004), Balance Scorecards (BSC) (Kaplan & Norton 1996), Strength, Weakness, Opportunities, and Threats (SWOT) analysis (Richard Dealtry 1994) and Goal Modelling (GM) (Yu 1997), (Dardenne et al. 1993).
For the approach proposed in this dissertation, we will use a simplification of the Business Intelligence Model (BIM) (Barone, Mylopoulos, et al. 2010). A modelling language for the business world simple to understand since it uses familiar concepts as goals, processes, situations, influences and indicators.
In the next sections of this chapter, we start by explaining the BIM, and then we will explain a methodology that focus in a systematic process which supports and justifies the identification of the indicators that should be used for a specific report.
The BIM and the systematic methodology will allow us to create a new approach to guide the selection of significant indicators for a report.
2.1.
B
USINESSI
NTELLIGENCEM
ODELLINGThe BIM is a method of representing in an organized way the objectives, risks and measures of a business. The BIM is a complex model that considers several concepts and relationships (Horkoff et al. 2012). The aim of the model is to “help business users to organize and make sense of the vast
amounts of data about the enterprise and its environment”(Horkoff et al. 2014). It offers familiar concepts to business decision making such as goals, situations, influences, and indicators. A version of the meta-model linking the BIM concept can be found in (Barone, Mylopoulos, et al. 2010) and (Barone, Yu, et al. 2010).
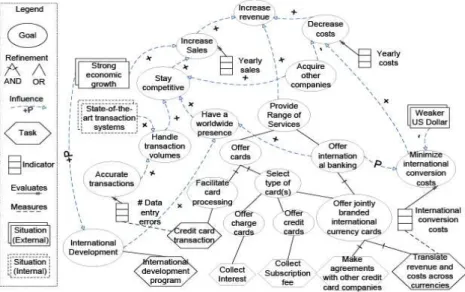
Figure 1 shows a portion of a realistic BIM schema for the credit card industry (Borgida et al. 2012).
5 BIM focuses on five types of concepts: Entities, Tasks, Indicators, Situations and Goals.
As in IS, the entity concept represents the entities that are relevant to the business schema. In the BIM its representation is not displayed in the schema but it is contemplated as one of the concepts that will be affected, in the case presented in figure 1, two examples of entities are “Credit_Card” and “User_Account”.
A task is a process or set of actions. In the example, “Make agreements with other credit card companies” is a task made by the banking industry.
The indicators represented allow a conceptual bridge connecting the business schema to data found in a variety of data sources. An example showed in figure 1 is “# Data entry errors”.
The situations are illustrations of world factors that can be classified as either internal or external and may impact the business objectives. For example, “Weaker Us Dollar” is an external situation that impacts negatively a goal. In BIM, the situations, specializes in demonstrating the business goals, organizational situations and domain assumptions.
Finally, a goal symbolizes an intentional situation that is desired by the organization. For example,
“Increase revenue”. Whereas an organizational situation is a situations which have an impact on business objectives. For example, “Strong economic growth”.
BIM focuses on four relationships between the concepts explained previously: Influences, Refines, Evaluates and Measures.
The influences are relationships representing the transmission of (un)favourable effects on
situations, including goals and organizational situations. For example, “Weaker US Dollar” is a threat
with respect to “Minimize international conversion cost”, and the situation “Strong economic
growth” is an opportunity with respect to the “Increase Sales” goal.
Refines is the refinement of a concept, providing a more concrete evidence of the concept. For
example, the goals of “Offer cards” and “Offer international banking” refine “Provide range of services” independently, so it is an OR refinement relationship. Whereas, the goal “Offer cards” is refined in two depending goals “Facilitate card processing” and “Select type of card(s)”, so it is an
AND refinement relationship.
Evaluates is the connection between an indicator and a situation, since the indicator is evaluating the situation (and hence goals). For example, “International conversion costs” evaluates the goal
“Minimize international conversion costs”.
Lastly, an indicator can be associated with a particular task via the measures relationship. For
example, “International conversion costs” is associated with data produced by the task “Translate
6
2.2.
M
ODELLINGR
EPORTG
OALST
OJ
USTIFYBI
I
NDICATORSThe recognition of reporting goals should be done during the Requirement Engineering (RE) phase of a BI project. This task can help in identifying expected indicators needed to analyse the organization business.
According to (Burnay et al. 2014), to support the BI indicators choice through a report goal model it is essential to understand: the dimensions and the report goal taxonomy. This concepts will help us to comprehend the methodology explain in (Burnay et al. 2014).
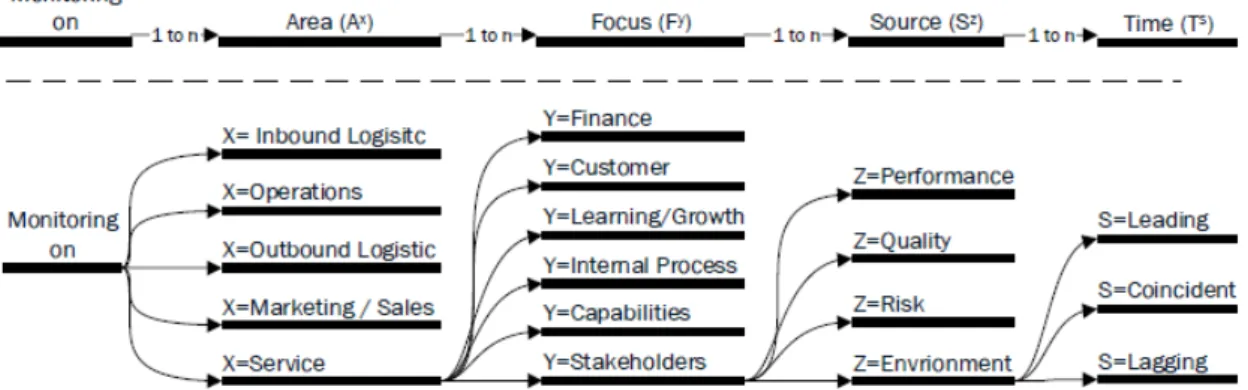
Firstly, the dimensions can be separated in four different types: Activity Area, Focus, Source and Time Horizon.
Activity Area: It identifies the location of the monitoring focus (i.e. where to monitor) and has 5 levels:
1. Inbound Logistics monitoring (AIL), deals with the receiving and storing of externally sourced supplies, data, etc. used in running the business;
2. Operation Indicators monitoring (AO), corresponds to the tasks and processes involved in manufacturing of products/services;
3. Outbound Logistics monitoring (AOL), contemplates the activities related to getting goods/services to buyers;
4. Sales/Marketing monitoring (ASM), considers the communication activities to consumers about products/services, of purchasing behaviour of the customers;
5. Service monitoring (AS), represents the activities associated with interacting with consumers after the product is sold to them.
Focus: It describes the subjects that must be monitored (i.e. what should be monitored) and has 6 levels:
1. Financial monitoring (FF), considers the growth strategy, profitability and risk; 2. Customer monitoring (FCust.), corresponds to the value creation and differentiation; 3. Process monitoring (FP), contemplates the various business processes;
4. Learning and Growth monitoring (FLG), deals with the climate that supports organizational change, innovation and growth;
5. Stakeholders monitoring (FS), represents the stakeholders needs;
7 Source: It identifies the nature of information that is used to operationalize monitoring (i.e. how to monitor it) and it has 4 levels:
1. Performance monitoring (SP), contemplates the tasks in a process, and intends to help understand how well a process is being performed;
2. Quality monitoring (SQ), deals with deliverables of a process, and intends to describe the quality of these deliverables;
3. Risk monitoring (SR), corresponds to potential troubles related to a process, and it intends to prevent losses, damages and other exposures;
4. Environment monitoring (SE), considers the facts that are not under the control of the organization.
Time Horizon: It defines the moment that the monitoring phenomenon is expected to happen (i.e. when to monitor) and it has 3 levels:
1. Leading monitoring (T+), corresponds to future phenomena;
2. Coincident monitoring (T0), considers phenomena that are currently happening; 3. Lagging monitoring (T-), deals with phenomena that are no longer happening.
Secondly, the taxonomy for reporting goals is a systematic way to support RE in identifying and documenting reporting goals. In figure 2, a taxonomy of reporting goals is represented, this taxonomy enables to distinguish 360 (6*4*3*5) types of reporting goals.
8
2.2.1.
Methodology to Model Report Goals and to Justify BI Indicators
The methodology that allows the identification of the reporting goals and the indicators selection, explained in (Burnay et al. 2014), is exemplified and described in the next eight sub-sections.
The example exposed below is detailed in (Burnay et al. 2014) and is adapted from BestTech, a case study used to demonstrate the BIM models (Barone, Yu, et al. 2010).
2.2.1.1.
Preliminary analysis
Collect information about business goals that are expectations to be monitored in the report in analysis and create a model to represent these goals.
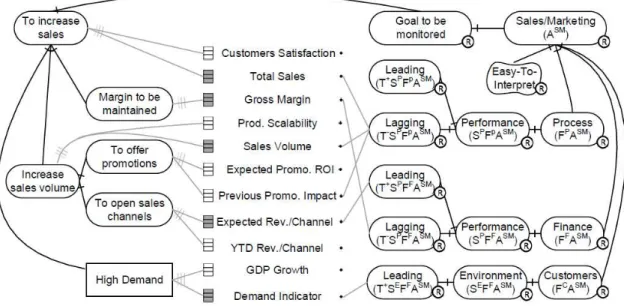
The figure 3 represents the way the reporting intentions might be presented and in left-side of the figure 4 the result of this exercise presents the BestTech reporting intentions.
Therefore, we might noticed that BestTech main goal is to increase sales and this could be achieved by maintaining the gross margin while increasing the sales volume and is expected to work only if the market demand is high enough.
Figure 3 - Reporting Intentions
9
2.2.1.2.
Define candidate Indicators
Establish with users a list of indicators that could theoretically be used to monitor the business goals described in the previous point. Nevertheless the reporting intentions should not be considered here. This step is to be made through a brainstorm and all relevant indicators should be documented without considering the reporting intentions.
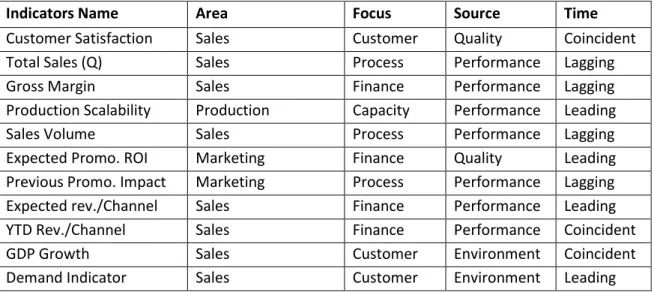
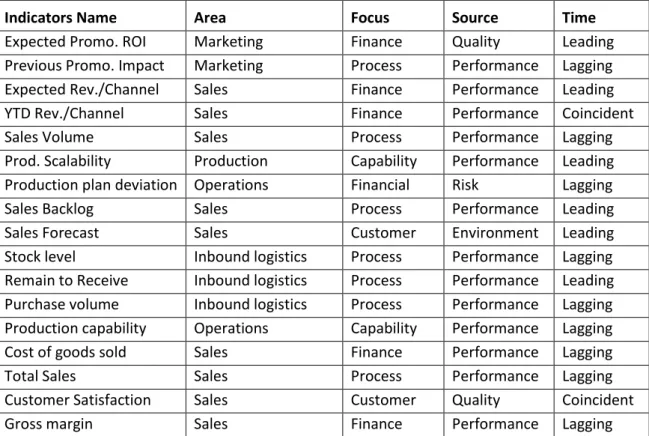
However, the indicators should account for the four reporting dimensions and the expected outcome is a list such as the one recognised in the table 1. Also, the indicators should be represented in the centre of the model illustrated in figure 4.
Indicators Name Area Focus Source Time
Customer Satisfaction Sales Customer Quality Coincident
Total Sales (Q) Sales Process Performance Lagging
Gross Margin Sales Finance Performance Lagging
Production Scalability Production Capacity Performance Leading
Sales Volume Sales Process Performance Lagging
Expected Promo. ROI Marketing Finance Quality Leading
Previous Promo. Impact Marketing Process Performance Lagging
Expected rev./Channel Sales Finance Performance Leading
YTD Rev./Channel Sales Finance Performance Coincident
GDP Growth Sales Customer Environment Coincident
Demand Indicator Sales Customer Environment Leading
Table 1 - List of indicators candidates for BestTech
The next steps of this methodology consider the reporting intentions. It consists in questioning the reporting goals to reflect and only maintain goals that actually reflect the reporting intentions.
2.2.1.3.
Define activity area
For each business goal, decide the area on which monitoring is expected.
As explained before, it is possible to monitor five different activity areas: Inbound Logistics Monitoring; Operation Indicators Monitoring; Outbound Logistics Monitoring; Sales/ Marketing Monitoring; Service Monitoring.
Notice that you can select more than one activity area to monitor a goal and you should do this every time your business goals are related with different areas.
2.2.1.4.
Define focus
10 As mentioned earlier, it is possible to monitor six different focus levels: Financial Monitoring; Customer Monitoring; Process Monitoring; Learning and Growth Monitoring; Stakeholders Monitoring and Capabilities Monitoring.
One can select more than one focus subject when an activity area is related with different subjects.
2.2.1.5.
Define source
For each focus, decide the kind of information that will be used for monitoring.
As referred in the past, it is possible to monitor four different source levels: Performance Monitoring; Quality Monitoring; Risk Monitoring; Environment Monitoring.
You should select more than one source whenever a focus subject is related with different sources.
2.2.1.6.
Define time horizon
For each source, decide the moment that it is expected to be monitored.
As explained in the state-of-the art, it is possible to monitor three different time horizon levels: Leading Monitoring; Coincident Monitoring; Lagging Monitoring.
Each time a source should be monitored in different moments, you should select several time horizons accordingly.
The result of these four last steps (3-6) can be shown in right-side of the figure 4 and it identifies the refinement of the global goal into sub-goals that model the reporting goals of stakeholders.
2.2.1.7.
Define goals
In this phase document possible remaining reporting goals that were not considered before. It usually takes place as meetings, interviews or questionnaires.
In the BestTech example it was consider that the report should be “Easy-to-interpret”, notice in the right side of the figure 4 this soft goal 7represented.
2.2.1.8.
Select final indicators
In this last step the selection and documentation of indicators that should be used for monitoring and fit both documented business and reporting goals is made. In the example exposed the final choice is represented by the shaded indicators, notice them in figure 4.
7 Soft goals correspond to desirable business objective which can only be considered successful in
11
3.
Approach Proposed
After a reflection about how to proceed in this research, we decided to create a methodology that considers a combination and simplification of both sub-chapters presented in the previous section. Our hypothesis is twofold: firstly, we consider that the taxonomy is useful for defining a systematic way to identify indicators and secondly, the use of the concept of a reporting goal is a relevant way to formalize the reason behind a report. Obviously combining goals and indicators looks as a pertinent solution to our problematic.
Therefore, instead of simply asking users what are the indicators needed by them, we will also use the taxonomy to allows the selection of indicators given a shared business goal. Consequently, we will propose a methodological process to identify indicators through an intuitive and systematic perspectives. This will help grounding the reasoning to establish indicators on a solid and sound basis.
In this chapter we will explain the assumptions made and the way we adapted the existing methodologies in this dissertation. We will begin clarifying our adaption of the business intelligence model used in the methodological process. Then, we will describe how we applied the methodology
“Modelling report goals to justify the BI indicators”.
3.1.
A
DAPTATION OF THEB
USINESSI
NTELLIGENCEM
ODELThe BIM can help describing the reasons why an indicator is used in a report but it considers a lot of concepts and relationships that can create confusion in the mind of common report users.
Therefore, in this approach, when using the BIM, we decided to consider only concepts more likely known by users. The used concepts are: goals and indicators; and the relationships are: refines and evaluation.
- Goal: representing an intentional situation that the business intends to reach. For example, from figure 5 we can consider goals as: “Maximize profit”, “Increase sales volume”, “Increase margins”,
“Lower costs” and “Higher prices”.
- Indicator: is a metric that helps to align the daily activities with a strategic intentional situation by evaluating the performance or the degree of fulfilment of that goal. For example, from figure 5 we can see indicators as: “Sales volume” and“Cost of goods sold”.
- Refines: used to refine things. In goal modelling, refinements can be consider as AND/OR goal decomposition into sub-goals. AND refinement is considered when the attainment of a goal depends on the satisfaction of its sub-goals. If the goal may be satisfied through different sub-goals it is considered as an OR refinement. If we consider the example from figure 5, the goal “Increase sales volume” is an AND refinement of the goal “Maximize profit”, whereas “Lower costs” is an OR
12 - Evaluation: demonstrates the way a goal can be evaluated by an indicator. For example, from the figure 5, this relationship is represented between the “Sales volume” indicator and the goal “Increase sales volume”. The link demonstrates that the indicator “Sales volume” evaluates the fulfilment of
the goal “Increase sales volume”. The same happens with the “Total Sales” indicator evaluating the
goal “Higher prices”.
Figure 5 - Fictitious example of the BIM adaptation
Figure 6 shows the Meta-Model to consider in the models created in this dissertation approach. The rectangles represent the concepts and the diamonds correspond to the relationships that can exist between the elements. Inside these two symbols, rectangles and diamonds, you will notice that you can see not only the elements names but also their visual representation.
Accordingly, we can notice through the figure 6 that the goals can possess three different type of relationships: AND Refinement, OR Refinements and Evaluation. The first two, AND/OR Refinements, are relationships possible only between goals, whereas the last, Evaluation, defines the relationship between a goal and an indicator. Correspondingly, the figure 5 demonstrates the application of the Meta-Model represented through the figure 6.
13
3.2.
A
DAPTATION OF THEM
ODELLING REPORTING GOALS TO JUSTIFYBI
INDICATORSThis methodology, which has been previously explained in the state-of-the art section “Modelling
reporting goals to justify BI indicators”, exposes a systematic approach to select indicators regarding the organization business goals and the reporting goals.
After considering the approach that this past research has offered we concluded that it would be interesting for our solution to keep in mind all the different steps that it presents.
Nevertheless, we considered that the 1st (preliminary analysis) and part of the 2nd (define candidate indicators) steps should impact not only the systematic perspective but it should also impact the intuitive perspective that our approach wishes to integrate and contemplate.
Our approach desires to enable a comparison between the two different perspectives, intuitive and systematic, and it intends to consider the importance of the business goals in each of these perspectives.
Therefore, in the methodology presented in this work, step 1 will be implemented as one of the first steps of the approach, enabling us to create a unique goal model that will be consider for both perspectives.
Whereas the step 2, which consists in identifying the indicators that theoretically could be used to monitor the business goals collected, should be contemplated as one of the phases to create the intuitive perspective. Nevertheless the table created defining the dimensions that these indicators transmit should only be executed in the systematic perspective related steps.
14
4.
Methodological Process
As mentioned in the introduction chapter the approach presented in this dissertation is dedicated to organizations that have already implement a BI system, and consequently already possess a limited variety of indicators in that system.
One important goal of the methodology presented is to identify the indicators that are relevant to monitor an organization strategic goals. This approach was created to avoid organizations that already implemented a BI system to follow the error of monitoring only the indicators that currently exist in their deployed BI solution system.
One important fact to notice is that all the steps in the presented methodology will have a relevant and coherent result only if done with the collaboration of several experience business controllers. We present six different steps to enable, as much as possible, a comparison between the indicators selected through the intuitive and the systematic perspectives and the available indicators in the implemented BI system.
In the following section we present the methodological steps with one example related to a fictitious bread manufacturing organization: BestBread. In the example, BestBread intends to find what are the indicators need to use in their monthly Sales & Operations Planning (S&OP) report.
S&OP report consists in creating a report that determines the success in meeting customer demands and supply needs. The S&OP process is a single operating plan that identifies where to allocate the organizations resources, as time, money and employees.
There are mainly operational decisions that can be triggered after analysing a S&OP report, as deciding the amount of material to be purchased and the amount of products to be produced.
4.1.
M
ODELB
USINESS GOALSThe first step consists in identify the correct goals to analyse the organization operations and strategic evolution in order to recognize the situations that could enable the organization to gain competitive advantage. Furthermore, we need to make them explicit and evident by showing them in a goal model.
Notice that this step is also contemplated in the stage 1 of the methodology “Modelling reporting goals to justify BI indicators” explained previously and in (Burnay et al. 2014). As mentioned in chapter 3.2, we will create a unique goal model that will be consider in both presented perspectives. Therefore, the result of this step would be the same as the one produced by the 1st step of the
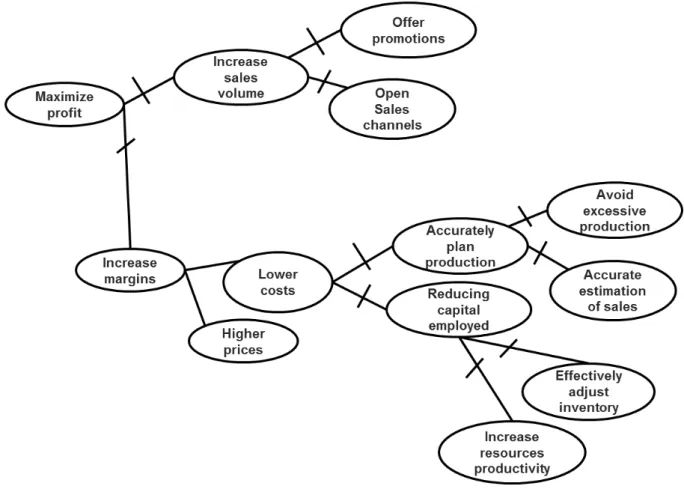
15 In figure 7, using BIM, an example of the business goal model for the BestBread organization is displayed.
The primary purpose of the BestBread organization is to maximize their profit. In order to reach this goal the organization will need to increase their margins, while increasing their sales volume.
From figure 7 we can notice that to increase sales volume the organization will need to offer promotions and to open sales channels. While, to increase their margins, BestBread will need to lower their cost or to higher their prices. To lower organization costs BestBread should, in one hand, accurately plan the organization production by avoiding excessive productions and accurately estimate their sales, and in the other hand reduce the employed capital by effectively adjusting inventory and increasing resource productivity.
Figure 7 - Representation of BestBread Business Goals
4.2.
S
ELECT INDICATORS THROUGH AN INTUITIVE PERSPECTIVEIn this step the identification of the indicators to use in the S&OP report is made. As in the 2nd step of
16 through a brainstorm with business controllers, also the business goals model created in the first step should be used to help identifying relevant indicators related to those business objectives. This step can be simpler to obtain if the same persons that helped creating the business goals model are also involved.
In contrast with 2ndstep of the methodology “Modelling reporting goals to justify BI indicators”, the result of this step will not include a candidate indicators list and their dimensions. The product of this step is a model representing the indicators selected intuitively and its meta-model is explained in figure 6. This will allow us to identify what are the indicators considered important in the controllers’ perspectives.
The result of this exercise might be influenced by what controllers know, and what currently exists in the system. Consequently, there might be indicators that monitor the business goals but do not possess relevance in the selected report. In order to overcome this difficulty, in step 4 of the approach proposed, a systematic approach will also be applied.
Considering the BestBread S&OP report, we may find the related business goals and the intuitive indicators displayed in figure 8. As an example, we can see from the figure, indicators as “Sales
Volume” and “Gross margin” that allow the measure of business goals as “Increase sales volume”
and “Increase margins”.
17
4.3.
V
ERIFY THE INDICATORS EXISTENCE IDENTIFIED IN THE INTUITIVE PERSPECTIVEThis step consists in verifying if the indicators identified in the previous step 2 currently exist in the BI system implemented by the organization. This will help us to understand if the intuitive perspective is currently reflected in the system.
Also, we intend to calculate if the dissimilarity between the intuitive perspective and the BI system deployed is relevant and in witch way it could impact the monitoring of the business goals.
4.3.1.
Represent the existing indicators selected intuitively
For a better illustration, create a model to demonstrate which are the indicators intuitively evoked that the current BI system supports.
Taking into account the BestBread organization example, we can find in figure 9 a model demonstrating the indicators that exist in their BI system, where the indicators that do not exist in the BI system are strikethrough.
Figure 9 - Representation of BestBread current existing indicators selected intuitively
18 Rev./Channel”, “Cost of goods sold”, “Sales Forecast”, “Prod. Scalability”, “Customer Satisfaction”,
“Production capability”.
4.3.2.
Calculate the dissimilarity
In order to measure the dissimilarity of the indicators selected through the intuitive perspective and those that do not exist in the system (step 3.1), it is necessary to define the proportion impact that each indicator has in its related business goal.
Therefore, the first phase of the dissimilarity analysis is to identify to which percentage each indicator reflects in the goal that it intends to evaluate.
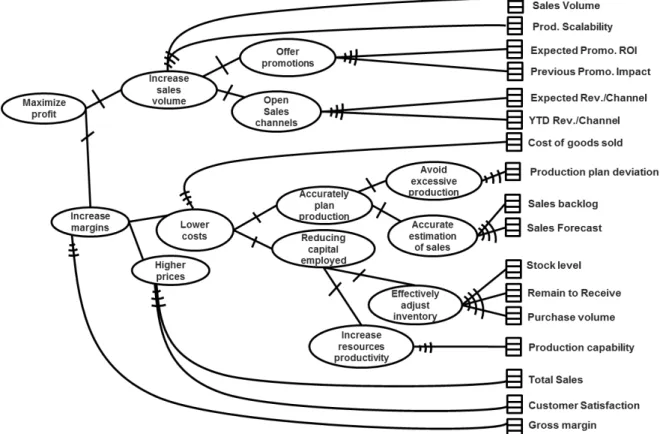
In figure 10 we present, for the BestBread organization, the percentage value that each indicator, existing or not existing in the system, affects in its related evaluated goal.
Theoretically when a goal is evaluated by only one indicator this indicator will fulfil the evaluation by
100%. Notice the example of the indicator “Cost of goods sold” and “Gross margin”. These indicators alone evaluate the goals “Lower costs” and “Increase margins”.
In the case a goal is evaluated by several indicators the evaluation percentage should be distributed through the indicators regarding its importance in evaluating the goal. Observe that in figure 10 the
goal “Increase sales volume” is evaluated by the “Sales volume” and “Production scalability”. The figure 10 demonstrates that for BestBread the “Sales volume” will evaluate 60% of the goal “Increase
sales volume” and the indicator “Production scalability” evaluates 40% of the same goal.
Furthermore the sum of the indicators percentage of evaluation does not always need to be of 100%. If an organization stated that the indicators evaluating the goal have a big effect on the goal evaluation, the sum of both of them can be bigger than 100%. In the example BestBead, the
“Accurate estimation of sales” is evaluated by the “Sales backlog” and by the “Sales forecast”. The
first evaluates 65% of the goal and the second 45%, this means that the combination of both indicator will evaluate 110% of their common goal.
In figure 10 we can find the indicators that do not exist in the system (strikethrough). Therefore we
can notice that there are several goals not totally evaluated as the case of “Increase sales volume”,
which is only 60% evaluated.
The second phase of the dissimilarity analysis is to calculate a total dissimilarity. In this manner follow the explained formula:
TD = ∑ P(a) - ∑ P(e)
Where:
19 Figure 10 - Representation of BestBread percentage of indicators effect on the business goals
Observably, if the result is zero that would mean that the indicators selected intuitively completely reflect the current system. The range of possible values for the result is from 0 to the total of indicators percentage effect on all the goals evaluated in the intuitive perspective. Therefore, there will never be negative result values, as the identification of existing indicators is always developed as an iteration of the indicators selected in the step 2 by eliminating the indicators that are not found in the current BI system.
Bellow you might find the formula explained before applied to the BestBread case.
TD = ∑ P(a) - ∑ P(e) = (0.6+0.4+0.4+0.6+0.5+0.5+1+1+0.65+0.45+0.4+0.3+0.3+1+0.7+0.3+1) –
(0.6+0.6+0.5+1+0.65+0.4+0.3+0.3+0.7+1) = = (10.1) – (6.05) = 4.05
Notice that the impact of the lack of existing indicators in the BI system is related to the following indicators: “Prod. Scalability”, “Expected Promo. ROI”, “Expected Rev./Channel”, “Cost of goods
20
4.4.
S
ELECT INDICATORS THROUGH A SYSTEMATIC PERSPECTIVEIn this phase we implement the steps of the methodology presented in the state of the art chapter 3.2, except the step one (preliminary analysis) and part of the second step (define candidate indicators). Since step 1 has already been implemented in our approach during the first phase (for the BestBread example remember the result in figure 7) and likewise part of the 2nd step of the methodology has been implemented (see the example result in figure 8). The only missing element of the 2nd step that has not yet been addressed is the documentation accounts of the four reporting dimensions related to the candidate indicators identified in step 2 (select indicators through an intuitive perspective) of our methodological process.
Regarding the BestBread S&OP report example, you might find in table 2 the list of candidate indicators and their different dimensions using the taxonomy of reporting goals.
Indicators Name Area Focus Source Time
Expected Promo. ROI Marketing Finance Quality Leading
Previous Promo. Impact Marketing Process Performance Lagging
Expected Rev./Channel Sales Finance Performance Leading
YTD Rev./Channel Sales Finance Performance Coincident
Sales Volume Sales Process Performance Lagging
Prod. Scalability Production Capability Performance Leading Production plan deviation Operations Financial Risk Lagging
Sales Backlog Sales Process Performance Leading
Sales Forecast Sales Customer Environment Leading
Stock level Inbound logistics Process Performance Lagging Remain to Receive Inbound logistics Process Performance Leading Purchase volume Inbound logistics Process Performance Lagging Production capability Operations Capability Performance Lagging
Cost of goods sold Sales Finance Performance Lagging
Total Sales Sales Process Performance Lagging
Customer Satisfaction Sales Customer Quality Coincident
Gross margin Sales Finance Performance Lagging
Table 2 - List of candidate indicators for the BestBread S&OP report
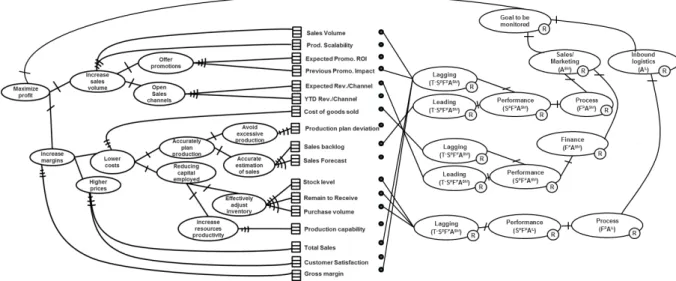
Furthermore, we will focus in identifying the reporting goals dimensions asking the right questions in order to select only the indicators that actually reflect the reporting intentions of the stakeholders. The first dimension to be clarified relates to the area, answering the question “where”: where in the business are the processes that should be monitored?
The second dimension that should be discusses is the focus area, is the clarification of the question
21 The same applies to the following area, the question “how” is asked reflecting the focus source in the particular areas selected and at last the question related to the time of “when” the phenomenon should be monitored is questioned.
In the right side of the figure 11 a visual representation of the reporting goals obtained from these questions is presented. Whereas, in the left side, we can find the business goals and related indicators.
As an example we can observe, in figure 11, that the indicator “Sales Volume” evaluates the
“Increase sales volume” business goal and its reporting goals dimensions (T-SPFPASM) are sales/marketing area (ASM), process focus (FP), performance source (SP) and lagging time horizon (T-). Moreover, for the indicator “Stock Level”, which evaluates the business goal “Effectively adjust
inventory”, its reporting goals dimensions (T-SPFPAIL) are inbound logistics Area (AIL), process focus (FP), performance source (SP) and lagging time horizon (T-).
Figure 11 - Representation of BestBread Reporting intentions (appendix 1)
We can notice that the reporting goals for the BestBread S&OP report example are focusing in sales/marketing and inbound logistics (areas). Whereas the sales areas need to have a particular consideration to finance and processes for the inbound logistics area the attention should be to the processes (focus). For all of these goals it is essential to monitor the performance (Source). As for the sales area, the leading and lagging information (time) should be considered. Regarding the inbound logistics area only the lagging information needs to be considered.
For the next steps, step 7 (Define remaining possible goals) and step 8 (Select final indicators), we assumed that there are no further reporting goals to consider and the selection of the final indicators is shown in figure 12, where all the indicators that are influenced by the reporting intentions are presented.
22 the report intentions. We created this figure to facilitate the upcoming comparisons and the visualization of the systematic result.
Figure 12 - Representation of the BestBread reporting indicators selected systematically
4.5.
V
ERIFY THE INDICATORS EXISTENCE IDENTIFIED IN THE SYSTEMATIC PERSPECTIVEConsidering the indicators selected through the systematic perspective, in this step we will verify if the indicators currently exist in the organization BI system. This will help us to understand if the
systematic users’ perspective is currently reflected in the system.
Furthermore, we intend to calculate if the dissimilarity between the systematic perspective and the system deployed is relevant and in witch way it could impact the monitoring of the business goals.
4.5.1.
Represent the existing indicators selected systematically
To better illustrate this comparison, we create a model to demonstrate which systematically evoked indicators are currently supported by the BI system.
23 Figure 13 - Representation of BestBread current existing indicators selected systematically
Notice that only two indicators identified previously, in the step 4, are strikethrough from the representation in figure 13. These indicates that the “Expected Rev./Channel” and “Cost of goods
sold” indicators were not implemented in the BI system deployed in the BestBread organization. Therefore, the dissimilarity result will surely be lower than the previously found in the step 3.2.
4.5.2.
Calculate the dissimilarity
In order to measure the dissimilarity of the indicators selected through the systematic perspective and those that do not exist in the system (step 5.1), we need to define the percentage that each indicator has in its related business goal.
Therefore, as in the step 3.2, the first phase of the dissimilarity analysis is to identify the percentage of affect that the indicators can reflect in the goal that it intends to evaluate.
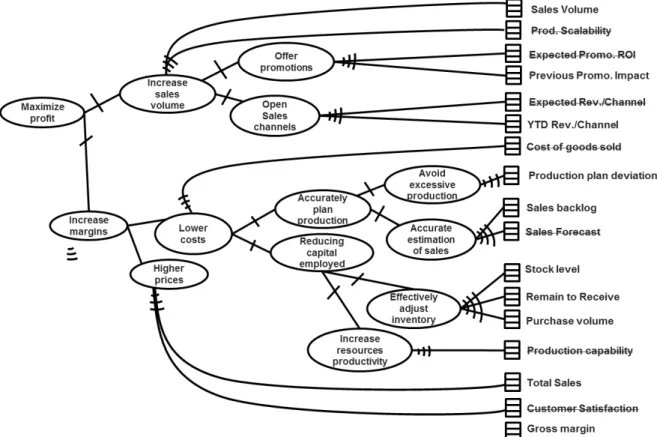
24 Figure 14 - Representation of BestBread percentage of indicators effect on the business goals
The second phase of the dissimilarity focus in analysing what are the goals percentage that cannot be evaluated because the indicators selected do not exist in the system.
In figure 14 we can find the indicators that do not exist in the system strikethrough. Therefore, for
the BestBread example, we can quickly notice that the goals that will not be evaluated are “Open sales channels” and “Lower costs”.
As before, to reach a total dissimilarity it is necessary to follow the formula explained bellow:
TD = ∑ P(a) - ∑ P(e)
Where:
P(a) = Percentage effect that the indicator has in its related goal P(e) = Percentage effect that an existing indicator has in its related goal
Bellow you might find the formula explained before applied to the BestBread case.
TD = ∑ P(a) - ∑ P(e) = (1+1+1+1+1+0.4+0.3+0.3+1+1) – (1+1+1+0.4+0.3+0.3+1+1) = (8) – (6) = 2
Notice that the impact of the lack of existing indicators in the BI system of indicators “Expected
25
4.6.
M
AKE A GLOBAL COMPARISONIn this step we analyse the differences in the several representations created and try to understand the reasons for the dissimilarity identified. Additionally, the selection of the indicators to use in the organization report is completed and can allow the identification of the indicators needs to be implemented in the BI system.
To facilitate the comparison we propose to display all models side by side in a single table and make a discussion with the controllers to select the indicators to be considered when creating the report. For BestBread organization, we noticed in appendix 2 that the representations created in the steps 2-5 are distinct.
From observing the appendix 2, the first visible difference is that the BI system implemented in BestBread is not fully satisfying controllers view in both perspectives. It is also noticeable that the systematic approach enabled us to select fewer indicators to use in the report than the intuitive one. We can also recognise that in this case the systematic perspective is more similar to what the system currently offers as solution than the intuitive perspective. Also through the dissimilarity calculation we can verify that the dissimilarity result of the systematic perspective is only of 200% whereas for the intuitive perspective it is of 405 %. Therefore the intuitive perspective has a higher dissimilarity importance. This might mean that for the systematic perspective the reporting goals were influenced by what exists and what can be used to make the S&OP, while the intuitive perspective does not care for the reporting goals the selection considered is bigger.
Having in mind all dissimilarities existing we created a final model demonstrating the indicators that should assist the production of the S&OP report for BestBread organization. This model is shown in figure 15.
26 The model contemplates indicators proposed in both, intuitive and systematic, perspectives.
From the systematic perspective we considered that all indicators already in the BI system should be
used. Nevertheless the indicator “Cost of goods sold” did not existed in the current BI system but it
was selected in both perspectives. Therefore we recognise that it should be implemented in order to
evaluate the “Lower costs” business goal. From the intuitive perspective, we identify that the
indicator “YTD Rev /Channel”, that already exists in the current BI could be used to evaluate the
“Open Sales Channel” goal despite being an indicator considered in the systematic approach as an indicator to collect only during a current phenomenon.
In conclusion, all the indicators proposed to use in the S&OP report already exist in the BestBread BI
27
5.
Discussion
In this section we will discuss the effects that the methodological process proposed might have if implemented in a real organisation. We will also discuss the pertinent aspects of the whole dissertation.
Firstly, we notice that the methodological process proposed allows the demonstration of how the current BI system could help measure the business goals, making it possible to demonstrate what and why the indicators are needed in a report. This could enabled an improvement in the use of the BI system and in the reduction of possible frustration since users are able to understand what indicators to use and for which purposes.
Surely, in order to analyse and verify the impact in the mentioned issue improvements, the approach should be implemented in a real organization case and it should be applied for several different reports that could be relevant to monitor the business value.
Remarkably, the systematic and intuitive approach allowed us to discover the indicators that have a real significance for the report goal but the final indicators chosen, even being justified, are always depending on the controllers’ selection.
Concerning the objectives that were defined in the beginning of the dissertation project there are several points that we would like to emphasize and comment.
Using the approach application we were able to define the relevant indicator to be used in a specific report (S&OP) and clearly demonstrate how the current BI system helps in the business goals analyse.
Since the users are now capable to directly visualize which indicators measure their business goals, it became easier to demonstrate the BI system importance which can help increase the users’ acceptance level. Nevertheless, it was not possible to measure the improvement percentage of the
users’ acceptance level since the case presented was fictitious.
In addition, the model created by following this dissertation approach could accelerate and standardize the deployment process considering it would enable the users to clearly understand the impact that the indicators used had in their business goals. In order to have a clear impact in the deployment help it would be necessary to implement this approach in every report of the organization that could have a relevant impact on the business goals. Regrettably, this was not possible to measure and do.
This approach can have a clear added value for organizations that intend to create a personalized BI system that covers all controllers’ requirements. However, to implement this approach for all the needed reports of an organization it could be time costing and for organizations that want to create a BI system in the cheaper and faster surly it will not be a helpful approach to follow.
28
6.
Conclusion
This dissertation established an approach that enables to create a visually demonstration of the relationship between the business goals and the indicators that should be selected and used when creating a report.
The methodological process presented compares different perspectives, intuitive and systematic, and verifies if these perspectives are reflected in the current BI system deployed in an organization. The final selection of the indicators to use in a report combines all these analysis and enables a visual representation of the result.
As previously meantioned this methodology should be implemented for organizations that already deployed the reporting system as BI. It is important to recognise that in the first stage of the BI system deployment the users might not understand the tool impact in their business goals. Therefore, we recomment to apply the methodology presented in this work in the early stage of the BI deployment. In these sence, if new indicators are found important they can possibly be created quickly and also the users and controllers might accept and better use the BI system. Nevertheless, this approach could be used in every stage of the BI system deployment and even after the deployment finalise the approach would always be able to help selecting and representing the indicators to use in a report having in consideration the business goals of the organization.
The methodological process product allows to facilitate the understanding of which indicators should be used in the BI system to analysis the business goals regarding the reporting needs. Therefore, it could lead to improvements at the level of tool use, of tool acceptance and may be even users’ tool satisfaction. Also, the methodology presented could help the BI deployment phase to be quicker since users would be able to visualise through the representations the evaluation that the indicators could evoke in their business goals.
Ultimately, if an organization wants users to start using the BI tool properly they could define for each corporate report what should be the indicators and goals needed to create the report by following the methodological process in this dissertation.
However, it is important to recognise that the approach was not yet implemented in a real case scenario making it impossible to objectively measure these possible improvements.
29
7.
Limitations and Recommendations for Future Work
In the future, it is indispensable to make an impact analysis of the methodological process to verify if it can in fact have a positive effect in the project deployment and ultimately in organization operational costs.
Also it would be crucial to better evaluate the approach to implement it on a real case situation and verify if the objectives and issues that we estimated that would be impacted had in fact been impacted positively.
It would also be desirable, for the future, to find a way not only to quantify the models dissimilarities through a percentage of indicators affect in the goals evaluating, as we did in this dissertation, but to create a less subjective evaluation method that could calculate the impact of the dissimilarities regarding its importance on the report and on sub-goals that might be affected.
Furthermore, in the case study we noticed that the approach implementation could be time and man power consuming. Therefore, it could be pertinent to develop a simplified version of the approach that could consist in starting with the systematic approach and verifying if the result would be sufficient for the controllers to select the indicators for an organization report.
30
8.
References
Barone, D., Yu, E., et al., 2010. Enterprise Modeling for Business Intelligence. In The Practice of Enterprise Modeling, 3rd IFIP WG8.1 (PoEM’10). pp. 31–45. Available at:
http://www.moodle.uqam.ca/coursv2/file.php/2041/Articles/Barone_etal_2010-Enterprise_Modeling_for_BI.pdf.
Barone, D., Mylopoulos, J., et al., 2010. The Business Intelligence Model: Strategic Modelling.
Computer, pp.1–54. Available at: http://ftp.cs.toronto.edu/pub/reports/csri/607/BIM- TechReport.pdf\nftp://www.learning.cs.toronto.edu/public_html/public_html/csri-technical-reports/607/BIM-TechReport.pdf.
Boisot, M. & Canals, A., 2004. Data, information and knowledge: Have we got it right? Journal of Evolutionary Economics, 14(1), pp.43–67.
Borgida, A. et al., 2012. Experiences in mapping the business intelligence model to description logics, and the case for parametric concepts. 25th International Workshop on Description Logics, DL 2012, 846, pp.92–102. Available at: http://www.scopus.com/inward/record.url?eid=2-s2.0-84872927162&partnerID=40&md5=bbdee1839c68dffc4619ee5fc3d47f6c.
Burnay, C., Jureta, I.J. & Faulkner, S., Modelling Reporting Intentions to Justify Business Intelligence Indicators. , (ii).
Cheng, H., 2009. An Integration Framework of ERP, SCM, CRM. In 2009 International Conference on
Management and Service Science. pp. 1–4. Available at:
http://ieeexplore.ieee.org/xpl/freeabs_all.jsp?arnumber=5301692.
Dardenne, A., van Lamsweerde, A. & Fickas, S., 1993. Goal-directed requirements acquisition. Science of Computer Programming, 3(50), pp.3–30.
Fülöp, J., 2001. Introduction to Decision Making Methods. Operations Research, pp.1–15.
Horkoff, J. et al., 2014. Strategic business modeling: representation and reasoning. Software &
Systems Modeling, 13(3), pp.1015–1041. Available at:
http://link.springer.com/article/10.1007/s10270-012-0290-8.
Horkoff, J., Borgida, A. & Mylopoulos, J., 2012. Making data meaningful: The business intelligence model and its formal semantics in description logics. On the Move to Meaningful Internet Systems: OTM 2012. Lecture Notes in Computer Science, 7566(On the Move to Meaningful
Internet Systems: OTM 2012), pp.700–717. Available at:
http://link.springer.com/chapter/10.1007/978-3-642-33615-7_17.
Jandoš, J., 2012. On Business Intelligence SaaS solution. Systémová Integrace, pp.32–41. Available at: http://www.cssi.cz/cssi/system/files/all/SI_2012_02_03_Jandos.pdf.
Kaplan, R.S. & Norton, D.P., 2004. Strategy Maps: Converting Intangible Assets into Tangible Outcomes. Academy of Management Executive, 18(2), pp.163–165.
31 Moen, R. & Norman, C., 2006. Evolution of the PDCA Cycle. Society, pp.1–11.
Nurcan, S. et al., 2010. Intentional perspectives on information systems engineering. Intentional Perspectives on Information Systems Engineering, (June), pp.1–384.
OMG, 2009. Business Process Modeling Notation (BPMN), Version 1.2, Available at: http://www.omg.org/spec/BPMN/1.2.
Richard Dealtry, T., 1994. Dynamic SWOT analysis: developer’s guide. Birmingham, Dynamic SWOT Associates., 1, p.101.
Williams, S. & Williams, N., 2007. The Profit Impact of Business Intelligence, Available at: http://www.sciencedirect.com/science/article/pii/B9780123724991500053.
Yu, E.S.K., 1997. Towards modelling and reasoning support for early-phase requirements engineering. In Proceedings of ISRE ’97: 3rd IEEE International Symposium on Requirements Engineering. pp. 226–235.
Richard Dealtry, T., 1994. Dynamic SWOT Analysis- the Developer's Guide. Dynamic SWOT Associates.
32
9.
Appendix
33