Population genetic structure of the major malaria vector Anopheles
darlingi (Diptera: Culicidae) from the Brazilian Amazon, using
microsatellite markers
Vera Margarete Scarpassa/
+, Jan E Conn*
Coordenação de Pesquisas em Entomologia, Instituto Nacional de Pesquisas da Amazônia, Av. André Araújo 2936, 69011-970 Manaus, AM, Brasil *Griffin Laboratory, Wadsworth Center, New York State Department of Health, Slingerlands, NY, US The population genetic structure of Anopheles darlingi, the major human malaria vector in the Neotropics, was examined using seven microsatellite loci from nine localities in central and western Amazonian Brazil. High levels of genetic variability were detected (5-25 alleles per locus; HE = 0.519-0.949). There was deviation from Hardy-Weinberg Equilibrium for 59.79% of the tests due to heterozygote deficits, while the analysis of linkage disequilibrium was significant for only two of 189 (1.05%) tests, most likely caused by null alleles. Genetic differentiation (FST = 0.001-0.095; Nm = 4.7-363.8) indicates that gene flow is extensive among loca-tions ≤ 152 km apart (with two exceptions) and reduced, but not absent, at a larger geographic scale. Genetic and geographic distances were significantly correlated (R2 = 0.893, P < 0.0002), supporting the isolation by distance (IBD) model. The overall estimate of Newas 202.4 individuals under the linkage disequilibrium model, and ∞ under the heterozygote excess model. Analysis of molecular variance showed that nearly all variation (~ 94%) was within sample locations. The UPGMA phenogram clustered the samples geographically, with one branch including 5/6 of the state of Amazonas localities and the other branch the Acre, Rondônia, and remain-ing Amazonas localities. Taken together, these data suggest little genetic structure for An. darlingi from central and western Amazonian Brazil. These findings also imply that the IBD model explains nearly all of the differen-tiation detected. In practical terms, populations of An. darlingi at distances ≤ 152 km should respond similarly to vector control measures, because of high gene flow.
Key words: Anopheles darlingi - malaria vector - microsatellites - population genetics - Brazil
In Brazil after 1970, malaria was restricted to the Amazon Region, where currently more than 99% of all malaria cases are reported. In the 1980s in the Amazon, there was a progressive increase in malaria cases, as a result of extensive migration of human populations, de-forestation, highway construction, uncoordinated settle-ments, hydroelectric dams, pipelines, and gold-mining camps. These factors affected the distribution and den-sity of the major malaria vector Anopheles darlingi re-sulting in an increased burden of malaria in Amazonian Brazil (Charlwood 1996, Tadei et al. 1998, Gil et al. 2003). In 1999 more than 637,000 cases of malaria were reported, followed by a reduction for the three next years, presumably due to the intensification of malaria control programs (Funasa 2002); however, in last few years the malaria indices are on the rise again. Of the nine states that constitute the Amazon Region, Amazonas, Pará, and Rondônia showed the highest malaria incidence (together
they represent 76% of all cases recorded) with infec-tion rates of 78.6% for Plasmodium vivax and 21.40% for P. falciparum (Funasa 2002, WHO 2005).
In the state of Amazonas in particular, the spread of the areas of malaria transmission, including historically low prevalence areas, has been documented. For example, in 2003, in Manaus, the state capital, an increase of ~ 250% of malaria cases was reported compared with 2002, a historically high index. This index has been at-tributed to especially high temperature and humidity in the tropical forest, which offers favorable conditions for breeding and longevity of vector mosquitoes; environ-mental variation such as changes in rainy and dry sea-sons; social factors, population movement to the periph-ery of Manaus followed by deforestation; and uncoordi-nated settlements and precarious dwellings, providing contact between humans and vectors (Tadei et al. 1998, MS 2003, Susam/Devis 2004, WHO 2005).
An. darlingi is the major malaria vector in Brazil (Rachou 1958) and the most anthropophilic and efficient malaria vector in the Brazilian Amazon (Deane et al. 1948, Tadei et al. 1998, Gil et al. 2003). It is also a sig-nificant vector in other countries of its distribution such as Colombia, Peru, and Suriname (Rozendaal 1990, Olano et al. 2001, Vittor et al. 2006).
Because of its importance as a human malaria vec-tor, geographic populations of An. darlingi have been the subject of several studies. Polytene chromosome analysis revealed high polymorphism in An. darlingi, with fixed inversions between samples from Southeast-Financial support:Ministério da Ciência e Tecnologia/Inpa,
Bra-zil,National Institutes of Health (AI 40116 and AI R0154139 to JEC). This research was part of a Post-Doctoral fellowship of the first author undertaken at Conn’s Lab in the Wadsworth Cen-ter, Albany, NY, US.
+ Corresponding author:vera@inpa.gov.br
ern and Northern Brazil, and a high frequency of het-erozygote inversions detected in Northern Brazil (Kreutzer et al. 1972, Tadei et al. 1982). Subsequently, other population studies of An. darlingi have revealed high levels of genetic variability and low to moderate heterogeneity with a wide array of markers (Steiner et al. 1982, Rosa-Freitas et al. 1992, Freitas-Sibajev et al. 1995, Santos et al. 1999, Malafronte et al. 1999, Mira-bello & Conn 2006, González et al. 2007). However, a study conducted near the city of Iquitos, Peru, detected high homogeneity in nine populations, using random amplified polymorphic DNA-polymerase chain reaction (RAPD-PCR) (Pinedo-Cancino et al. 2006). Much of the variability detected in An. darlingi could be related to an adaptive strategy to exploit distinctive ecological niches within its extensive range (Kreutzer et al. 1972, Tadei et al. 1982, 1998) while the population structure and differentiation may be explained by differences in the effective population size, patterns of gene flow and historical and recent colonization events across its range. The vast geographic distribution of An. darlingi from Southern Mexico to Northern Argentina (Linthicum 1988), as well as significant differences between popu-lations documented by polytene chromosome (Kreutzer et al. 1972), isozyme (Steiner et al. 1982) and behav-ioral (revision in Rosa-Freitas et al. 1992) studies have led to the hypothesis of a species complex (Charlwood 1996). This hypothesis was rejected by Manguin et al. (1999) based on results of a multi-marker study (mor-phology, isozymes, ITS2-internal transcribed spacer two, and RAPD) that included samples from much of its range. Recently, a study based on mitochondrial DNA COI se-quences detected a significant genetic division between Central America plus NW Colombia, and the rest of South America (Mirabello & Conn 2006) and microsatellite data also detected significant differentiation across the eastern Amazonian region (Conn et al. 2006).
The aims of the present study were to estimate ge-netic variability and population structure and to infer the extent of gene flow among nine populations of An. darlingi from central and western Brazilian Amazon, using seven dinucleotide microsatellite loci.
MATERIALS AND METHODS
Mosquito collection -The specimens of An. darlingi were collected in Amazonian Brazil from March 1998 to August 2002. The samples were from the municipal-ity of Acrelândia (MAC), state of Acre; Porto Velho cmunicipal-ity (PVE), and municipality of São Miguel (SMI), both in the state of Rondônia; and Coari (COA), Novo Airão (NAI), Castanho (CAS), Puraquequara (PUR), Ramal do Brasileirinho (RBR), and Bancrévea (BAN), all in the state of Amazonas (Table I, Fig. 1). The latter three lo-calities are situated on the periphery of Manaus, sepa-rated by about 10 to 19 km. PUR and RBR are east of Manaus and nearest to it; BAN, to the north, is slightly farther away. The two localities, PVE and SMI from Rondônia are separated by about 16 km, and they are on opposite sides of the Madeira River. The female mos-quitoes were captured using human landing catches and
resting on cattle corrals or on vegetation near human dwellings from 18:30 to 21:00 h. The standard human landing catch protocol in use in the Brazilian localities during the collection period (1998-2002) was reviewed and approved by the Institutional Review Board of the University of Vermont, US. After capture, the mosqui-toes were transported to the Instituto Nacional de Pes-quisas da Amazônia (Inpa), in Manaus, identified using the taxonomic key of Faran and Linthicum (1981), and imme-diately preserved in ethanol 95% or stored at –80ºC, until analysis. For COA, both wild-caught females and offspring (F1) were used. All localities are in endemic malaria areas.
Microsatellite analysis - DNA was extracted from individual whole mosquitoes as described in Sambrook and Russel (2001). Eight microsatellite loci designed according to Conn et al. (2001) were used in the analy-ses and are as follow: ADC01, ADC02, ADC28, ADC107, ADC110, ADC137, ADC138, and ADC29. The same sample size was used for the eight loci; the ADC107 lo-cus, however, failed to amplify many individuals in all the samples after two attempts, even though these indi-viduals were amplified for the remaining loci. Also, in the few individuals that did yield a PCR product, an ex-cessive number of genotypes homozygous for different alleles were observed during the genotyping. Therefore, the ADC107 locus was excluded from the analyses.
The PCR reactions were prepared containing 10 pmols of each primer, 1/100th of the genomic DNA, puRe TaqTM Ready TO GOTM PCR Beads, and distilled
water to complete the final volume of 12 µl. The for-ward primer of each primer pair was labelled with a fluo-rescent dye (6FAM, HEX or TET, Applied Biosystems, Foster City, CA). DNA amplifications were carried out on a PTC-200 thermal cycler (MJ Research, Waltham, MA) as described in Conn et al. (2001). PCR products were then checked by electrophoresis in 1.5% agarose gels. The reactions for automated sequencing were car-ried out as follows: each PCR reaction (1.5 µl aliquot) was prepared using standard protocols (Applied Biosystems) and analyzed on an ABI Prism 377 DNA Sequencer (Applied Biosystems). Gels were analyzed, and project and sample files were generated using ABI GENESCAN software, version 3.1 (Applied Biosystems). Subsequently, allele sizes were scored and compared with internal size standards using GENOTYPER software, version 2.6 (Applied Biosystems).
Statistical analyses - The analyses were performed
calcu-lated using ARLEQUIN software. The FST (Weir & Cockerham 1984) assumes the infinite alleles model (IAM) and was calculated based on the absolute frequen-cies of alleles. The significance of FST was determined by permuting genotypes between localities (10,100 per-mutations). We used the FST statistic only (not RST) be-cause FST is considered more reliable when fewer than 20 microsatellite loci are analyzed (Gaggiotti et al. 1999). The number of migrants per population per gen-eration (Nm = migration indices) between localities was estimated from pairwise FSTvalues. IBD was estimated using the correlation between genetic and geographic distances by the regression of FST/1-FST on the natural logarithm (In) of straight-line geographical distance. The
significance level was tested using 10,000 permutations. Effective population size (Ne) was calculated using NeEstimator software, version 1.3 (Peel et al. 2004), based on the linkage disequilibrium (LD) and heterozy-gote excess (HE) models. These estimates were calcu-lated from the deviation of expected compared to ob-served degree of linkage disequilibrium and from the excess of heterozygotes in the sample compared to the proportion predicted under HWE. The genetic relation-ships between the populations were also assessed by a UPGMA phenogram using PAUP* software, version 4.0 (Swofford 2003). When multiple tests were performed, the nominal significance level (P < 0.05) was adjusted using the sequential Bonferroni procedure (Holm 1979). TABLE I
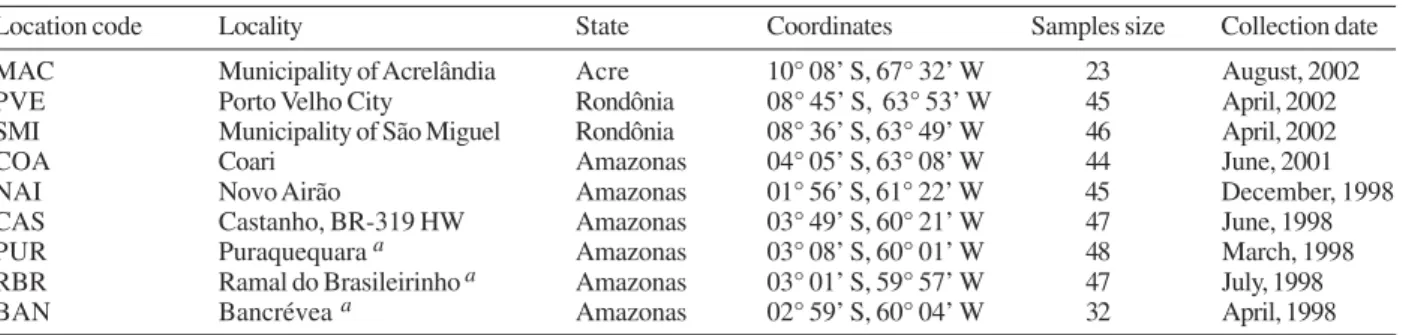
Localities sampled for Anopheles darlingi from central and western Amazonian Brazil
Location code Locality State Coordinates Samples size Collection date
MAC Municipality of Acrelândia Acre 10° 08’ S, 67° 32’ W 23 August, 2002
PVE Porto Velho City Rondônia 08° 45’ S, 63° 53’ W 45 April, 2002
SMI Municipality of São Miguel Rondônia 08° 36’ S, 63° 49’ W 46 April, 2002
COA Coari Amazonas 04° 05’ S, 63° 08’ W 44 June, 2001
NAI Novo Airão Amazonas 01° 56’ S, 61° 22’ W 45 December, 1998
CAS Castanho, BR-319 HW Amazonas 03° 49’ S, 60° 21’ W 47 June, 1998
PUR Puraquequara a Amazonas 03° 08’ S, 60° 01’ W 48 March, 1998
RBR Ramal do Brasileirinho a Amazonas 03° 01’ S, 59° 57’ W 47 July, 1998
BAN Bancrévea a Amazonas 02° 59’ S, 60° 04’ W 32 April, 1998
a : three localities on periphery of Manaus; HW: Highway
RESULTS
A total of 377 individuals was analyzed (Table I). All loci revealed high levels of polymorphism, with a total of 105 alleles, and there were 5 to 25 alleles per locus in the nine populations (Table II). The ADC01 locus ex-hibited the largest allele number (from 18-25), whereas the ADC28 locus had the fewest (from 5-11). All west-ern samples, from MAC, PVE, and SMI (states of Acre
and Rondônia) had the highest allele number and mean expected heterozygosity levels (HE = 0.855; 0.800; 0.781, respectively) compared with the samples from state of Amazonas.
No locus was in HWE for all the samples assayed (Table II). Thirty-two of the 63 (50.79%) comparisons exhibited significant departures from HWE after sequen-tial Bonferroni correction (P < 0.05), due to
heterozy-TABLE II
Estimates of genetic variability of Anopheles darlingi from central and western Amazonian Brazil
MAC PVE SMI COA NAI CAS PUR RBR BAN
Locus 2N = 46 2N = 90 2N = 92 2N = 88 2N = 90 2N = 94 2N = 96 2n = 94 2N = 64
ADC01
No. alleles 20 24 25 18 23 21 21 20 21
HO 0.783 0.800 0.844 0.795 0.841 0.822 0.896 0.739 0.781
HE 0.949 0.947 0.938 0.894 0.919 0.934 0.924 0.897 0.920
r – 0.08 – – – – – 0.09 0.08
FIS 0.175 0.155 0.100 0.111 0.085 0.120 0.030 0.180 0.150
ADC02
No. alleles 11 12 14 9 8 8 8 7 9
HO 0.348 0.600 0.556 0.465 0.378 0.415 0.271 0.213 0.188
HE 0.773 0.752 0.799 0.771 0.771 0.686 0.756 0.733 0.816
r 0.38 – 0.18 0.25 0.34 0.25 0.47 0.55 0.62
FIS 0.550 0.202 0.304 0.397 0.510 0.395 0.642 0.709 0.770
ADC28
No. alleles 11 10 6 7 8 6 6 5 6
HO 0.652 0.750 0.601 0.682 0.467 0.340 0.435 0.149 0.375
HE 0.866 0.789 0.678 0.661 0.586 0.668 0.546 0.519 0.528
r 0.14 – – – - 0.32 0.11 0.55 0.17
FIS 0.247 0.049 0.114 -0.032 0.203 0.491 0.203 0.713 0.290
ADC110
No. alleles 12 12 10 9 8 8 9 7 6
HO 0.773 0.933 0.733 0.614 0.622 0.681 0.808 0.696 0.719
HE 0.902 0.854 0.838 0.850 0.737 0.815 0.809 0.812 0.822
r – – – 0.16 – – – – –
FIS 0.143 -0.092 0.125 0.278 0.156 0.164 0.001 0.143 0.125
ADC137
No. alleles 13 12 13 10 9 10 11 11 9
HO 0.869 0.711 0.783 0.659 0.644 0.787 0.659 0.723 0.750
HE 0.889 0.884 0.848 0.865 0.818 0.846 0.864 0.885 0.852
r – – – 0.13 – – 0.13 – –
FIS 0.022 0.196 0.077 0.238 0.213 0.070 0.237 0.183 0.120
ADC138
No. alleles 8 12 11 8 7 9 7 9 6
HO 0.522 0.450 0.585 0.545 0.467 0.444 0.489 0.511 0.438
HE 0.853 0.895 0.881 0.782 0.680 0.708 0.694 0.723 0.768
r 0.24 0.33 0.20 0.18 – 0.23 0.17 – 0.27
FIS 0.388 0.497 0.336 0.303 0.313 0.373 0.295 0.293 0.430
ADC29
No. alleles 12 18 14 9 9 11 8 10 9
HO 0.652 0.488 0.341 0.512 0.386 0.488 0.349 0.500 0.548
HE 0.875 0.809 0.883 0.711 0.700 0.757 0.558 0.719 0.738
r – 0.25 0.44 – 0.29 0.22 0.23 0.18 –
FIS 0.255 0.397 0.614 0.280 0.448 0.355 0.374 0.304 0.257
Mean HE 0.855 0.800 0.781 0.776 0.729 0.705 0.692 0.729 0.761
(± SE) (0.46) (0.42) (0.42) (0.41) (0.39) (0.38) (0.37) (0.39) (0.41)
gote deficiencies, and the inbreeding coefficient (FIS) was positive in most cases. The ADC110 locus showed a significant departure from HWE for only one sample, whereas the ADC02 and ADC138 loci deviated from HWE for eight and seven samples, respectively. The PUR sample exhibited the highest number of loci deviating from HWE, which could be related to its lower gene di-versity (0.692). In all samples, each locus failed to am-plify for at least one specimen after two attempts, while the same specimen yielded PCR products for the remain-ing loci, strongly suggestremain-ing the presence of null alle-les. Estimates of the frequency of null alleles are given in Table II. The ADC02 locus, for example, showed a high frequency of both null alleles and FIS values, primarily in the three samples from Manaus and in the NAI samples. The ADC28 locus in the RBR sample and the ADC29 locus in the SMI sample also showed high val-ues (Table II).
Analysis of linkage disequilibrium was carried out to confirm whether the deviations from HWE within-samples were due to Wahlund effect, inbreeding, selec-tion or null alleles. Only two of 189 (1.05%) of exact tests were significant for linkage disequilibrium (P < 0.05), after sequential Bonferroni correction. The sig-nificant values were between the loci ADC29/ADC138 in the SMI sample and between the loci ADC110/ADC02 in the COA sample.
Significant genetic differentiation was observed for the most of the comparisons between localities (P < 0.001), after the sequential Bonferroni correction (Table III). The average FST value over all loci was 0.044, with a large range (0.001 to 0.095). As expected if the IBD model is supported, the FST values were not significant for those population pairs separated by the smallest geo-graphic distances (i.e., 10-152 km). The exceptions are CAS-PUR and CAS-RBR where the geographic distances are 119 and 134 km, respectively, but they are signifi-cantly differentiated (FST = 0.020; 0.024; P < 0.001). The highest genetic differentiation (FST = 0.067-0.095) was found among samples from MAC and state of Amazonas that were farthest apart geographically, with corresponding Nm values of 4.7 to 6.9. This result indi-cates reduced gene flow among them. Within state of
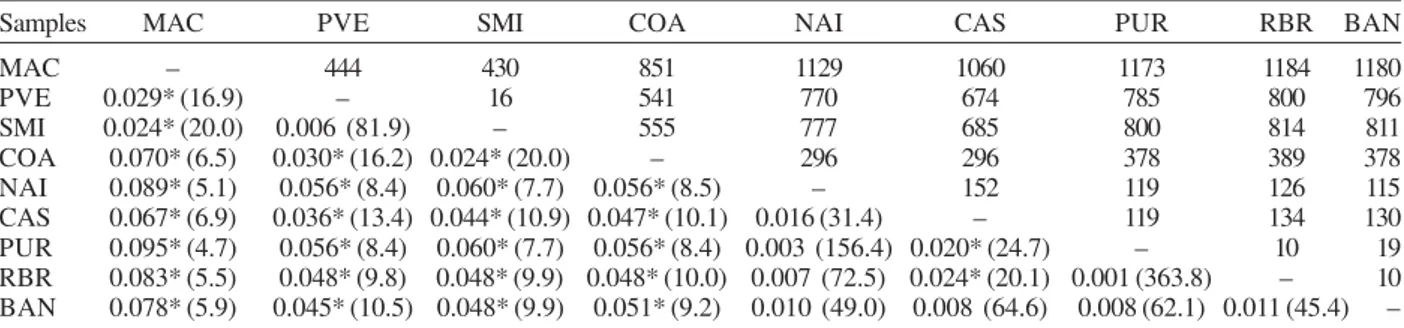
TABLE III
Pairwise genetic distance (FST ) for samples of Anopheles darlingi from central and western Amazonian Brazil
Samples MAC PVE SMI COA NAI CAS PUR RBR BAN
MAC – 444 430 851 1129 1060 1173 1184 1180
PVE 0.029* (16.9) – 16 541 770 674 785 800 796
SMI 0.024* (20.0) 0.006 (81.9) – 555 777 685 800 814 811
COA 0.070* (6.5) 0.030* (16.2) 0.024* (20.0) – 296 296 378 389 378
NAI 0.089* (5.1) 0.056* (8.4) 0.060* (7.7) 0.056* (8.5) – 152 119 126 115
CAS 0.067* (6.9) 0.036* (13.4) 0.044* (10.9) 0.047* (10.1) 0.016 (31.4) – 119 134 130 PUR 0.095* (4.7) 0.056* (8.4) 0.060* (7.7) 0.056* (8.4) 0.003 (156.4) 0.020* (24.7) – 10 19 RBR 0.083* (5.5) 0.048* (9.8) 0.048* (9.9) 0.048* (10.0) 0.007 (72.5) 0.024* (20.1) 0.001 (363.8) – 10 BAN 0.078* (5.9) 0.045* (10.5) 0.048* (9.9) 0.051* (9.2) 0.010 (49.0) 0.008 (64.6) 0.008 (62.1) 0.011 (45.4) –
Approximate geographical distances in km are above diagonal; FST values are below diagonal. * : P < 0.001, after sequential Bonferroni correction. Nm values are in parentheses. Abbreviations of localities are in Table I.
TABLE IV
Effective population size (Ne) in Anopheles darlingi, based on linkage disequilibrium (LD) and heterozygote excess (HE)
models
Localities LD 95% CI HE 95% CI
MAC 191.1 81.3-∞ ∞ NA
PVE ∞ 505.7-∞ ∞ NA
SMI 238.3 126.0-1383.1 ∞ NA
COA 83.0 57.5-139.2 ∞ NA
NAI 152.0 87.7-456.8 ∞ NA
CAS 501.2 149.5-∞ ∞ NA
PUR 178.2 94.1-932.1 ∞ NA
RBR 469.6 145.2-∞ ∞ NA
BAN 155.8 74.0-314153.3 ∞ NA
All localities 202.4 186.1-220.8 ∞ NA
CI: confidence interval; ∞: infinity; NA: not applicable. Abbrevi-ations of localities are in Table I.
Amazonas, COA was the most diverged (FST = 0.047-0.056; Nm = 8.4-10.1), however between COA and PVE/ SMI (state of Rondônia), separated by greater geographic distances, the FST values were lower (FST = 0.030, 0.024; Nm = 16.2, 20.0; respectively).
In an AMOVA, the placement of COA (either grouped with the other samples from Amazonas or with the samples from Acre and Rondônia) made no significant difference (data not shown). Most of the total variance was explained at the within population level (94-95%; P < 0.001). Only 3-4% of the variance was attributable to between groups (P < 0.05), and about 2% was attribut-able to among populations within groups (P < 0.001). The Mantel test showed a significant positive correla-tion between geographic distances and FST values (R2 = 0.893; P < 0.0002), indicating that most genetic differ-entiation can be explained by the IBD model.
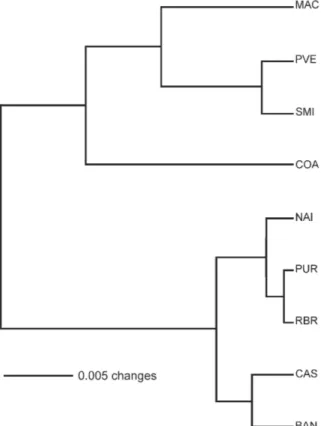
The clusters in the UPGMA phenogram (Fig. 2) were much as expected, based on the IBD model, with COA (the most western of the Amazonas state localities) grouped with samples from Acre and Rondônia, and the five remaining samples from Amazonas state (more cen-tral) grouped together.
DISCUSSION
The microsatellite loci used in this study have not been physically mapped to the polytene chromosomes of An. darlingi, and therefore their location relative to inversions is unknown. If any are linked to chromosomal inversions, this may alter the interpretation of the data since neutrality cannot be assumed.
Microsatellite loci analyzed in An. darlingi from central and western Brazilian Amazon were highly poly-morphic and found to be at least six-fold more variable than isozymes (Rosa-Freitas et al. 1992, Manguin et al. 1999, Santos et al. 1999). Compared with others microsatellite studies, the HE values (0.519-0.949) re-ported here are in the same range as those found for An. darlingi from eastern Brazilian Amazon (Conn et al. 2006) and for other major malaria vectors, such as An. gambiae s. s. in Africa (Lehmann et al. 1997) and An. albimanus in Latin America (Molina-Cruz et al. 2004). In this study, significant deviations for HWE were due to heterozygote deficits. These could be the result of the Wahlund effect (population subdivision),
inbreed-Fig. 2: unweighted pair group method (UPGMA) between samples of
Anopheles darlingi, based on the pairwise FST values. Abbreviations of localities are in Table I.
ing, selection or null alleles. Linkage disequilibrium was absent in 98.95% of the exact tests; therefore, it is highly unlikely that the Wahlund effect or inbreeding, which affect the entire genome, could be the cause. Earlier stud-ies of An. darlingi from central Amazonian Brazil using polytene chromosomes (Kreutzer et al. 1972, Tadei et al. 1982) and isozymes (Rosa-Freitas et al. 1992, Man-guin et al. 1999) detected no suggested intra-popula-tional differentiation making the Wahlund effect an un-likely explanation. Taken together, these observations strongly suggest the presence of null alleles in An. darlingi of this study, as have been observed in An. darlingi from eastern Brazilian Amazon (Conn et al. 2006), and in other microsatellite studies (Lehmann et al. 1997, Kamau et al. 1999).
Previous studies employing mtDNA (Freitas-Sibajev et al. 1995) and isozymes (Santos et al. 1999) reported higher divergences for An. darlingi from Manaus com-pared with other samples. Freitas-Sibajev et al. (1995) described small sequence divergence values among all samples analyzed, except for comparisons involving Manaus, where these values were within the lower range of interspecific genetic distances, as observed for mem-bers of the An. quadrimaculatus complex (discussed in Freitas-Sibajev et al. 1995). For isozymes analyses, al-though genetic homogeneity was found among the samples (D = 0.011-0.024), those from Manaus were the most diverged (Santos et al. 1999). In the present study, the higher levels of heterozygote deficits detected in the samples up to 134 km from Manaus (NAI and CAS) and on the periphery of Manaus (especially, PUR and RBR) could be the result of a reduction of infor-mativeness of these primers possibly due to a greater accumulation of different mutations in their flanking regions, that probably prevented PCR amplifications, resulting in a higher frequency of null alleles, and con-sequently higher levels of heterozygote deficits. We think the main reason for the presence of null alleles could be that the whole microsatellite library was con-structed only of An. darlingi from Capanema (eastern Amazonian Brazil, Conn et al. 2001).
At the macrogeographic level, from 296 to 1184 km, the data showed significant genetic differentiation in An. darlingi, primarily between samples with greater dis-tances, for example between MAC and the samples from Amazonas state. According to Slatkin (1987) genetic differentiation will be substantial if Nm < 1 but not if Nm > 1. Our results for these comparisons showed Nm values > 1 (4.7 to 6.9), suggesting that gene flow is re-stricted but not absent, and probably prevented any diag-nostic differences between them.
The AMOVA analysis indicated low variance between groups (~ 3%) and among populations within groups (~ 2%), consistent with IBD and comparable to results from An. gambiae s. s. (Kamau et al. 1999). Conn et al. (2006)’s data showed higher genetic differentiation, based on the FST (highest values = 0.1464-0.1841) and hierarchic analysis (between groups = ~ 12%), indicat-ing that populations of An. darlingi from eastern Bra-zilian Amazon are more genetically structured than An. darlingi in the present study.
Likewise, the average Ne (202.4 individuals) in the present study was two-fold higher than that observed for An. darlingi from eastern Amazonian Brazil (Ne = 92.4, Conn et al. 2006) and for the other Neotropical malaria vector An. albimanus (Ne = 96, Molina-Cruz et al. 2004). Considering each population separately in the present study, all Ne values were high under the LD model, except for COA. It is also possible that the large range of Nevalues for all populations under LD (83 - ∞) could have contributed to the genetic differentiation such that the FST estimates at the greatest geographic distances were statistically significant, despite obvious gene flow (Donnelly et al. 2002).
In the sample from PVE, the Ne was ∞ under both models, which suggests a very high density of An. darlingi locally. In the state of Amazonas, primarily in Manaus, the use of insecticidal fogging has intensified during the past ten years due to high malaria transmis-sion indices; nevertheless, the Ne values for these popu-lations (PUR, RBR, BAN; Ne = 155.8-469.6) show that despite frequent application of insecticides, large popu-lations of An. darlingi are being maintained. This im-plies that insufficient levels of insecticide are currently being used (notwithstanding the highly complex environ-mental and social factors in this region). Another expla-nation could be that exclusively local interventions may result in the influx of mosquitoes from untreated neigh-borhood areas, resulting in operational failures and large population size again a short time after fogging. Also, the increase of An. darlingi population size could be due to other factors, such as the availability of breeding sites and city expansion in the form of uncoordinated settlements near forests. In addition, compared with 50 yr. ago (Deane et al. 1948) some populations of An. darlingi have changed their behavior, now being more exophilic and exophagic and/or leaving dwellings imme-diately after feeding (Tadei 1987, Charlwood 1996, Gil et al. 2003), making the use of indoor insecticide and other individual protection measures less effective. This complex situation suggests that integrated and coordi-nated local or regional control must be considered. For
example, a concerted effort to identify suitable An. darlingi breeding sites, particularly in proposed new settlements and discouraging people from living nearby, could be useful because An. darlingi does not seem to fly far to seek human bloodmeals if other mammal hosts are available (Zimmerman et al. 2006). In areas where people are already settled near breeding sites, another possibility might be the use of an environmentally ac-ceptable insecticide, such as Bacillus sphaericus for aquatic stages (Rodrigues et al. 1998) combined with fogging for adults, focusing on the peak transmission time of the year. However, integrated malaria control also needs to take into account the proportion of asymptom-atic malaria persons (Coura et al. 2006) and resistance to anti-malarial drugs (Vieira et al. 2004) in a given area to have any hope of success.
The low Ne observed for An. darlingi from COA may have magnified differentiation between this and the other Amazonas populations by genetic drift, a fundamental parameter influencing genetic population structure. In-terestingly, this locality showed linkage disequilibrium between the ADC110/ADC02 loci; nevertheless, its ex-pected heterozygosity was high.
The large populations of An. darlingi reflected in the high Ne values may be contributing to an increase in gene flow among subpopulations, resulting in little ge-netic structure for An. darlingi from central and west-ern Brazilian Amazon, a result similar to that found with the use of multi-markers (Manguin et al. 1999, Santos et al. 1999) and also similar to results from Iquitos, Peru, with the use RAPD marker (Pinedo-Cancino et al. 2006). A recent study with three populations from Colombia showed also little evidence of geographic separation between eastern and western from mountains Andes, with the use RAPD and AFLP (Amplified Fragment Length Polymorphism) markers (González et al. 2007).
Otherwise, the differences in population structure across Amazonian Brazil detected by microsatellite data, i. e., less structure and differentiation in central and west-ern Brazilian Amazon compared with eastwest-ern Brazilian Amazon, are congruent with results using sequences of the nuclear white gene (L Mirabello & JE Conn, unpub-lished observations). This differentiation in An. darlingi probably has its origin in regional Amazonian biogeog-raphy, which is far from homogeneous. The samples of An. darlingi collected in the present study and those from Conn et al. (2006) are along different major Ama-zon river systems (Negro, Solimões, Madeira, and mouth of the Amazonas) which represent distinctive tectonic compartments, with distinctive geomorphological char-acteristics, believed to have influenced the evolutionary history of Amazonian organisms (Rossetti et al. 2005). These findings are of vital importance to region-wide control efforts currently underway among Amazonian countries to try to reduce malaria transmission.
ACKNOWLEDGMENTS
states of Acre, Amazonas, and Rondônia for providing logistic support to collect in all localities. To Drs Tomas Hrbek and Izeni Farias (Ufam, Manaus, AM, Brazil) for help with the statistical analysis. All of the DNA from the samples of An. darlingi was returned to Inpa, where it is being maintained at –80° C.
REFERENCES
Charlwood JD 1996. Biological variation in Anopheles darlingi
Root. Mem Inst Oswaldo Cruz 91: 391-398.
Conn JE, Bollback JP, Onyabe DY, Robinson TN, Wilkerson RC, Póvoa MM 2001. Isolation of polymorphism microsatellite markers from the malaria vector Anopheles darlingi. Mol Ecol Notes 1: 223-225.
Conn JE, Vineis JH, Bollback JP, Onyabe DY, Wilkerson RC, Póvoa MM 2006. Population structure of the malaria vector
Anopheles darlingi in an endemic region of eastern Ama-zonian Brazil. Am J Trop Med Hyg 74: 798-806.
Coura, JR, Suárez-Mutis M, Ladeia-Andrade S 2006. A new challenge for malaria control in Brazil: asymptomatic Plas-modium infection – A Review. Mem Inst Oswaldo Cruz 101: 229-237.
Deane LM, Causey OR, Deane MP 1948. Notas sobre a distribuição e a biologia dos Anofelinos das regiões Nordes-tina e Amazônica do Brasil. Rev Serv Esp Saúde Pública 4: 827-965.
Donnelly MJ, Simard F, Lehmann T 2002. Evolutionary studies of malaria vectors. Trends Parasitol 18: 75-80.
Excoffier L, Laval G, Schneider S 2006. An integrated software package for population genetics data analysis, version 3.01. Computational and Molecular Population Genetics Lab. In-stitute of Zoology, University of Berne, Switzerland.
Faran ME, Linthicum KJ 1981. A handbook of the Amazonian species of Anopheles (Nyssorhynchus) ( Diptera: Culicidae).
Mosq Syst13: 1-81.
Freitas-Sibajev MGR, Conn J, Mitchell SE, Cockburn AF, Seawright JA, Momen H 1995. Mitochondrial DNA and morphological analyses of Anopheles darlingi populations from Brazil (Diptera: Culicidae). Mosq Syst 27: 78-99. Funasa-Fundação Nacional de Saúde 2002. Vigilância
epi-demiológica. Plano de intensificação das ações de controle da malária na Amazônia Legal - PIACM, Ministério da Saú-de, Brasília, DF.
Gaggiotti OE, Lange O, Rassmann K, Gliddon C 1999. A compari-son of two indirect methods for estimating average levels of gene flow using microsatellite data. Mol Ecol 8: 1513-1520. Gil LH, Alves FP, Zieler H, Salcedo JM, Durlacher RR, Cunha
RP, Tada MS, Camargo LM, Camargo EP, Pereira-da-Silva LH 2003. Seasonal malaria transmission and variation of anopheline density in two distinct endemic areas in the Bra-zilian Amazon. J Med Entomol 40: 636-641.
González R, Wikerson R, Suárez MF, García F, Gallego G, Cárdenas H, Posso CE, Duque MC 2007. A population ge-netics study of Anopheles darlingi (Diptera: Culicidae) from Colombia based on random amplified polymorphic DNA-polymerase chain reaction and amplified fragment length poly-morphism markers. Mem Inst Oswaldo Cruz 102: in press. Holm S 1979. A simple sequential rejective multiple test
proce-dure. Scandinavian J Statistics 6: 65-70.
Kamau L, Mukabana WR, Hawley WA, Lehmann T, Irungu LW,
Orago ASS, Collins FH 1999. Analysis of genetic variability in Anopheles arabiensis and Anopheles gambiae using microsatellite loci. Insect Mol Biol 8: 287-297.
Kreutzer RD, Kitzmiller JB, Ferreira E 1972. Inversion poly-morphism in the salivary gland chromosomes of Anopheles darlingi Root. Mosq News 32: 555-565.
Lehmann T, Besansky NJ, Hawley WA, Fahey TG, Kamau L, Collins FH 1997. Microgeographic structure of Anopheles gambiae in western Kenya based on mtDNA and micro-satellite loci. Mol Ecol 6: 243-253.
Linthicum KJ 1988. A revision of the Argyritarsis Section of the subgenus Nyssorhynchus of Anopheles (Diptera: Culicidae).
Mosq Syst 20: 101-271.
Malafronte RS, Marrelli MT, Marinotti O 1999. Analysis of ITS2 DNA sequences from Brazilian Anopheles darlingi (Diptera: Culicidae). J Med Entomol 36: 631-634.
Manguin S, Wilkerson RC, Conn JE, Rubio-Palis Y, Danoff-Burg JA, Roberts, D 1999. Population structure of the primary malaria vector in South America, Anopheles darlingi, using isozyme, random amplified polymorphic DNA, internal tran-scribed spacer 2, and morphologic markers. Am J Trop Med Hyg 60: 364-376.
MS-Ministério da Saúde 2003. Secretaria de Vigilância em Saúde. Boletim Epidemiológico da Malária, Número 1, Brasília.
Mirabello L, Conn JE 2006. Molecular population genetics of the malaria vector Anopheles darlingi in Central and South America. Heredity 96: 311-321.
Molina-Cruz A, de Mérida AMP, Millis K, Rodriguez F, Schoua C, Yurrita MM, Molina E, Palmieri M, Black WC 2004. Gene flow among Anopheles albimanus populations in Central America, South America, and the Caribbean assessed by microsatellites and mitochondrial DNA. Am J Trop Med Hyg 71: 350-359.
Olano V, Brochero H, Sáenz R, Quinõnes M, Molina J 2001. Mapas preliminares de la distribución de espécies Anopheles vectores de malaria en Colômbia. Biomédica 21: 402-408.
Peel D, Ovenden J, Peel S 2004. NeEstimator: software for estimating effective population size: Queensland Government, Department of Primary Industries and Fisheries.
Pinedo-Cancino V, Sheen P, Tarazona-Santos E, Oswald WE, Jeri C, Vittor AY, Patz JA, Gilman RH 2006. Limited diver-sity of Anopheles darlingi in the Peruvian Amazon region of Iquitos. Am J Trop Med Hyg 75: 238-245.
Rachou RG 1958. Anofelinos do Brasil: comportamento das espécies vetoras de malária. Rev Brasil Malariol Doenças Trop 2: 145-181.
Rodrigues IB, Tadei WP, Dias JMCS 1998. Studies on the Bacil-lus sphaericus larvicidal activity against malarial vector spe-cies in Amazonia. Mem Inst Oswaldo Cruz 93: 441-444. Rosa-Freitas MG, Broomfield G, Priestman A, Milligan PJM, Momen
H, Molyneux DH 1992. Cuticular hydrocarbons, isoenzymes and behavior of three populations of Anopheles darlingi from Brazil. J Am Mosq Control Assoc 8: 357-366.
Rossetti DF, Mann de Toledo P, Góes AM 2005. New geological framework for Western Amazonia (Brazil) and implications for biogeography and evolution. Quat Res 63: 78-89. Rozendaal JA 1990. Observations on the distribution of
malaria vector Anopheles darlingi. Mem Inst Oswaldo Cruz 85: 221-234.
Sambrook J, Russel D 2001. Molecular Cloning: A Labora-tory Manual, Cold Spring Harbor Laboratory Press, Cold Spring Harbor, NY.
Santos JMM, Lobo JA, Tadei WP, Contel EPB 1999. In-trapopulational genetic differentiation in Anopheles (N.)
darlingi Root, 1926 (Diptera: Culicidae) in the Amazon Re-gion. Genet Mol Biol 22: 325-231.
Slatkin M 1987. Gene flow and the geographic structure of natu-ral populations. Science 236: 787-792.
Steiner WWM, Narang SK, Kitzmiller JB, Swofford DL 1982. Genetic divergence and evolution in neotropical Anopheles
(subgenus Nyssorhynchus). In WWM Steiner, Tabachnick WJ, Rai KS, Narang SK (eds), Recent Developments Ge-netics Insects Disease Vectors, Stipes, Champaign, IL, p. 523-551.
Susam/Devis-Secretaria de Saúde do Amazonas e Departamento de Vigilância em Saúde 2004. Relatório de atividades de controle de endemias, 2002 a 2004. Manaus, Amazonas.
Swofford DL 2003. PAUP*. Phylogenetic Analysis Using Par-simony (* and other methods). Version 4.0. Sinauer Associ-ates Inc., Sunderland, MA, US.
Tadei WP 1987. Biologia de anofelinos amazônicos. XI. Estudos em populações de Anopheles e controle da malária em Ariquemes (Rondônia). Acta Amazon 17: 151-167. Tadei WP, Santos JMM, Rabbani MG 1982. Biologia de
Anofelinos Amazônicos. V. Polimorfismo cromossômico de
Anopheles darlingi Root (Diptera: Culicidae). Acta Ama-zon 12: 353-369.
Tadei WP, Dutary-Thatcher B, Santos JMM, Scarpassa VM, Rodrigues IB, Rafael MS 1998. Ecologic observations on anopheline vectors of malaria in the Brazilian Amazon. Am J Trop Med Hyg 59: 325-335.
Vieira PP, Ferreira MU, Alecrim MG, Alecrim WD, Silva LHP, Sihuincha MM, Joy DA, Mu J, Su XZ, Zalis MG 2004. pfcrt Polymorphism and the spread of chloroquine resistance in
Plasmodium falciparum populations across the Amazon Basin. J Infect Dis 190: 417-424.
Vittor AY, Gilman RH, Tielsch J, Glass G, Shields T, Sanches Lozano W, Pinedo Cancino V, Patz JA 2006. The effect of deforestation on the human-biting rate of Anopheles darlingi, the primary vector of falciparum malaria in the Peruvian Amazon. Am J Trop Med Hyg 74: 3-11.
Weir BS, Cockerham CC 1984. Estimating F-statistics for the analysis of population structure. Evolution 38: 1358-1370. Wondji C, Simard F, Lehmann T, Fondjo E, Same-Ekobo A,
Fontenille D 2005. Impact of insecticide-treated bed nets implementation on the genetic structure of Anopheles arabiensis in an area of irrigated rice fields in the Sahelian region of Cameroon. Mol Ecol 14: 3683-93.
WHO-World Health Organization 2005. World Malaria Report 2005. Available in http://www.rbm.who.int/wmr2005. Ac-cessed in June 18, 2006.
Wright S 1965. The interpretation of population structure by F-statistic with special regard to systems of mating. Evolu-tion 19: 395-420.