Genetic structure of Brazilian wild rice (
Oryza glumaepatula
Steud., Poaceae)
populations analyzed using microsatellite markers
Marines M.G. Karasawa
1, Roland Vencovsky
1, Cynthia M. Silva
1, Maria Imaculada Zucchi
2,
Giancarlo C.X. Oliveira
1and Elizabeth A. Veasey
11
Departamento de Genética, Escola Superior de Agricultura “Luiz de Queiroz”,
Universidade de São Paulo, Piracicaba, SP, Brazil.
2
Instituto Agronômico de Campinas, Campinas, SP, Brazil.
Abstract
Knowledge of the genetic structure and diversity of natural populations is important in developing strategies forin situ andex situ conservation. We used eight microsatellite loci to estimate genetic structure and investigate within and between population genetic variation in eleven Brazilian wild rice (Oryza glumaepatula) populations. The study showed the following genetic diversity parameters: average number of 3.1 alleles per locus; 77.3% polymorphic loci; 0.091 observed heterozygosity and 0.393 gene diversity. F-statistics detected by microsatellite loci were:FST= 0.491 (andRST= 0.608),FIS= 0.780 andFIT= 0.888. No population was in Hardy-Weinberg equilibrium. The estimated ap-parent outcrossing rate (ta= 0.143) indicated a predominance of self-fertilization. The gene flow values were low
(Nm = 0.259 and 0.161 for FSTandRST, respectively). Populations were spatially structured but without a correlation
between genetic and geographic distances. Five populations (PG-4, PG-2, PU-1, SO-4, NE-18) were identified as priorities for conservation strategies. Populations from the Amazon biome showed heterogeneity with respect to intrapopulation diversity (He). The high level of genetic differentiation between populations and the high number of private alleles suggested that sampling should be carried out on a large number ofO. glumaepatula populations for ex situ conservation purposes.
Key words:conservation, gene flow, genetic diversity, microsatellites,Oryza glumaepatula.
Received: March 9, 2006; Accepted: October 3, 2006.
Introduction
There are 23 species in the rice genusOryza, one of which is the wild rice Oryza glumaepatula Steud. (Poaceae) which has an AA genome, of the same type as the cultivatedOryzasativa, and occurs widely in Latin Amer-ica from 23° N in Cuba to 23° S in Brazil (Vaughanet al., 2003). The Brazilian O. glumaepatula populations are found in the extensive river basins of the Amazon and Pantanal Matogrossense and the smaller river basins which occur in the states of Goiás and Tocantins (Oliveira, 1994; Brondaniet al., 2005).
Several studies have indicated thatO. glumaepatula
is a self-fertilizing species (Akimotoet al., 1998; Busoet al., 1998; Geet al., 1999). Such species are usually more homogeneous within populations but more differentiated between populations, forming pure lines within families and increasing the genetic differentiation between families
by generating subdivision within the population. The fixa-tion of specific alleles may confer little or no flexibility in response to environmental changes and, in extreme cases, these species may become completely extinct due to allele fixation and loss of genetic diversity (Richards, 1997; Hedrick, 2001). In favorable environments such species may exhibit aggressive behavior typical of weeds and colo-nizing plants and rapidly become established (Holsinger, 2000). These types of species need special attention from conservationists and the highest possible number of popu-lations should be identified to increase the chance of con-serving different alleles and thus preserve the diversity existing within the species with higher efficiency. To de-velop strategies forin situandex situgermplasm conserva-tion and plan future plant collecconserva-tions it is, therefore, important to gather information on the genetic variation within and between natural populations and the reproduc-tive biology of these populations.
Molecular markers have been used for germplasm characterization, phylogenetic and population genetic stud-ies in O. glumaepatula and several other Oryza species
www.sbg.org.br
Send correspondence to EA Veasey, Departamento de Genética, Escola Superior de Agricultura “Luiz de Queiroz”, Universidade de São Paulo, Caixa Postal 83, 13400-970 Piracicaba, SP, Brazil. E-mail: eaveasey@esalq.usp.br.
(Akimotoet al., 1998; Busoet al., 1998; Geet al., 1999; Doi
et al., 2000; Bautistaet al., 2001; Oliveira, 2002; Gaoet al., 2002a, 2002b; Gao, 2004; Brondaniet al., 2005). Busoet al.
(1998) used isozyme and random amplified polymorphic DNA (RAPD) markers to estimate genetic parameters for four South American O. glumaepatula populations and found high values for interpopulation differentiation.
Doiet al.(1996) analyzed accessions of AA genome
Oryzaspecies and concluded thatO.glumaepatulais a sub-type ofOryza rufipogon Griff. In a later study, Geet al.
(1999) used RAPD markers to investigate natural Chinese and BrazilianO. rufipogonpopulations and found that Chi-nese populations were more polymorphic at both the popu-lation and regional levels, thus concluding that the high degree of genetic differentiation between Chinese and Bra-zilian populations agrees with the classification of the Latin American form ofO. rufipogonas the separate speciesO. glumaepatula. More recently, Buso et al. (2001) used RAPD and specific sequences of nuclear and cytoplasmatic DNA coupled with phenetic and cladistic analyses to pro-duce phylogenetic trees verifying thatO. glumaepatulawas a separate species distinct fromO. rufipogon. Doiet al.
(2000) studied the variation in the mitochondrial, chloro-plast and nuclear DNA ofO. glumaepatulaand suggested that this species had multiple origins, while Bautistaet al.
(2001) investigated the phylogenetic relationships between cultivated and wild rice species and concluded that O. glumaepatula was relatively close to the cultivated rice speciesO. sativaandOryza glaberrima.
Microsatellites have been widely used in studies of population genetics of wild plants due to their reproduci-bility and the fact that they are more genetically informa-tive than is the case for other markers (Ferreira and Gratta-paglia, 1998), especially in populations with low genetic diversity at the DNA level (Peatkauet al., 1995). Brondani
et al.(2005) used ten microsatellite markers to analyze 30
O. glumaepatulapopulations from the Brazilian Amazon, Cerrado and Pantanal biomes, assessing six to 24 plants per population, and found high genetic diversity between popu-lations but high inbreeding levels within popupopu-lations, sug-gesting a preferentially self-pollinating breeding system.
We used eight microsatellite markers to estimate gene flow and genetic structure and analyze within and between population genetic variation in eleven Brazilian O. glumaepatulapopulations and to address specific strategies for thein situandex situconservation of this species.This is a complementary study to previous studies of O. glumaepatula using microsatellite markers with a larger sample of populations from the Amazon biome plus one particular population from the Xingu river in the Brazilian state of Mato Grosso, performing spatial correlation analy-sis and sampling a higher number of plants per population.
Material and Methods
Plant material
We investigated eleven BrazilianOryza glumaepatula
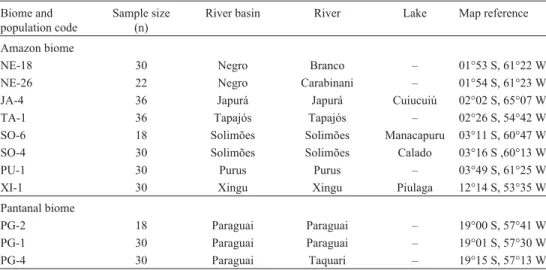
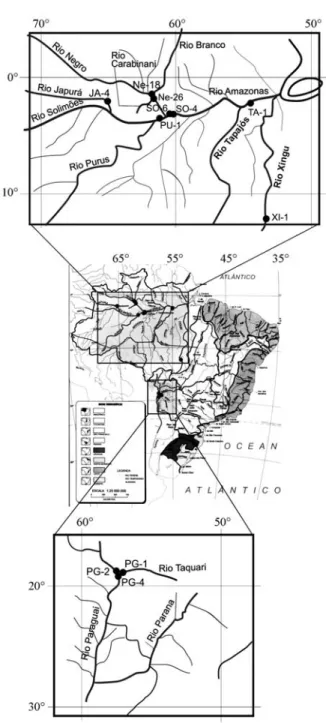
Steud. (Poaceae) populations held at the wild rice germplasm collection of the Genetics Department of Escola Superior de Agricultura “Luiz de Queiroz” (ESALQ/USP), Piracicaba, SP, Brazil. Seven of the populations (JA-4, NE-18, NE-26, PU-1, SO-4, SO-6 and TA-1) were from the basins of rivers tributary to the Amazon in the northern Brazilian states of Roraima and Amazonas between 01°53 S and 03°49 S in the Amazon biome, one population (XI-1) was also from an Ama-zon tributary but from the more southern state of Mato Grosso at 12°14 S in the Amazon biome, and three populations (PG-1, PG-2 and PG-4) were from the Paraguay river basin even fur-ther south in the state of Mato Grosso do Sul at between 19°00 S and 19°15 S in the Pantanal biome (Table 1, Figure 1). The population codes refer to the river basins, not the rivers where the plants were isolated.
Table 1- Origin of the 11 BrazilianOryza glumaepatulapopulations evaluated. The populations are ordered by latitude, starting with the most equatorial. Except for the XI-1 population, which was collected from a River Amazon tributary in Mato Grosso state, all the Amazon biome populations were collected from River Amazon tributaries in Amazonas and Roraima states. The Pantanal biome populations were collected in Mato Grosso do Sul state.
Biome and population code
Sample size (n)
River basin River Lake Map reference
Amazon biome
NE-18 30 Negro Branco – 01°53 S, 61°22 W
NE-26 22 Negro Carabinani – 01°54 S, 61°23 W
JA-4 36 Japurá Japurá Cuiucuiú 02°02 S, 65°07 W
TA-1 36 Tapajós Tapajós – 02°26 S, 54°42 W
SO-6 18 Solimões Solimões Manacapuru 03°11 S, 60°47 W
SO-4 30 Solimões Solimões Calado 03°16 S ,60°13 W
PU-1 30 Purus Purus – 03°49 S, 61°25 W
XI-1 30 Xingu Xingu Piulaga 12°14 S, 53°35 W
Pantanal biome
PG-2 18 Paraguai Paraguai – 19°00 S, 57°41 W
PG-1 30 Paraguai Paraguai – 19°01 S, 57°30 W
For each population, two to three seeds were sampled from individual plants collected in nature to form a bulk sample of 50 seeds which were germinated in germination chambers at 27 °C in the dark. Germinated seeds were transplanted to pots containing fertilized soil and cultivated to the adult stage in a greenhouse under natural lighting conditions. The number of adult plants sampled from each population ranged from 18 to 36 (Table 1).
Microsatellite analysis
Total genomic DNA was extracted from adult lyoph-ilized leaves using a cetyltrimethylammonium bromide
(CTAB) procedure (Hoisingtonet al., 1994) as simplified by Karasawa (2005) by removing the sodium acetate and all following steps. The DNA was quantified in a 4% (w/v) polyacrylamide gel using a silver staining procedure (Bas-sanet al., 1991).
Eight primer pairs (Table 2) developed by Brondani
et al.(2001) forO. glumaepatulawere selected for amplifi-cation. All primers were first submitted to a basic PCR pro-cedure with 56 °C for primer annealing (Brondaniet al., 2001). Primers that did not amplify satisfactorily were sub-mitted to new amplification cycles with higher and lower annealing temperatures. The primer pairs 26 and OG-29 amplified satisfactorily at 60 °C, and OG-27 amplified at 54 °C.
For each PCR reaction, 30 ng of genomic DNA were used in a 12µL volume containing 0.3µM of each primer, 0.25 mM of each dNTP, 1.5 mM of MgCl2, 10 mM Tris-HCl, and 0.6 unit of Taq DNA polymerase enzyme (Gibco BRL). The reactions were performed on a Primus 96 Ther-mocycler with 4 min initial denaturation at 94 °C, 30 subse-quent cycles (1 min at 94 °C, 1 min at 54 °C, 56 °C or 60 °C, 1 min elongation at 72 °C), followed by a final elongation of 5 min at 72 °C. Amplified products were electrophoresed on 6% non-denaturing polyacrylamide gels run vertically (120 V for 3 h). Amplified fragments were visualized using a silver staining procedure (Bassanet al., 1991) (Figure 2).
Data analysis
Genotypic frequencies were submitted to Fisher’s ex-act test considering Hardy-Weinberg equilibrium propor-tions (Weir, 1996), using the TFPGA program (Miller, 1997). Allelic and genotypic frequencies, mean number of alleles per locus (A), average percentage of polymorphic loci (P), mean observed heterozygosities (Ho), gene
diver-sity (He), and Wrights F statistics were estimated using the
GDA program (Lewis and Zaykin, 2000). Private alleles were also identified under the GDA program (Lewis and Zaykin, 2000).
The mutation process in microsatellite loci is not in line with the expectations under the infinite alleles model with low rates. Therefore, the analogue of theFSTparameter
(Slatkin, 1995) developed specifically for microsatellite data (RST) was also estimated. ParametersRSTand gene flow
(Nm) were estimated using the RSTCal program (Goodman, 1997). Dendrograms were constructed from Nei’s genetic distances matrix and the unweighted pair group method with averages (UPGMA) clustering criteria using the TFPGA program (Miller, 1997).
Spatial variation patterns were analyzed using Pear-son’s coefficient of correlation (r) between Nei’s genetic distances matrix (Nei, 1978) and the matrix of geographic distances (shortest distance between two given points on the map) between populations, using the NTSYS-pc pro-gram (Rohlf, 1992). Significance of these correlations was tested using Mantel’s Z statistic (Mantel, 1967) and 1000
random permutations. The average apparent outcrossing rate was estimated from the relationship ta = (1 - FIS)/
(1 +FIS), which is valid only if populations are in
equilib-rium with respect to the mating system. The parameterta
was also estimated for each population as
ta mean fi f n
i
( )=
∑
[(1− ) / (1+ )] / .Results
The eight pairs of primers amplified a total of 80 al-leles in 310 plants from the 11 populations of O. glumaepatulainvestigated (Table 2). All loci showed poly-morphism over the populations. The number of alleles per
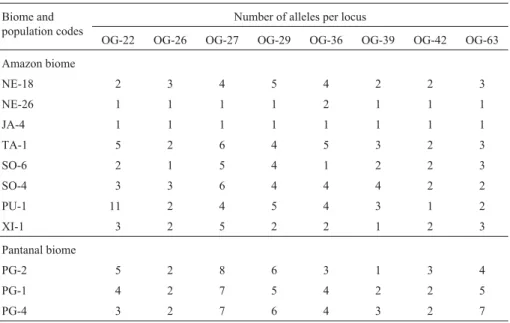
locus varied from 5 to 20 with an average of 10 alleles obtained in the 11 populations, although there was consid-erable variation among populations (Table 3). For example, while the River Japurá lake Cuiucuiú JA-4 population was monomorphic for the eight primers and the Carabinani River NE-26 population was also highly monomorphic with only one polymorphic locus (OG-36) having two leles, in the River Purus PU-1 population we detected 11 al-leles at the OG-22 locus. Considering all loci, 20% were monomorphic in the 11 populations investigated. Popula-tions from the Amazon River basin showed the highest level of monomorphism (30%), while the Paraguay River basin showed only 4%. These results are not in agreement with the RAPD data obtained by Busoet al.(1998) where monomorphism was higher in plants from the Paraguay re-gion (32%) and lower in those of the Amazon rere-gion (16%). Lower observed heterozygosity values were found for the 11 populations when compared to gene diversity values (Table 4), indicating an excess of homozygotes. De-viations from Hardy-Weinberg equilibrium were signifi-cant for all populations. The population from the Xingu River (XI-1) is clearly differentiated, with the highest level of observed heterozygosity (Ho= 0.233), the lowest
coeffi-cient of inbreeding (f= 0.371) and the highest apparent out-crossing rate (ta= 0.459). In general, populations were not
homogeneous in relation to gene diversity, withHevalues
ranging from 0.0 to 0.585, with the highest levels found in plants from the Paraguay River basin (PG-1, PG-4, PG-2), followed by populations SO-4 and NE-18 from the Soli-mões and Negro river basins, respectively, in the Amazon biome. Regarding the mating system, inferred here through
Table 2- Simple sequence repeat (SSR) loci, primer-pair sequences developed forOryza glumaepatula(Brondaniet al.2001), chromosome number (CN), allele size range in base pairs (bp), number of alleles per locus (A) and annealing temperatures (Ta). The mean number of alleles per locus (A) was
10.
SSR loci Primer sequences CN bp A Ta(°C)
OG 22 (F) GCCATCCATTCTTACCAG 12 165-265 20 56
(R) CACAGGTGTGGTGCTCA
OG 26 (F) CATGGTGCCGATTACGGT 10 95-120 5 60
(R) CATCTCCATCGCGGTCAT
OG 27 (F) TCGGACGTGGCATATGA 9 120-210 16 54
(R) CTGTTCCGAGCGAGAGT
OG 29 (F) GACCAGTTCACCATGCAG 1 80-125 10 60
(R) GAGTGAGGCAGCAAGACA
OG 36 (F) AACGTTCATCGGTTCTGG 4 150-190 8 56
(R) TGCTTGCCAGGTTATTCC
OG 39 (F) GCGTACTAGGCCATGATA 3 250-275 6 56
(R) TCCACGTAAGAACACTCG
OG 42 (F) TGCAGGCTCTGAGCTAC 5 420-440 6 56
(R) AGAACAGATCTTGCCGTC
OG 63 (F) CAGGGGACAAGCACATA 2 100-150 9 56
(R) TAGACGATGTCGAGAAGG
the average apparent outcrossing rate (ta= 0.143) and the
population-level outcrossing rates (ta), a strong tendency to
self-fertilization with a small amount of outcrossing pre-vailed, with some degree of variation between populations. The exception was population XI-1 that was intermediate, with 45.9% of outcrossing. The average apparent outcross-ing rate is in agreement with the estimate obtained by Brondani et al. (2005) for O. glumaepatula, namely
ta= 0.135. The lowtaestimate found in our study is a
conse-quence of the high intrapopulation coefficient of inbreed-ing detected (averagef= 0.750, Table 4).
The genetic differentiation between populations, rel-ative to the total genetic variation, was very high (FST= 0.491 andRST= 0.608), these estimates being
statisti-cally similar and different from zero (Table 5). Based on the
RSTvalue, the apparent number of migrants per generation
wasNm= 0.161, which was a function of the high differen-tiation between populations. The very high total inbreeding coefficient (FIT= 0.888) was primarily caused by the
intra-population inbreeding (FIS= 0.780) but differentiation also
played an important role in explaining thisFITestimate.
Table 3- Number of alleles per locus for eleven BrazilianOryza glumaepatulapopulations.
Biome and population codes
Number of alleles per locus
OG-22 OG-26 OG-27 OG-29 OG-36 OG-39 OG-42 OG-63
Amazon biome
NE-18 2 3 4 5 4 2 2 3
NE-26 1 1 1 1 2 1 1 1
JA-4 1 1 1 1 1 1 1 1
TA-1 5 2 6 4 5 3 2 3
SO-6 2 1 5 4 1 2 2 3
SO-4 3 3 6 4 4 4 2 2
PU-1 11 2 4 5 4 3 1 2
XI-1 3 2 5 2 2 1 2 3
Pantanal biome
PG-2 5 2 8 6 3 1 3 4
PG-1 4 2 7 5 4 2 2 5
PG-4 3 2 7 6 4 3 2 7
Table 4- Average estimates of the genetic parameters based on eight microsatellite loci for eleven BrazilianOryza glumaepatulapopulations: number of plants sampled per locus (N), average number of alleles per locus (A), percentage of polymorphic loci (p), observed heterozygosity across loci (Ho), gene
diversity (He), fixation index (f) and apparent crossing rate (ta).
Biome and population codes
Genetic parameters
N A p Ho He f ta
Amazon biome
NE-18 29.1 3.250 100.0 0.073 0.526 0.863 0.074
NE-26 21.6 1.125 12.5 0.011 0.030 0.628 0.229
JA-4 35.4 1.000 0.0 0.000 0.000 –
TA-1 32.4 3.875 100.0 0.018 0.464 0.961 0.020
SO-6 16.8 2.500 75.0 0.136 0.364 0.634 0.224
SO-4 29.6 3.500 100.0 0.054 0.527 0.898 0.054
PU-1 29.8 4.000 87.5 0.071 0.328 0.787 0.119
XI-1 30.0 2.500 87.5 0.233 0.369 0.371 0.459
Pantanal biome
PG-2 16.6 4.000 87.5 0.126 0.562 0.780 0.123
PG-1 30.0 3.875 100.0 0.100 0.569 0.827 0.095
PG-4 29.9 4.375 100.0 0.176 0.585 0.703 0.174
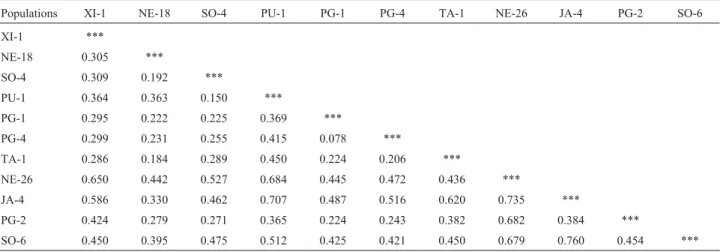
Nei’s genetic distances, calculated pairwise between populations, ranged from 0.078 to 0.760 (Table 6). A higher degree of similarity was only found between popula-tions PG-1 and PG-4 and between SO-4 and PU-1. These results, plus the UPGMA dendrogram (Figure 3), indicate that populations from the same regions did not form clus-ters based on proximity, a conclusion supported by the low correlation between the genetic and geographic distances (r = 0.03). Figure 4 shows that private alleles were obtained in nine of the 11 populations reaching relatively large num-bers, such as populations PU-1 with eight alleles, PG-2 with six and SO-6 with five alleles. These numbers are sig-nificant considering that the mean number of alleles ranged from 1.0 to 4.4 within populations (Table 4).
Discussion
Genetic variation
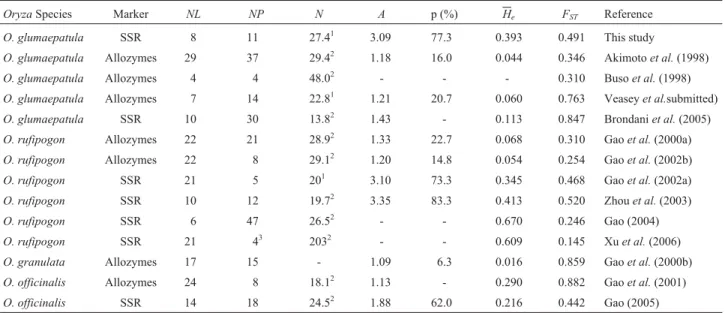
High average genetic diversity indices where found for the BrazilianO. glumaepatulapopulations in this study using microsatellite markers (A= 3.091; P= 77.3%;
He= 0.393), in spite of the predominantly self-fertilization
mating system of this species. However, the populations were not homogeneous with respect to observed heterozygosities (Ho), gene diversity (He), number of
pri-vate alleles and apparent outcrossing rates (ta). The large
difference between the observed heterozygosity (Ho= 0.091) and gene diversity (He= 0.393) and the
signifi-cance of the exact Fisher’s tests for departure from Hardy-Weinberg proportions were caused by the prevailing mat-ing system. These indices were superior to those reported by Busoet al.(1998) (Ho= 0.00 to 0.025 andHe= 0.00 to
0.21) and Akimotoet al.(1998) (Ho= 0.03 andHe= 0.044)
with isozyme markers, probably due to the high degree of heterozygosity and higher allele number detected by the microsatellite markers in our study. However, Brondaniet al.(2005) found lower values for these indices (Ho= 0.027
Table 5 - Estimates of Wright’s F statistics,RSTand the number of
migrants per generation (Nm) for eleven natural Brazilian Oryza
glumaepatulapopulations.
FIT FST FIS RST NmA1 NmB2
Under all the loci 0.888 0.491 0.780 0.608 0.161 0.259
Upper (CI95%)3 0.925 0.541 0.836 0.668 -
-Lower (CI95%) 3
0.841 0.443 0.715 0.547 -
-1Based onR
ST.2Based onFST.3CI95%= 95% confidence interval.
Table 6- Nei’s (1978) standard genetic distances between eleven BrazilianOryza glumaepatulapopulations.
Populations XI-1 NE-18 SO-4 PU-1 PG-1 PG-4 TA-1 NE-26 JA-4 PG-2 SO-6
XI-1 ***
NE-18 0.305 ***
SO-4 0.309 0.192 ***
PU-1 0.364 0.363 0.150 ***
PG-1 0.295 0.222 0.225 0.369 ***
PG-4 0.299 0.231 0.255 0.415 0.078 ***
TA-1 0.286 0.184 0.289 0.450 0.224 0.206 ***
NE-26 0.650 0.442 0.527 0.684 0.445 0.472 0.436 ***
JA-4 0.586 0.330 0.462 0.707 0.487 0.516 0.620 0.735 ***
PG-2 0.424 0.279 0.271 0.365 0.224 0.243 0.382 0.682 0.384 ***
SO-6 0.450 0.395 0.475 0.512 0.425 0.421 0.450 0.679 0.760 0.454 ***
Figure 3 - Pattern of genetic divergence of 11 Brazilian Oryza glumaepatula populations based on eight microsatellite loci and un-weighted pair group method with averages (UPGMA) clustering with sim-ilarities obtained from Nei’s distances (1978).
andHe= 0.113) withO. glumaepatulapopulations
investi-gated using microsatellite markers (Table 7). The differ-ence between our results and those of Brondaniet al.could be due to both the higher number of plants per population sampled in our study (an average of 27.4 in our study com-pared to 13.8 by Brondaniet al.) and also to the greater number of Amazon biome populations sampled by us. It should be pointed out that Brondani et al. (2005) found lowerHevalues for populations from the Amazon biome,
whilst in our study the contrary occurred in that several populations from the Amazon biome showed relatively highHe values and a great heterogeneity of diversity
pa-rameters was found for these populations. Our study also provided a higher number of alleles per locus, an average of 3.09 compared to the 1.43 average found by Brondaniet al.
(2005). It is thus plausible to conjecture that samples larger than those used in this study could produce higher estimates forHo,HeandA.
In microsatellite marker studies ofO. rufipogon (Ta-ble 7) similar results were obtained by Gaoet al.(2002a), who found 3.10 alleles per locus (He= 0.345), and Zhouet
al.(2003) who obtained 3.35 alleles per locus (He= 0.413).
Gaoet al.(2000a, 2002b) also found lower indices inO. rufipogonstudied with allozyme markers. The similarities betweenO. glumaepatulaandO. rufipogonin terms of ge-netic variability contrasts with the RAPD marker results obtained by Geet al.(1999), who reported higher genetic variability for O. rufipogon as compared to O. glumaepatula. The different results may be due to the fact that only four AmazonianO. rufipogon(O. glumaepatula) populations were evaluated by Geet al.(1999), contrasting with the 11 populations from the Amazon biome and the
Paraguay river basin from the Pantanal biome assessed in this study and by Brondaniet al.(2005), the latter study also including populations from the Cerrado biome in the Brazilian state of Goiás. In the microsatellite studies, both
O. glumaepatulaandO. rufipogonpresented higher levels of genetic diversity (Table 7) when compared to O. officinalisGao (2005), a wild species with a wide distribu-tion in tropical and subtropical regions (Vaughan, 1994).
We found a high level of private alleles. Variation in the numbers of private alleles may have been due to the fact that the populations studied have undergone variable peri-ods of genetic isolation during their evolutionary history.
Mating system
The apparent outcrossing rates estimated by us indi-cated different levels of cross-pollination among O. glumaepatula populations, varying from 2.2% to 45.9% with a mean value of 14.3%. This mean value indicated a predominantly self-fertilization mating system with a small amount of outcrossing. Similar average estimates (13.5%) were reported by Brondani et al. (2005) for O. glumaepatulapopulations.
It seems that the real distribution of outcrossing rates inO. glumaepatulais probably composed of values lower than formerly believed (Oka, 1988), indicating that the re-productive system of this species should be classified as mixed with predominant selfing. Anther and stigma lengths of the wild riceO. glumaepatulaare generally much larger than in the cultivated riceO. sativa, an autogamous crop. In
O. glumaepatulaboth anthers and stigmas are completely protruded during anthesis and generally the flowers of the same panicle do not open at the same time (Oliveira GCX,
Table 7- List of studies on genetic diversity of severalOryzaspecies using microsatellites (SSR) and allozyme markers, including number of loci as-sessed (NL), number of populations analyzed (NP), mean sample size per locus or population (N), mean number of allele per locus (A), percentage of polymorphic loci (p), gene diversity (He) and Wright’s among population diversity (FST) parameters.
OryzaSpecies Marker NL NP N A p (%) He FST Reference
O. glumaepatula SSR 8 11 27.41 3.09 77.3 0.393 0.491 This study
O. glumaepatula Allozymes 29 37 29.42 1.18 16.0 0.044 0.346 Akimotoet al.(1998)
O. glumaepatula Allozymes 4 4 48.02 - - - 0.310 Busoet al.(1998)
O. glumaepatula Allozymes 7 14 22.81 1.21 20.7 0.060 0.763 Veaseyet al.submitted)
O. glumaepatula SSR 10 30 13.82 1.43 - 0.113 0.847 Brondaniet al.(2005)
O. rufipogon Allozymes 22 21 28.92 1.33 22.7 0.068 0.310 Gaoet al.(2000a)
O. rufipogon Allozymes 22 8 29.12 1.20 14.8 0.054 0.254 Gaoet al.(2002b)
O. rufipogon SSR 21 5 201 3.10 73.3 0.345 0.468 Gaoet al.(2002a)
O. rufipogon SSR 10 12 19.72 3.35 83.3 0.413 0.520 Zhouet al.(2003)
O. rufipogon SSR 6 47 26.52 - - 0.670 0.246 Gao (2004)
O. rufipogon SSR 21 43 2032 - - 0.609 0.145 Xuet al.(2006)
O. granulata Allozymes 17 15 - 1.09 6.3 0.016 0.859 Gaoet al.(2000b)
O. officinalis Allozymes 24 8 18.12 1.13 - 0.290 0.882 Gaoet al.(2001)
O. officinalis SSR 14 18 24.52 1.88 62.0 0.216 0.442 Gao (2005)
unpublished data), diminishing the probability of selfing by geitonogamy. It is known thatO. glumaepatulapopulations occur in large flooded plains, open vegetation formations where high densities and the presence of wind provide ade-quate conditions for anemophily. The flowers can attract insects as well, and indeed are visited by wild bees in the Amazon under natural conditions and by domestic bees and wasps under experimental conditions (Oliveira GCX, un-published observations), although the role of these insects as pollinators has never been assessed. The mechanism by which a large amount of selfing occurs in spite of the pres-ence of morphological and ecological elements encourag-ing allogamy is still unclear, but we feel that a plausible explanation is the dehiscence of the anther accompanied by stigma receptivity before anthesis.
Population genetic structure
Our estimates ofFST(0.491) andRST(0.608) indicated
that at least 50% of the molecular diversity of O. glumaepatulaoccurred between populations, results which are not surprising for a predominantly self-fertilizing spe-cies. These relatively high values have direct consequences on the planning of conservation strategies. Considering that a given effective population size (Ne*) is to be achieved with the sampling ofSpopulations sufficiently large to rep-resent a metapopulation, this number must be such that
S≥2FSTNe*(Vencovsky and Crossa, 2003). This
inequal-ity assumes that the actual number of populations in nature is large. WithFST = 0.49 and a desiredNe* the result is
S≥0.98Ne*.Hence, many populations would then be nec-essary if a highNe* value is required.
Lower values for the FST parameter for O.
glumaepatulapopulations have been reported by Akimoto
et al. (1998) (FST = 0.346) and Buso et al. (1998)
(FST= 0.31) using allozyme markers (Table 7). However,
with RAPD analysis Busoet al.(1998) obtained a higher value (FST=0.64), similar to theRSTvalues. Also, Brondani
et al.(2005) reported that population subdivision was re-sponsible for the major increase in inbreeding for this spe-cies when using microsatellite markers, with values of
FST= 0.85,RST= 0.90,FIS= 0.79 andFIT= 0.98. The higher
FSTvalues found with microsatellite markers by Brondani
et al.(2005) may be explained by the smaller number (6 to 24) of plants sampled to represent the population, which may have overestimated the divergence between popula-tions. A parallel study of O. glumaepatula (Silva CM, Karasawa MMG, Veasey EA, unpublished data) with a small sample (12 to 24 plants) per population also provided higher F statistic values (FIT = 0.963; FIS = 0.858;
FST= 0.715), although a similar result with allozyme data
was obtained when evaluating 14O. glumaepatula popula-tions (Veasey EA, Cardin DC, Silva RM, Bressan EA, Vencovsky R, submitted) with seven loci and an average of 22.8 sampled plants per locus. With allozyme markers,O. officinalis(Gaoet al., 2001) andO. granulata(Gaoet al.,
2000b) have also shown higher levels of population differ-entiation (Table 7), although lower levels were detected for
O. officinaliswhen assessed with microsatellite markers (Gao, 2005), similar to the values observed in our study. Gao (2005) has suggested that the different results achieved when using allozyme and microsatellite markers in O. officinalis are due to differences in interpopulation dis-tances.
When studying the genetic diversity among O. rufipogonpopulations from Brazil (O. glumaepatula) and China, Geet al.(1999) reported that genetic diversity be-tween populations differed bebe-tween these continents. Mo-lecular variance analysis (AMOVA) with RAPD data showed that the percentage of genetic diversity between populations was 52.74% for the Brazilian and 28.75% for the Chinese populations. Even lower variability between populations was found inO. rufipogonusing microsatellite markers, when examining Chinese populations and subpo-pulations (Gao, 2004; Xuet al., 2006). Higher diversity levels and higher within population variability found in Chinese O. rufipogon populations, in relation to South AmericanO. glumaepatulapopulations, have been attrib-uted to the higher outcrossing rates observed in Chinese populations (Geet al., 1999).
In our Brazilian O. glumaepatula populations the large genetic differentiation between populations was, as discussed above, a reflection of the predominantly self-fer-tilization mating system which reduced gene flow between populations. The mating system and the consequently high intrapopulation inbreeding (FIS= 0.78) was also the major
factor responsible for the high total inbreeding (FIT= 0.888)
detected in our study. Other reports onO. glumaepatula re-productive system have also been associated with high val-ues of total inbreeding, such as Akimoto et al. (1998) having reportedFIS= 0.769,FIT= 0.965 andFST= 0.346 and
Busoet al.(1998)FIS= 0.930,FIT= 0.970 andFST= 0.310.
In our study, low values were estimated for the num-ber of migrants per generation (Nm= 0.259 and 0.161 for
FSTandRST, respectively). Gene flow estimated by theRST
parameter was lower and is probably a more precise mea-sure since RST provides less biased estimates of
micro-satellite demographic parameters for a population thanFST
(Slatkin, 1995).Nmvalues are related to theFSTorRST
pa-rameters, according to the equationNm= 1/4(1/Rst - 1), whereas theRSTdepends on the capacity of the marker to
show polymorphism and the capacity of the sampled plants to represent the total variability existing in the population. When the within population diversity is low, the effect of the subdivision tends to be pronounced because the total di-versity in the species is found between populations.
in that study. Busoet al.(1998) classified gene flow as in-termediate, according to the three levels of gene flow for highly autogamic species described by Govindajaru (1989) based on Nm estimations: high, Nm > 1; intermediate, 0.250 < Nm< 0.999; and low,Nm< 0.249). Gao (2004) also found limited gene flow among ChineseO. rufipogon
populations (Nm= 0.766). Akimotoet al.(1998) have em-phasized that gene flow in AmazonianO. glumaepatula
populations seems to be due to seed dispersal rather than pollen dispersal, and that gene flow proceeds mainly in the direction of river flow. In fact, the viability of pollen grains in the genusOryzais, in general, limited to a few minutes (Oka, 1988), which makes gene flow between populations separated by a few hundred meters impossible. Even in re-gions with the highest densities, populations are separated by rivers, tributaries, lakes, channels and forests that are usually many hundreds of meters wide. Thus, pollen migra-tion must play a minor role in gene flow. On the other hand, zoochory (see below) and dispersal of whole plants by pro-grammed abscission followed by floating downstream must be the factors responsible for theNmvalues observed.
In our study, all 11 O. glumaepatula populations formed random groupings in the cluster analysis and not ac-cording to their geographic origin. Hence, the hypothesis previously formulated that the more geographically distant populations would also be genetically more differentiated was discarded by the results of the correlation analysis, which showed no correlation between the genetic and graphic distances (r = 0.03). This result indicates that geo-graphic proximity is not indicative of genetic similarity and, therefore, is not a guide for understanding the genetic structure of this species. On the other hand, comparable cluster analyses based on allozyme markers have placedO. glumaepatula populations from the Brazilian Pantanal Matogrossense and those originated in the Amazon region in different groups (Veasey EA, Cardin DC, Silva RM, Bressan EA, Vencovsky R, submitted). This result may be due to a selection effect that may appear in allozyme mark-ers, resulting from the expression of adaptive genes (Fer-reira and Grattapaglia, 1998) as it was evident that certain alleles were mostly predominant in the Amazon biome populations whereas other alleles of the same locus were predominant in the Pantanal biome populations. However, this was not observed with microsatellite markers because these markers are not adaptive and hence the genetic drift effect is random throughout evolutionary time (Pemberton
et al., 2000).
The geographic distribution of the genetic variation in
O. glumaepatulais not expected to be simple to describe or explain from either an historical or adaptive point of view. The reason for this is the apparently intense migration be-tween and within basins, following unpredictable timing and direction. No systematic study on migration and dis-persal of Amazonian wild rice has ever been performed, in part because of its inherent difficulty, but a few reports
from various sources partly reveal the complexity of the sit-uation. The principal habitats ofO. glumaepatulaare the flooded grasslands and flooded forests on the Quaternary terrains found on the banks of the major rivers of the Ama-zonian Basin and Pantanal. These terrains are not homoge-neously distributed along the rivers but instead are concentrated in patches, mainly on the left banks of the Middle Amazon, the confluence of the Japurá with the Solimões rivers, the confluence of the Purus with the Soli-mões, the headwaters of the River Xingu, the Bananal Is-land in the Araguaia, the Guaporé Basin, the central north coast of the Brazilian state of Amapá, the Paraguay basin and the plains around the River Negro. These are the re-gions where most of theO. glumaepatulapopulations oc-cur, although sparse and less dense populations are spread among them.
The river banks and flooded plains which are the main habitat of members of the genusOryzacan be eroded and quickly become uncolonizable. Satellite image analy-ses have revealed that the fusiform islands typical of the Solimões/Amazon, which are rich in wild rice populations, normally shift along the river as a result of erosion-depo-sition. Such geographical mobility may be the cause of rapid cycles of population extinction and colonization, ex-plaining part of the lack of significance of the correlation coefficient and the absence of clustering of geographically contiguous river basins. This also makes the delimitation of priority areas forin situconservation more difficult. Also, the multiple agents and directions of the dispersal move-ments among the river basins in the Amazon (Morishima and Martins, 1994) permit the insertion of recently estab-lished, unrelated, long-distance immigrant populations, and may partially explain the loose geographical structure so far observed.
Conservation Remarks
This study reveals the existence of diversity both within and between river basins, as well as of alleles partic-ular to each population. Studies like these can be useful in setting guidelines both forin situconservation and for col-lecting and maintaining germplasm in banks, having in mind short-term conservation. For instance, the mean num-ber of alleles enables the populations to be put in order of genetic richness, and to conclude, at least under the current state of knowledge, that populations PG-4 and PG-2, in the Paraguay River system, and PU-1, in the Amazon, are con-servation priorities. High genetic diversity is also another criteria to be taken into consideration. Therefore, popula-tions SO-4 and NE-18, from the Amazon, should also be considered as conservation priorities. In addition, bothFST
andtaindicate that, in most cases, it is advisable to sample
situconservation, but long-term in situ conservation de-mands more studies over long periods on the dynamics of the populations. Allelic richness was found in our study even for populations isolated from cultivated materials, in contrast with conclusions drawn previously (Brondani et al., 2005).
Based on data obtained in this study and in Brondani
et al.(2005) and Silva CM, Karasawa MMG, Veasey EA (unpublished data), we suggested that future studies should not only increase the number of populations collected, but also the number of plants sampled per population. This pro-cedure will provide a better estimate of the real allelic di-versity in the populations, as these estimates will have a direct effect on the values obtained for other diversity and population genetic structure estimates.
A further study suggested is the possible effects of the breeding system and genetic drift over generations inO. glumaepatulapopulations, which could be carried out us-ing computer simulations. A preliminary study investigated the effect of the breeding system on the structure and ge-netic diversity within and between populations (XI-1, SO-6 and PG-1) for one generation. Results indicated high fixa-tion indices within each family on each populafixa-tion but the total within population diversity was maintained after a generation (Karasawa MMG, Vencovsky, R., Zucchi, MI, Oliveira, GCX, Veasey, EA, unpublished data). Based on this preliminary study we suggest further studies to deter-mine the real evolutionary effect of the reproductive system on the distribution of genetic diversity over many genera-tions, to establishing the most effective conservation prac-tices forO. glumaepatulaspecies.
Acknowledgments
The authors wish to thank the Brazilian research councils CNPq and FAPESP and the Ministry of Education of Japan for grants and financial supports, Dr. Elaine Cris-tina Cardoso Fidalgo for help with the satellite images, the National Institute of Amazonian Research (INPA, Manaus, Brazil) for collaboration during field collecting activities, and the National Institute of Space Research (INPE, Bra-zil). The authors are also grateful to two anonymous re-viewers for valuable comments on the manuscript.
References
Akimoto M, Shimamoto Y and Morishima H (1998) Population genetic structure of wildOryza glumaepatuladistributed in the Amazon flood area influenced by its life-history traits. Mol Ecol 7:1371-1381.
Bassam BJ, Caetano-Anolles G and Gresshoff PM (1991) Fast and sensitive silver staining of DNA in polyacrylamide gels. Anal Biochem 196:80.
Bautista NS, Solis R, Kamijima O and Ishii T (2001) RAPD, RFLP and SSLP analyses of phylogenetic relationships be-tween cultivated and wild species of rice.Genes Genet Syst 76:71-79.
Brondani C, Brondani RPV, Rangel PHN and Ferreira ME (2001) Development and mapping ofOryza glumaepatula-derived microsatellite markers in the interspecific cross Oryza glumaepatulaxO. sativa. Hereditas 134:59-71.
Brondani RPV, Zucchi MI, Brondani C, Rangel PHN, Borba TCO, Rangel PN, Magalhães MR and Vencovsky R (2005) Genetic structure of wild riceOryza glumaepatula popula-tions in three Brazilian biomes using microsatellite markers. Genetica 125:115-123.
Buso GSC, Rangel PH and Ferreira ME (1998) Analysis of ge-netic variability of South American wild rice populations (Oryza glumaepatula) with isozymes and RAPD markers. Mol Ecol 7:107-117.
Buso GSC, Rangel PH and Ferreira ME (2001) Analysis of ran-dom and specific sequences of nuclear and cytoplasmatic DNA in diploid and tetraploid American wild rice species (Oryzaspp.). Genome 44:476-494.
Doi K, Yoshimura A, Nakano M and Iwata N (1996) Classifica-tion of A genome species in the genusOryzausing nuclear DNA markers.Int Rice Res Notes 21:2-3.
Doi K, Nomura MN, Yoshimura A, Iwata N and Vaughan DA (2000) RFLP relationships of A-genome species in the ge-nusOryza. J Fac Agr Kyushu U 45:83-98.
Ferreira ME and Grattapaglia D (1998) Introdução ao Uso de Marcadores Moleculares em Análise Genética. 3rd edition. Embrapa/Cenargen, Brasília, 220 pp.
Gao LZ (2004) Population structure and conservation genetics of wild riceOryza rufipogon(Poaceae): A region-wide per-spective from microsatellite variation. Mol Ecol 13:1009-1024.
Gao LZ (2005) Microsatellite variation within and among popula-tions ofOryza officinalis(Poaceae), an endangered wild rice from China. Mol Ecol 14:4287-4297.
Gao LZ, Ge S and Hong DY (2000a) Allozyme variation and pop-ulation genetic structure of common wild rice Oryza rufipogonGriff. in China. Theor Appl Genet 101:494-502. Gao LZ, Ge S and Hong DY (2000b) Low levels of genetic
diver-sity within population and high differentiation among popu-lations of a wild rice, Oryza granulataNees et. Arn. ex. Watt. from China. Int J Plant Sci 161:691-697.
Gao LZ, Ge S and Hong DY (2001) High levels of genetic differ-entiation ofOryza officinalisWall. et Watt. from China. J Hered 92:511-516.
Gao LZ, Schaal BA, Zhang CH, Jia JZ and Dong YS (2002a) As-sessment of population genetic structure in common wild rice Oryza rufipogonGriff. using microsatellite and allo-zyme markers. Theor Appl Genet 106:173-180.
Gao LZ, Ge S and Hong DY (2002b) Allozyme variation and con-servation genetics of common wild rice (Oryza rufipogon
Griff.) in Yunnan, China. Euphytica 124:273-281.
Gao LZ, Zhang CH, Chang LP, Jia JZ, Qiu ZE and Dong YS (2005) Microsatellite diversity withinOryza sativawith em-phasis onindica-japonicadivergence. Genet Res 85:1-14. Ge S, Oliveira GCX, Schaal BA, Gao LZ and Hong DY (1999)
RAPD variation within and between natural populations of the wild riceOryza rufipogonfrom China and Brazil. Hered-ity 82:1-7.
Goodman SJ (1997) RSTCalc: A collection of computer program
Govindajaru RD (1989) Variation in gene flow levels among pre-dominantly self-pollinated plants. J Evolution Biol 2:173-181.
Hedrick PW (2001) Conservation genetics: Where are we now? Trends Ecol Evol 16:629-636.
Hoisington D, Khairallah M and Gonzalez-de-Leon D (1994) Laboratory Protocols: CYMMYT Applied Molecular Ge-netics Laboratory.CYMMYT, Mexico, 88 pp.
Holsinger KE (2000) Reproductive systems and evolution in vas-cular plants. P Natl Acad Sci USA 97:7037-7042.
Karasawa MMG (2005) Análise da estrutura genética de popula-ções e sistema reprodutivo deOryza glumaepatulapor meio de microssatélites. Ph.D. Thesis, Escola Superior de Agri-cultura “Luiz de Queiroz”, Universidade de São Paulo, Pira-cicaba.
Lewis PO and Zaykin D (2000) Genetic Data Analysis: Computer Program for the Analysis of Allelic Data.Version 1.0 (d15). http://alleyn.eeb.uconn.edu/gda.
Mantel N (1967) The detection of disease clustering and a gener-alized regression approach. Cancer Res 27:209-220. Miller M (1997) Tools For Population Genetic Analyses
(TFPGA) 1.3: A Windows Program for Analysis of Allozy-me and Molecular Population Genetic Data. http://www. public.asu.edu.
Morishima H and Martins PS (1994) Investigations of plant ge-netic resources in the Amazon Basin with emphasis on the genusOryza.Report of the 1992/93 Amazon Project.The Monbusho International Scientific Research Program, Ja-pan, and FAPESP, Brazil, 100 pp.
Nei M (1978) Estimation of average heterozygosity and genetic distance from a small number of individuals. Genetics 89:583-590.
Oka HI (1988) Origin of Cultivated Rice.Japan Scientific Soci-eties Press, Tokyo, and Elsevier Science Publishers, Am-sterdam, 254 pp.
Oliveira GCX (1994) Geographic distribution of wildOryza spe-cies in Brazil. In: Morishima H and Martins PS (eds) Investi-gations of Plant Genetic Resources in the Amazon Basin with Emphasis on the GenusOryza. Report of 1992/93
Am-azon Project, The Monbusho International Scientific Re-search Program, Japan, and FAPESP, Brazil, pp 10-15. Oliveira GCX (2002) A molecular phylogenetic analysis ofOryza
L. based on chloroplast DNA sequences. Ph.D. Thesis, Washington University, St. Louis.
Peatkau D, Calvert W, Stirling I and Strobeck C (1995) Micro-satellite analysis of population structure in Canadian Polar bears. Mol Ecol 4:347-354.
Pemberton JM, Coltman C, Coulson TN and Slade J (2000) Using microsatellites to measure the fitness consequence of in-breeding and outin-breeding. In: Goldstein DB and Schlötterer C (eds) Microsatellites: Evolution and Applications. Oxford University Press, New York, pp 151-164.
Richards AJ (1997) Plant Breeding Systems. 2nd edition. Chap-man and Hall, London, 529 pp.
Rohlf J (1992) NTSYS-pc: Numerical Taxonomy and Multiva-riate Analysis System. Version 1.70 (software). Stony Brook, New York.
Slatkin M (1995) A measure of population subdivision based on microsatellite allele frequencies. Genetics 139:457-462. Vaughan DA (1994) The Wild Relatives of Rice: A Genetic
Re-sources Handbook. International Rice Research Institute, Manila, 137 pp.
Vaughan DA, Morishima H and Kadowaki K (2003) Diversity in theOryzagenus. Curr Opin Plant Biol 6:139-146.
Vencovsky R and Crossa J (2003) Measurements of representa-tiveness used in genetic resources conservation and plant breeding. Crop Sci 43:1912-1921.
Weir BS (1996) Genetic Data Analysis II: Methods for Discrete Population Genetic Data. Sinauer Associates, Inc. Pub-lishers, Sunderland, 445 pp.
Xu X, Lu BR, Chen YH, Xu M, Rong J, Ye P, Chen J and Song Z (2006) Inferring population history from fine-scale spatial genetic analysis in Oryza rufipogon(Poaceae). Mol Ecol 15:1535-1544.
Zhou HF, Zhong WX and Ge S (2003) Microsatellite analysis of genetic diversity and population genetic structure of a wild rice (Oryza rufipogonGriff.) in China. Theor Appl Genet 107:332-339.