Contents lists available atScienceDirect
Journal of Pharmaceutical Analysis
journal homepage:www.elsevier.com/locate/jpa
Original Research Article
Quanti
fi
cation of theophylline or paracetamol in milk matrices
by high-performance liquid chromatography
Tânia A.P. Fernandes
a, João P. Aguiar
a, Ana I. Fernandes
a,⁎, João F. Pinto
baCiiEM
–Centro de Investigação Interdisciplinar Egas Moniz, Instituto Superior de Ciências da Saúde Egas Moniz, Campus Universitário-Quinta da Granja, Monte de Caparica, 2829-511 Caparica, Portugal
biMed.UL - Dep. Tecnologia Farmacêutica, Faculdade de Farmácia, Universidade de Lisboa, Av. Prof. Gama Pinto, 1649-003 Lisboa, Portugal
A R T I C L E I N F O
Keywords:
Liquid chromatography Fresh milk
Powdered milk Paracetamol Theophylline
A B S T R A C T
A simple, accurate and sensitive high-performance liquid chromatography (HPLC) method was developed, validated and applied to the determination of either theophylline or paracetamol in milk-based samples. The method allowed drug quantification in fresh and powdered milk with a relatively short run time of analysis and it was also successfully applied to the quantification of the drugs in solid dosage forms intended for pediatric use. Moreover, the main significant advantages over other published works are the simplicity of the sample preparation, reduced assay time and sample loss. The method meets the International Conference on Harmonization guideline for analytical methods validation regarding specificity, linearity, accuracy, precision, specificity and robustness as required by health authorities and applied by industry while designing and marketing new drug products. The technique encompasses the separation of the analytes with a reverse phase C18column under isocratic conditions and UV detection at 272 nm and 243 nm, respectively, for theophylline
and paracetamol. The lower limit of quantification for both drugs was determined as 0.2 µg/mL and the between-batch accuracy was 99.7%. This HPLC method allows quantification of theophylline and paracetamol in milk matrices and it can be applied in the design, development and production of milk-based pediatric dosage forms.
1. Introduction
Theophylline and paracetamol are drugs extensively used both in human and veterinary medicine. Theophylline is a potent bronchodi-lator used in the treatment of bronchial asthma, infant apnea and chronic obstructive pulmonary disease [1]. On the other hand, para-cetamol (or acetaminophen) acceptance and effectiveness is proven as analgesic and antipyretic in adults and children; in fact, it is the drug of choice in pediatric palliative care and is considered essential for child survival[2].
Pediatric use of both drugs requires constant dose adjustment based on children's characteristics, namely body weight or surface area. Breast-fed infants are also likely to be exposed to residues of theophyl-line and paracetamol taken by nursing mothers, who can pass the drugs into the breast milk; another possible drug sources are foods of animal origin [3], such as commercial powdered or fresh milk. Due to the possible liver toxicity (paracetamol) and narrow therapeutic index (theophylline), it is imperative to carefully select and monitor the amount of drug (intentional or involuntary) administered to children in
order to avoid toxicity and undesirable side effects.
Children's unique therapeutic needs have recently led to new pediatric regulations[4,5]and development of medicines specifically designed for this age group [6,7]. In this respect, milk has been proposed as a platform to deliver drugs in pediatrics[8,9]due to its lack of toxicity and acceptability by children. Milk components have also been used as vehicles for active drug ingredients [10,11] and nutraceuticals[12]. Since milk is a universally accepted food and plays a key role in the development of neonates and infants[13], incorpora-tion of drugs in this matrix is likely to improve compliance to drug therapy.
This new perspective in pediatric drug delivery has prompted the development of a simple and sensitive analytical methodology for quantification of both theophylline and paracetamol in the complex matrix that milk represents. There are several published methods for determination of theophylline or paracetamol individually, or in combination with other drugs, in different matrices, but there is a lack of similar studies involving quantification of paracetamol or theophyl-line in powdered or fresh milk and none, to our knowledge, involves
http://dx.doi.org/10.1016/j.jpha.2017.07.005
Received 16 February 2017; Received in revised form 10 July 2017; Accepted 12 July 2017 Peer review under responsibility of Xi'an Jiaotong University.
⁎Corresponding author.
E-mail address:[email protected](A.I. Fernandes).
Available online 13 July 2017
2095-1779/ © 2017 Xi'an Jiaotong University. Production and hosting by Elsevier B.V. This is an open access article under the CC BY-NC-ND license (http://creativecommons.org/licenses/BY-NC-ND/4.0/).
quantification of these drugs in milk-based dosage forms. Just to name a few works, theophylline was quantified by high-performance liquid chromatography (HPLC) in urine, saliva and plasma samples [14] alone and, in combination with etophylline, in human plasma [15], breast milk[16,17] and tablets[18]; paracetamol was quantified by UV–Vis and HPLC in tablets [19–22] and biological fluids [23]. Reports of HPLC drug determinations as residues in breast milk were found for several drugs[24], including paracetamol and theophylline [17], but those methods require extensive pretreatment of samples to remove matrix interference.
The aim of this work was to develop a HPLC method accepted by health authorities (i.e. complying with ICH guidelines), and easily performed by users (e.g. pharmaceutical industries), to quantify theophylline and paracetamol, both in solid or liquid milk-based dosage forms, intended for pediatric use.
2. Materials and methods
2.1. Raw materials and reagents
Fresh (Mimosa, Lactogal Produtos Alimentares S.A., Porto, Portugal) and powdered (Nido®, Nestlé Portugal, Oeiras, Portugal) commercial milk were purchased from a high street market. Paracetamol was supplied by Lusifar (Lisbon, Portugal) and theophyl-line by Sigma-Aldrich (Munich, Germany). Sodium croscarmellose (Ac-Di-Sol®, FMC BioPolymer, Philadelphia, USA),
D-mannitol (Carlo Erba,
Cornaredo, Italy) and magnesium stearate (Sigma-Aldrich, Munich, Germany) were used. Ammonium acetate (Merck, Darmstadt, Germany) and p-aminobenzoic acid (PABA) were of analytical grade (≥99% purity), and methanol and acetonitrile were of HPLC grade (Sigma-Aldrich, Munich, Germany). Ultrapure water (18.2 MΩ·cm), obtained with a Milli-Q system (Merck Millipore, Bedford, USA), was used throughout the study.
2.2. Equipment and chromatographic conditions
Chromatographic separation of paracetamol and theophylline was performed at room temperature (23 °C) in a Merck®-Hitachi Lachrome liquid chromatography system (Darmstadt, Germany) equipped with a L-7400 UV–VIS detector, a quaternary pump, a manual injector
Rheodyne 7750i and a data system (D-7000 HSM software). A Merck®analytical Purospher C
18 column (250 mm × 4 mm internal diameter; particle size 5 µm) and a Purospher C18pre-column (4 mm × 4 mm internal diameter; particle size 5 µm) were used. PABA was included in every sample as an internal standard (IS). Chromatography was carried out under isocratic conditions with a mobile phase consisting of a mixture of ammonium acetate buffer-acetonitrile-methanol (pH 6.0; 10 mM; 90:5:5, v/v/v), pumped at a 1 mL/min flow rate. Analytes were quantified at 272 nm (theophylline) and 243 nm (paracetamol) and the run time of the assay was 13 min. A 20 µL injection volume was used for each analytical run; true triplicate samples were considered and each was injected in triplicate.
2.3. Preparation of stock solutions, calibration standards and quality control samples
Stock solutions of theophylline or paracetamol (1000 µg/mL) and PABA (100 µg/mL) were prepared in ultrapure water. The calibration solutions were prepared by diluting the drug stock solution with appropriate quantities of sample matrix (water:milk; 90:10,v/v), to obtain standard solutions with concentrations of 0.2, 0.5, 1, 2.5, 10, 20, 25, 50 and 75μg/mL. In preliminary tests, different calibration curves were constructed using milk containing different fat contents (high−HFM; medium−MFM; low−LFM), as described before. Since
the milk fat content did not interfere with the assay (data not shown) fat milk was used thereof to prepare the calibration solutions of the
developing method. PABAfinal concentration in calibration solutions was 5μg/mL. The quality control samples were prepared by dissolving the appropriate amount of drug in a 90:10 mixture of water: milk (90:10, v/v), at concentrations of the lower limit of quantification (LLOQ=0.2 μg/mL), low (0.5 µg/mL), medium (5 µg/mL), high (25 µg/mL) and upper limit of quantification (ULOQ=75μg/mL) for both theophylline and paracetamol.
2.4. Preparation of milk-based dosage forms containing theophylline or paracetamol
To reproduce the milk matrices in which theophylline and/or paracetamol were to be quantified, solid dosage forms (powders and minitablets containing known amounts of the model drugs;Table 1) intended for pediatric use were initially produced respectively from fresh and powdered commercial milk. In short, theophylline was dispersed in fresh milk with different fat contents (low, medium and high) to attain different concentrations and the resulting mixtures were spray-dried to obtain powders. Spray-drying was performed in a Mini Spray-Dryer B-191 (Büchi Labortechik GmbH, Flawil, Switzerland), using a feed liquid rate of 4 mL/min (i.e. 20%) and an atomizing air rate of 600 L/h, at a 3 bar atomizing pressure and a constant aspiration airflow rate of 100%, as previously described[8]. Minitablets (2.5 mm diameter) were obtained from mixtures of powdered milk (whole fat) and paracetamol in different proportions (mannitol, sodium croscar-mellose and magnesium stearate were used as excipients) and pro-duced by direct compression in a mechanical press (LR 50 K, Lloyds Instruments, Leicester, UK) at 178 GPa, as described elsewhere [9]. Five different batches of both spray-dried powders and minitablets were prepared and stored, at room temperature (23 ± 1 °C) and 65% relative humidity, until further use.
2.5. Sample preparation
Pharmaceutical samples, i.e. powders containing theophylline and minitablets containing paracetamol, were used as model milk matrices for drug quantification. Just prior to analysis the dosage forms were suspended/dissolved by vortexing in ultrapure water (10 mL). After dilution, drug concentration in samples was expected to range from 0 to 47.6μg/mL for powders and from 0 to 50.9μg/mL for minitablets. Fresh milk and drug-milk solutions (0.1 mL) were used respectively as negative and positive controls, and diluted with ultrapure water to a final concentration within the linear range of the method. PABAfinal concentration in calibration solutions was 5μg/mL. The mixtures, prepared in triplicate, were then centrifuged (2000 rpm for 10 min) and 20 µL of the supernatant was injected and analyzed in triplicate.
2.6. Analytical method validation
The proposed HPLC method was validated according to the Table 1
Quantification of theophylline in spray-dried milk powders and paracetamol in milk-based minitablets.
Drug Amount expected (mg/g) Amount found (mg/g) CV (%)
Theophylline 0 0.00 0.0
200 200.98 3.1
450 451.12 1.9
780 780.82 1.5
Paracetamol 0 0.00 0.0
160 159.91 2.6
400 400.85 1.8
640 640.76 1.6
International Conference on Harmonization of Technical Requirements for Registration of Pharmaceuticals for Human Use (ICH) Q2(R1) guideline [25], with respect to specificity, linearity, accuracy, precision, limit of detection (LOD) and LOQ and robustness. Linearity was assessed by plotting the peak area ratios of the drug/ IS against the corresponding drug concentration (ranging from 0.2μg/ mL to 75μg/mL). Calibration curves were based on nine standards quantified in triplicate and generated by least-squares linear regression analysis.
Accuracy and precision were evaluated by repeated analysis of theophylline and paracetamol in milk. Intra-day and inter-day preci-sion was assessed by variation studies, in repeated analysis (n=6) of control samples atfive concentrations levels, LLOQ (0.2 µg/mL), low (0.5 µg/mL), medium (5 µg/mL), high (25 µg/mL) and ULOQ (75 µg/ mL), for both drugs, on the same day and on separate days. The accuracy (recovery test) was determined as the percentage of deviation between nominal and measured concentrations of the analytes (n=6) at the samefive concentrations. The mean peak areas of the milk control samples spiked with known amounts of each drug were compared with the accepted true values (the known drug concentrations), taken as corresponding to 100% recovery. The overall precision was expressed as coefficient of variation (CV, %) and the accuracy of the method as recovery rate (RR, %).
Specificity was ascertained from analysis of chromatograms ob-tained with milk (control) and milk samples containing both drugs. Analytical interference from milk components was investigated in whole fat reconstituted powdered milk and in fresh milk with three fat concentrations (LFM, MFM and HFM).
The LOD was measured as the signal-to-noise ratio of 3:1 and the LLOQ was determined as three times the LOD. The LLOQ was validated by repeated analysis of samples (n=5) prepared at the quantitation limit and the maximum acceptable deviation was set at 10%.
Robustness was evaluated by changing key method parameters such as temperature (25 °C and 30 °C) and pH (5.5, 6.0, 6.5) and monitoring for substantial changes in retention, resolution, and peak shape.
3. Results and discussion
The establishment of an efficient method for quantitation of paracetamol and theophylline in milk-based dosage forms was para-mount for the development of these novel way of delivering drugs to children [8,9]. Conventional analytical techniques described in the literature such as UV–Vis spectrophotometry [19–21] proved to be inappropriate because of the difficulty to attain reliable and reprodu-cible results, due to interference of the milk matrix, and more sensitive HPLC methods described in the literature were tried instead[26,27]. However, these methods required a complicated and time-consuming precipitation of milk proteins prior to injection, with a significant loss (20%–41%) of the analytes. To obviate these problems, the method
herein described was adapted from the work of Nirogi et al.[15]. Initial chromatographic conditions were chosen considering the availability of columns and the chemical properties of the drugs. A pre-column was included to minimize interference from milk components and extend the life of the column, since sample preparation did not involve the usual protein precipitation. The mobile phase solvent strength and pH were adjusted to obtain a satisfactory quantification with minimal time of analysis.
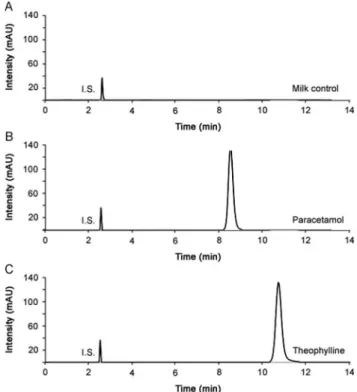
In fact, the main significant advantage of the present method is the simplicity of the sample preparation since measurements are made directly on the liquid (or solid upon dilution or suspension in water) samples. Another advantage is the relatively short run time (13 min) of the analysis, under isocratic conditions; retention times for paraceta-mol and theophylline were respectively 8.4 and 10.8 min (Fig. 1). To note that the reported run time is the sum of the run time in the column and in the pre-column, the retention time would be about
4 min shorter (as ascertained in previous experiments performed without pre-column, data not shown) if the pre-column was not used. It is challenging to compare the HPLC retention times of theophyl-line and paracetamol with other published works since different methods and/or matrices were used. As discussed in the Introduction, in the literature we either find HPLC methods for quantification of paracetamol or theophylline in simple matrixes, or in human milk, as residues. Some works do not state retention times at all [16,19–23] and others report shorter (between 5 and 6.6 min) retention times for theophylline[14,15,18]. Paracetamol and theophyl-line residues, quantified in breast milk, presented retention times of 9 and 18 min [17], respectively, which are comparable to our work (paracetamol), or much higher (theophylline). Again, direct compar-ison of results is precluded since Maithili et al.[17]did not use a pre-column, but rather precipitated milk proteins to avoid interference of the matrix.
To prove that the method was adequate for the intended use (assay of drugs in dosage forms developed for pediatric use), as required by regulatory agencies at certain stages of the drug approval process, it was validated according to ICH Q2 (R1) guideline[25].
3.1. Linearity
Linearity of the method was established from calibration curves of the standard solutions. Both calibration curves (9 points) for theophyl-line and paracetamol were constructed ranging from 0.2μg/mL to 75μg/mL. The peak area ratios of the drug/IS were plotted against the corresponding drug concentration. The mean linear regression equa-tion of calibraequa-tion curve for theophylline was y=0.5927x+0.0041 and y=1.0568x+0.4618 for paracetamol, where y is the peak area ratio of the analyte to the IS and x is the concentration of the analyte. Calibration curves, generated using least-squares linear regression analysis, were linear over the tested range, with squared correlation coefficients (r2) of 0.999. The concentration of drugs in the pharma-ceutical samples and controls were calculated (Table 1) from the resulting equations.
3.2. Accuracy and precision
The average percentage recovery, calculated by comparing the mean peak area of five control solutions (LLOQ, low, medium and high, ULOQ) with their nominal concentrations, varied from 97.3% to 105.1% (mean between-batch variation 99.7%) with the CV ranging from 2.6% to 8.2% (Table 2). These results indicate a high recovery efficiency, repeatability and intermediate precision.
3.3. Suitability
The suitability of the method was evaluated for the quantitation of the model drugs in five different batches of solid dosage forms produced in-house. For theophylline samples, different fat contents in the matrix were tested. Since the amount of fat in the milk matrix did not significantly affect the recovery results, only data obtained with samples produced with high fat milk are presented inTable 1. Drug concentrations determined in the dosage forms considered were also in agreement with the nominal values, with CV within 3.1%, thus confirming the high recovery of the method.
3.4. Sensitivity
The LOD, defined as the concentration giving a 3:1 signal-to-noise, was 0.067μg/mL and the LLOQ, considered in this work as the lowest concentration standard admitting acceptable accuracy and precision, was 0.2μg/mL for both drugs. Depending on the method and matrix considered, the limit of quantification (LOQ) reported for theophylline ranges from 0.1μg/mL [15] to 6.0μg/mL [18] and for paracetamol from 0.26μg/mL[19]to 20μg/mL [20]. These results, as discussed before, are, however, not directly comparable with ours. The LOD and LOQ for paracetamol and theophylline residues present in breast milk (the most similar matrix to that of the present work), have not been reported[17].
3.5. Specificity
Specificity was investigated to determine if milk components (or other excipients in the case of minitablets) interfered with the analytes or the IS. Specificity was confirmed from the chromatograms (Fig. 1) of blank fresh milk and milk spiked with either of the analytes. The method was capable of accurately measuring the concentration of both drugs without interference from milk components, regardless of the presence of milk proteins and the milk fat content. No interfering peaks or additional matrix effects were observed, probably due to the great sample dilution and centrifugation, combined with the use of a pre-column in the HPLC system.
3.6. Robustness
Deliberate small changes (pH, temperature) in HPLC analytical parameters did not lead to significant changes in retention time values, percentage of recovery and area, or symmetry of the peaks of both drugs. The method is thus robust and expected to be reliable during normal usage.
4. Conclusions
In this work, a sensitive, selective, accurate, precise and inexpensive HPLC method for determination of paracetamol and theophylline in fresh and powdered milk was validated. In fact, it was possible to accurately measure the drugs, without interference from components of the complex milk matrix, with minor sample handling. Moreover, the method was successfully applied to the quantification of the drugs, in the milk-based solid dosage forms considered.
The method can thus be applied to the pharmaceutical develop-ment, production and quality control of milk-containing dosage forms for pediatric use. Furthermore, the quantification of residues of the same drugs in the milk of breast-feeding mothers and livestock, with potential application both in the pharmaceutical and food industries, should also be possible, provided the necessary adjustments are made.
Conflicts of interest
The authors declare that there are no conflicts of interest.
Acknowledgments
The authors gratefully acknowledge thefinancial support provided by Fundação para a Ciência e a Tecnologia, Portugal (PTDC/DTP-FTO/ 1057/2012).
References
[1] P.J. Barnes, Theophylline, Am. J. Respir. Crit. Care Med. 188 (2013) 901–906. [2] World Health Organization (WHO), Model list of essential medicines for children,
5th, 2015.
[3] Food and Agriculture Organization (FAO), Residue evaluation of certain veterinary drugs - Joint FAO/WHO Expert Committee on Food Additives, 78th Meeting, 2014.
[4] European Medicines Agency (EMA) Guideline, Reflection paper: Formulation of choice for the paediatric population (EMEA/CHMP/PEG/194810/2005), 2006. [5] World Health Organization (WHO), Promoting safety of medicines for children,
2007.
[6] H.G. Kristensen, WHO guideline development of paediatric medicines: points to consider in pharmaceutical development, Int. J. Pharm. 435 (2012) 132–134. [7] A.A. Ali, N.A. Charoo, D.B. Abdallah, Pediatric drug development: formulation
considerations, Drug Dev. Ind. Pharm. 40 (2014) 1283–1299.
[8] J.T. Pinto, M.I. Brachkova, A.I. Fernandes, et al., Evaluation of the ability of powdered milk to produce minitablets containing paracetamol for the paediatric Table 2
Intra-day and inter-day accuracy and precision of the method for the determination of theophylline and paracetamol in milk (n=6).
Drug Expected Intra-day Inter-day
Conc. (μg/mL) Mean measured Precision Accuracy Mean measured Precision Accuracy
Conc. (CV,%) (RR,%) Conc. (CV,%) (RR,%)
(μg/mL) (μg/mL)
Theophylline 0.20 0.21 5.5 101.2 0.22 8.2 102.3
0.50 0.49 4.3 98.7 0.51 7.2 98.1
5.00 5.05 3.9 99.8 5.18 5.9 98.9
25.00 25.31 2.6 100.1 26.15 7.2 100.6
75.00 75.07 2.8 99.6 75.12 6.1 99.1
Paracetamol 0.20 0.19 4.2 97.3 0.23 7.8 105.1
0.50 0.52 2.8 97.9 0.51 7.5 98.5
5.00 5.09 2.9 98.8 5.11 5.8 100.2
25.00 25.50 5.6 99.6 25.19 6.3 99.5
population, Chem. Eng. Res. Des. 110 (2016) 171–182.
[9]J.P. Aguiar, T.A.P. Fernandes, C. Nese, et al., Production and characterization of spray-dried theophylline powders prepared from fresh milk for potential use in paediatrics, J. Pharm. Pharmacol. 69 (2017) 554–566.
[10] Y.D. Livney, Milk proteins as vehicles for bioactives, Curr. Opin. Colloid Interface Sci. 15 (2010) 73–83.
[11] T. Turovsky, R. Khalfin, S. Kababya, et al., Celecoxib encapsulation inβ-casein micelles: structure, interactions and conformation, Langmuir 31 (2015) 7183–7192.
[12] E. Semo, E. Kesselman, D. Danino, et al., Casein micelle as a natural nano-capsular vehicle for nutraceuticals, Food Hydrocoll. 21 (2007) 936–942.
[13] J.D. Carver, Advances in nutritional modifications of infant formulas, Am. J. Clin. Nutr. 77 (2003) 1550–1554.
[14] G.Ş.M. Charehsaz, A. Gürbay, A. Aydin, Simple, fast and reliable liquid chroma-tographic and spectrophotometric methods for the determination of theophylline in urine, saliva and plasma samples, Iran J. Pharm. Res. 13 (2014) 431–439. [15] R.V.S. Nirogi, V.N. Kandikere, M. Shukla, et al., A simple and rapid HPLC/UV
method for the simultaneous quantification of theophylline and etofylline in human plasma, J. Chromatogr. B Anal. Technol. Biomed. Life Sci. 848 (2007) 271–276. [16] J. Blanchard, C.W. Weber, L.E. Shearer, HPLC analysis of methylxanthines in
human breast milk, J. Chromatogr. Sci. 28 (1990) 640–642.
[17] V.S.T. Maithili, A. Athavale, A. Maitra, et al., Development of an in vitro cell culture model to study milk to plasma ratios of therapeutic drugs, Indian J. Pharmacol. 45 (2013) 325–329.
[18] V. Venkatesh, A.E. Prabahar, P.V. Suresh, et al., A new RP-HPLC method for simultaneous estimation of etophylline and theophylline in tablets, Res. J. Pharm.
Technol. 4 (2011) 128–130.
[19] M.S. Kondawar, R.R. Shah, J.J. Waghmare, et al., UV spectrophotometric estima-tion of paracetamol and lornoxicam in bulk drug and tablet dosage form using multi-wavelength method, Int. J. PharmTech Res. 3 (2011) 1603–1608. [20] V.C. Sebben, R.D.W. Lugoch, C.S. Schlinker, et al., Analytical methodology
validation and stability study for serum quantification of acetaminophen, J. Bras. Patol. Med. Lab. 46 (2010) 143–148.
[21] R.R. Shrestha, B.R. Pradhananga, Spectrophotometric method for the determina-tion of paracetamol, J. Nepal. Chem. Soc. 24 (2009) 39–44.
[22] S. Behera, S. Ghanty, F. Ahmad, et al., UV–Visible spectrophotometric method development and validation of assay of paracetamol tablet formulation, J. Anal. Bioanal. Tech. 3 (2012) 1–6.
[23] C.M.J. Berlin, S.J. Yaffe, M. Ragni, Disposition of acetaminophen in milk, saliva, and plasma of lactating women, Pediatr. Pharmacol. 1 (1980) 135–141. [24] B.R. Lopes, J.C. Barreiro, Q.B. Cass, Bioanalytical challenge: a review of
environ-mental and pharmaceuticals contaminants in human milk, J. Pharm. Biomed. Anal. 130 (2016) 318–325.
[25] International Conference on Harmonization, ICH Topic Q2 (R1), Validation of Analytical Procedures : Text and Methodology, 2005.
[26] M. Zhang, G.A. Moore, S.J. Gardiner, et al., Determination of celecoxib in human plasma and breast milk by high-performance liquid chromatographic assay, J. Chromatogr. B Anal. Technol. Biomed. Life Sci. 830 (2006) 245–248. [27] P. Chandra, A.S. Rathore, S. Lohidasan, et al., Application of HPLC for the