Abstract
The planning stages of mining activities require many comprehensive and de-tailed analyses. Determining the correct orebody model is the irst stage and one of the most important. Three-dimensional solid modeling is one of the signiicant methods that can examine the position and shape of the ore deposit. Although there are many different types of mining software for determining a solid model, many users try to build geological models in the computer without knowing how these software pack-ages work. As researchers on the subject, we wanted to answer the question “How would we do it”. For this purpose, a system was developed for generating solid models using data obtained from boreholes. Obtaining this model in an AutoCAD environ-ment will be important for geologists and engineers. Developed programs were irst tested with virtual borehole data belonging to a virtual deposit. Then the real borehole data of a cement raw material site were successfully applied. This article allows read-ers not only to see a clear example of the programming approach to layered deposits but also to produce more complicated software in this context. Our study serves as a window to understanding the geological modeling process.
Keywords: geological modeling, orebody, AutoCAD solid model, SolidBox.
Ayten Eser
Research Assistant
Cukurova University - Mining Engineering Sarıçam, Adana - Turkey
Ahmet Dağ
Professor
Cukurova University - Mining Engineering Sarıçam, Adana – Turkey
Geological modeling
of a stratified deposit
with CAD-Based solid
model automation
Mining
Mineração
http://dx.doi.org/10.1590/0370-44672016700135
1. Introduction
Up until now ore deposits have often been modeled with different ap-proaches. Geostatistical modeling tech-niques give very successful results in this sense. However, the ore deposit’s ability to be deined in every sense depends on its ability to be represented as three dimensional beyond the reserve estima-tion. This issue will be solved partially by general computer-aided drawing systems (CADs) being available. Indeed, CAD applications have been used in pit design and planning processes for many years (Jiang, 1998). Solid models of geological structures are useful tools for engineers and geologists, especially by means of studies carried out in the modeling of geological features (faults, zone and ore deposits etc.) as they contribute to the improvement of ap-plications by probing them with many different approaches (Jiang, 1998; Wu and Xu, 2003; Wu et al., 2005; Web-ster and Oliver, 2007; Kaufmann and Martin, 2008; Calcagno et al., 2008;
Lloyd, 2011; Tutmez et al., 2012; Liu et al., 2013, Dağ and Özdemir, 2013; Lad and Rao, 2014; Marschallinger and Jandrisevits, 2015). The solid model ap-proach has entered into quite common modeling methods in parallel with de-velopments in recent years. Another rea-son is that there are so many program options to be used. When viewed from a larger perspective, the used program and modeling methods may differ, even if the solid modeling approach merges under a certain roof.
The purpose of this study was to improve a system that produces solid models to be used in the evaluation of mineral deposits effectively in the light of recent developments. In accordance with this purpose, a two-step package in Visual Basic language was prepared due to the multitude of data entry and user options to form a solid model. There is BlockCAD in the irst step of the system and with this program block data were obtained by
evaluat-ing a data file formed from three-dimensional borehole information. In the second step, a new program/macro was improved named SolidBox that can draw blocks from produced data. The program provides an opportunity to monitor the surfaces formed at the end of the triangulation process on the user form, as well as producing block data at the irst stage. The second stage of the system forms an exact model in an improved macro and AutoCAD en-vironment by spreading the block data to real space. The solid model formed at the end can be evaluated by taking advantage of all query tools provided by the drawing environment.
340
solid model with only one software program. We also tried to support the correctness of the solid model with
sections to prove the usability of the prepared system in all appropriate ields that may be encountered. Mistakes
that might occur were programmed to be monitored with the help of sections taken from the model.
2.2 Data file creation for AutoCAD
2.2.1 Triangulation method and surface modeling
A program has been developed toobtain the SolidBox model information drawn in the AutoCAD environment from borehole data. This program is called BlockCAD.
It is rather dificult to obtain com-plex data sets by classifying the simple borehole data taken randomly. Likewise,
arranging this data according to the intended purpose of another program requires a time-consuming series of op-erations. There is need for a set of values for box models to be drawn in the next stage. These values are Xcenter, Ycenter, Zcenter, and Height, Length and Width values for the box to be drawn. Large amounts of
data can be used. The only constraint on data size is the RAM capacity of the com-puter system used. The computational techniques used within the program will be explained in detail for the oncoming stages. At each stage, some data were arranged and/or formed for the follow-ing stage.
Triangulation creates surfaces by constructing triangles between borehole points and interpolating the surface from locations on the triangular mesh. The process of triangulation consists of determining the natural neighbors of successive points on a map. In particular, using triangulation to model 3D ore-bodies in the subsurface is recommended (Cauman et al., 2009; Liu et al., 2013). Even though there are different methods of forming these triangles, the basis of creating the triangulated surface from points or vertices is the same. (Zlatanova et al., 2004; Zlatanova, 2006;
Zlatano-va and Prosperi, 2006; Breunig and Zlatanova, 2011).
Two-dimensional values (X, Y) of each drilling are recognized as corner points of a triangle to be formed by drawing using the Delaunay Triangula-tion technique. This triangle is a triangle such that any drilling point will not fall. At the same time, this triangle is the tri-angle with the smallest area that can be formed when it is entered in combination with all points. When querying whether triangles possess these features or not in the Delaunay Triangulation technique, different mathematical processes are
taken advantage of. The clearest tech-nique is the process that interrogates the equation of a circle whose two dimen-sions are known and pass through three points (Utrecht University, 2014). With the help of this equation, it is possible to ix characteristics (center, diameter) of the circle in a two dimensional plane whose three points (P1, P2, P3) are given (Figure 1).
Two lines can be formed from these three points. The irst is a line passing from the irst two points (P1 and P2); another is line b passing from P2 and P3. The equation of these two lines:
2. Theory
2.1 Developed computer programs
The model developed to obtain a solid model of the mineral deposit about which borehole data is known in the AutoCAD environment consists of the following stages.• Obtaining the solid box model data that are required for AutoCAD
• Obtaining an AutoCAD ile in -cluding solid box models with developed VBA macro
• Obtaining the Solid Model by com -bining all solid boxes with AutoCAD tools • Examining the desired informa -tion from the obtained solid model with
AutoCAD tools
The irst two stages are performed with the two Visual Basic Application (VBA) programs developed. The program that performs the first stage is called BlockCAD and the macro that performs the second stage is SolidBox.
y
a= m
a( x - x
1) + y
1m
a= ( y
2- y
1)/( x
2- x
1)
m
a= ( y
3- y
2)/( x
3- x
2)
y
b= m
b( x - x
2) + y
2(1)
(3)
(5) (2)
(4)
(6) Where m is the slope of line given by the equation below:
The center of the circle is the inter-section of the two lines perpendicular to and passing through the midpoints
of the lines P1-P2 and P2-P3. The per-pendicular of a line with slope m has slope -1/m, thus equations of the lines
perpendicular to lines a and b and pass-ing through the midpoints of P1-P2 and P2-P3 are:
y
1a
= [-1/m
a(x-(x
1+x
2)/2)] + (y
1+y
2)/2
y
1These two lines intersect at the center and solving x gives:
x= [m
am
b(y
1-y
3)+m
b(x
1+x
3)-m
a(x
2+x
3)]/2(m
b– m
a)
(7)Figure 1 Circle in three points (Bourke, 1990).
The Y coordinate can be calculated by replacing one of the vertical lines with the X value. At this stage, by considering that all lines drawn from known points to the center are equal in diameter, the dis-tance between the center and these points can be easily calculated (Bourke, 1990).
The system primarily scans all points for each point and calculates cen-ter coordinates of all circles passed from the investigated point and another two points, after its radii. The location of other points is established by detecting the circle
with the smallest diameter by comparing formed circles and selected points. The circle detected in the last case is such a circle that it has only three points and there isn’t any point within the area of the circle.
The program repeats the same pro-cesses for all points and in the meantime, it can again use the triangle points that were deined before. One point can be the corner point of many triangles. At the same time, elements of a triangle can form elements of other triangle groups. However, it should not be forgotten that
three elements of a triangle cannot be in the same group. This logical error leads to the formation of more than one of the same triangles, forcing the program’s processing capacity and the creation of more objects in the last obtained drawings. To prevent this, the system deines the coordinate values of each of the triangle’s three corners that it deined as one group and assigns a variable. All features of these coordinates grouped by the variable are deined as the elements of a matrix that is named as that variable.
2.2.2 Gridding of field
The division of the ield into grids performs two important processes. Firstly, the grid system to be formed should pass from all deined points to use all elements of the obtained data from the ield com-pletely. Moreover, boundaries of the grid system play quite an important role be-cause the grid system’s intersections form the center of box models. When determin-ing the boundaries, maximum and mini-mum values on x and y coordinate axes are detected by scanning the coordinate values (X, Y) automatically. Second is the grid width’s selection that will affect the next stages of this program directly. When the program begins to work, it asks the user Width (W) and Length (L) values and these values are considered optionally by the user and intersections of drawn grids form one part of the box models’ center coordinates at the last stage. Obtained intersections deine center coordinates (Xcenter, Ycenter) of cubes that will form our main model.
The program irst inds the border (Xbox and Ybox) lengths from the differ-ence of coordinate values. During this process, it calculates how many boxes will be drawn using W and L value in-puts. Width (W) and Length (L) of the box are deined again using Xbox and Ybox numbers calculated at the irst stage. The division process here is made with high precision. Thus losses were prevented by providing numerical precision to an-ticipated W and L values while the box number remained stable. The program appoints all calculations after this stage to the current point coordinates.
After calculating all grid coordi-nates, the grid system was deined so that it takes the biggest and smallest values of drilling locations. At this stage, it detected whether each intersection was in deter-mined ields or not.
The logic that was used when the determination was made based on cal-culation of the three-sided polygon’s area
simply and the algorithm of this logic is based on the rules below:
• One point can only be in one tri -angle’s area.
• The sum of the intersection with the triangle’s areas formed between the points that were deined before can be equal to only one of the triangle areas deined before. In this case intersection is replaced within that triangle.
• Otherwise intersection is outside the triangle
More clearly, the program assigns new triangles from each point to each corner of the calculated triangles before.
It is accepted that points that pro-vide equality enter into the area of one triangle. The program investigates all triangular areas for all points and remain-ing points are determined. Durremain-ing the determination process, coordinates (x, y) of each point and the triangle’s indices that are in it are deined and recorded at the same time.
2.2.3. Value calculation of elevation
In previous sections, whether points in grid systems are in the formed triangle
surfaces or not was established. As seen in Figure 2a, all intersection points that
342
In this logic, the ability of any box to be drawn depends on the condition of being central within the area of the triangle. It is accepted that the coordinates of the point where they intersect this surface with a line passing from Z axes direction within the surface of a triangle whose corner points are known are (x, y, z).
Three dimensions (Xcenter, Ycenter and Z) of the box models’ center coordinates have been calculated by the program. But the main issue at this stage is inding which surface the “Z” value represents and the ability to be deined according to this. That the irst formed triangular surface has to deine the exit surface in
spite of its entry surface to the vein was accepted. In this case at least one series of Z enter (Zen) and Z exit (Zex) values should be calculated.
When considered within the frame-work of this logic, the program forms a level for each obtained depth value from drilling data and the triangular surface at each level (Figure 2b). At each level, the rays that were assumed to pass through were accepted as a projection of each point deined before. Points that intersect the surface of these rays are calculated as explained above and Zen (Z coordinate of entry of layer) and Zex (Z coordinate of exit of layer) values are assigned.
There are also points that intersect different numbers of triangular levels and come across the space between the points deined before (Figure 1b). For the prepared program to be usable in cases encountered with one or more intersec-tion, it was provided with the capacity to be able to calculate more than one Zen and Zex series.
At the end of the process, regular matrices belonging to each level, in other words triangle surfaces, are deined. It will even be possible to obtain real-like mathematical and visual data by classify-ing intersections, so intersections will be replaced within box models.
Figure 2
Triangle surface: a) Grid system, b) The ray passed vertically through at a point in the surface of layer.
(a) (b)
Xcenter, Ycenter, Zcenter, coordinate val-ues with length, width and height valval-ues belonging to each box must be known for box models that are planned to be formed in the last section of the program. Upper and lower surfaces of box models overlap with triangle surfaces formed before and levels where center rays passing from these surfaces are deined as Zen and Zex values.
Then, Zcenter is calculated from midpoint of Zen and Zex by the program.
After all stages, all data obtained by the program are recorded in “.txt” ile format and to this ile the block informa-tion that will form the solid model in the AutoCAD environment is written. Drilling information obtained from the ield con-sists of x and y coordinates and the cutting
depth of the vein. In this prepared program, data should be processed into “.txt” format ile with the sequential ile method. In the ile should be X and Y coordinates and Z elevation values of enter and exit from all layers (Zen and Zex) belonging to each borehole respectively. This information should be recorded in order to be available for different processes within program.
2.3 Building a solid model in the AutoCAD Environment
In this study, three dimensionalblocks are drawn using SolidBox data that were deined before with the help
of the Macro (SolidBox) developed with the Visual Basic editor in the AutoCAD drawing program. Each
block is formed easily using the Add-Box method (Sutphin, 2005) with the simple command below.
Set3DSolidObject=Object.AddBox(BoxCenter,Length,Width,Height)
The thing to be done after draw-ing the blocks that form the deposit’s solid model and combining them, is to investigate the model by taking advan-tage of all AutoCAD’s mathematical,
visual and digital query tools. The formed model can be perceived as a single solid object that can consist of more than one level. This body mass can be calculated. The section can be
taken from any points, and intersections can be followed. Because the processes appropriate to user requests are easily accessible, many stages of organization can be investigated.
3. Results
3.1 Testing with virtual borehole data
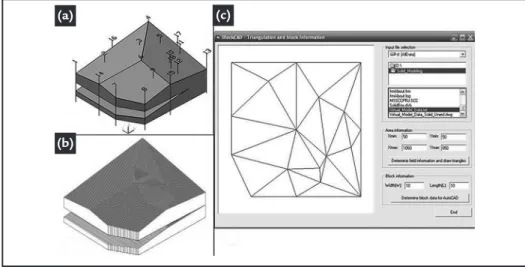
Developed programs and meth-odology were irst tested with virtual borehole data belonging to a virtual deposit, and then they were success-fully applied to real borehole data ofa cement raw material site. Figure 3a shows the AutoCAD 3D solid model of virtual ore deposit and 18 boreholes that are randomly scattered on the deposit and are constructed by
Auto-CAD. The 3D solid model was built using the programs and parameters (Figure 3b) on the basis of virtual borehole data (Figure 3c).
(a)
(b)
(c)
Figure 3 Program testing; a) AutoCAD solid model of virtual ore deposit and boreholes, b) The interface screen of the BlockCAD program and parame-ters, c) Constructed solid model of deposit
using BlockCAD and the virtual boreholes
The effect of drill-hole spacing on the correctness of the solid model to be produced is indisputable. Basically, if the drilling distance gets smaller, the model accuracy increases. It was found that in testing, when the number of boreholes is increased, the
generated solid models are very similar to the real solid model in terms of shape and numerical characteristics. The constituted solid is similar to the real solid in respect of mass properties (Table 1). The difference is very small between the real solid model and
the generated solid model. X and Y coordi-nates have tiny changes. Likewise, generated Z coordinates tend to be lower than the real Z coordinates. It was observed that all dif-ference values are less than 1%. The results are very acceptable for modeling techniques.
Real solid model
Generated from borehole
solid model Difference Difference % Volume(m3) 223186198 221454767 1,731,431.00 0.78
Bounding box: (m)
X 50.0 - 1050.0 50.0 - 1050.0 0 – 0 0 - 0 Y 50.0 - 850.0 50.0 - 850 0 – 0 0 - 0 Z 25.0 - 425.0 25.2 - 425.1 0.2 - 0.1 0.80 - 0.02 Centroid: (m)
X 611.7 610.6 1.1 0.18 Y 471.0 471.1 -0.1 -0.02 Z 216.3 215.9 0.4 0.18
Table 1 Mass properties displayed for two 3D solids.
3.2 Application Real Field
It is now clear that our programs work with virtual borehole data. Let us turn our attention to real borehole data. A cement raw material ield was chosen as the real application ield. The triangle process belonging to borehole locations in
this ield was made and the triangulated ield is shown in Figure 4. This was right after solid models that were formed in different block dimensions were obtained.
A model was formed by using the block dimensions of the 15 m units (Figure
4). Thin deposit features belonging to marl attract attention. Slopes of the layers are recognized. Surface elevation difference changes in the formed solid model can be understood from location forms of the current blocks.
344
Sectioning ease, which is one of the many advantages of the solid model approach, is also discussed there. This ad-vantage becomes more accessible thanks to system tools. But the most sensitive point of the section process is the suitability of loca-tion form where the secloca-tion will be taken. In this sense, the most appropriate section location is the regions where there are more changes. This is the reason for having a ield with a variable number of layers and thick-nesses. On the igure, N/S and E/W oriented sections can be seen. The aforementioned sections pass from marked lines.
The aforementioned obtained sections that pass from marked lines on Figure 5a are shown in Figure 4b and 4c. Sections show that there is no incorrect placement in terms of current ore location. No rupture was observed in internal parts of the layers.
Three layers observed at the northern end of the section were combined by getting thinner towards the middle sections of the ore body and becoming two layers (Figure 5b). This case reveals one of the advantages of the selected drawing environment and prepared program, as well as the fact that it is frequently encountered. As a result of this case, natural variables were presented by using combined data without loss. The aforementioned variability in the section was encountered in the eastern part of the deposit. As can be seen there, three layers become only one layer by combining (Figure 5c). This point can be made as a detailed image review, as well as a section examina-tion. It can be comparatively complicated at irst sight because it consists of smaller units visually, while it is more effective in showing the last model surface changes. By taking
advantage of the used system’s simplicity, focusing tools that were made before were used. In this manner, it can be continued in the region marked in red in the investigation of the ield’s solid model. The ield’s layers can be seen easily in this section of the re-lected model by getting close visions from the region marked in Figure 5a.
In particular, the slope, orientation and intersections of the layers can be se-lected easily. In the ield, three layers and two intercalations attract attention. The irst layer has quite thin deposits but just beneath comparatively thicker layers can be observed. Points of current intercala-tion thickness can be seen close to each other. Layer and intersection thickness can be assessed for investigation in detail. Mass properties of this solid are given in Table 2.
Figure 5
Obtained models
of Marl deposit; a) Solid model, b) A-A′ section c) B-B′ section.
Marl solid model Volume (m3) 17,596,625
Bounding box (m)
X 717773.2 - 719092.0 Y 4091880.0 - 4093381.0 Z -3.517 - 68.4355.0 Centroid: (m)
X 718559.3842 Y 4092648.3516 Z 40.4664
Table 2
Mass properties
of solid model of Marl deposit.
(a)
4. Discussion and conclusions
In this study, developed programs intended to obtain the solid model of a deposit in the AutoCAD environment, which is a widely used design program, were developed and all stages of the programs have been explained in de-tail. Programs were tested in a virtual deposit and sample ield and these two ields were modeled with the developed methodology. The sample field was observed with maximum three layers and different numbers of layers were determined from place to place. Layer slopes were monitored easily and pre-sented in detail. The system produces successful results even in a stratiied data environment.
Results of the obtained virtual deposit model indicate that the accuracy of the solid model depends on both large numbers and locations of boreholes. A more accurate model can be produced if the location of the borehole selected is on
the border exchange of the surface. Au-tomation of user-deined options can be provided by preparing the procedure for the process that will provide optimization of the aforementioned block dimensions.
The BlockCAD program produces the data ile in .txt format and the ability of this ile to be used in AutoCAD will only be possible with a SolidBox macro prepared. In this way the process time can be shortened with the program that can be produced by drawing the ile in dxf format instead of forming the drawing ile with a macro. But forming such a ile in dxf format is possible only by comparing thousands of codes to be obtained from the AutoCAD program.
In the program that was the subject of the study, the necessary block data for the solid model were obtained by three dimensional surface modeling only. Apart from this model, block data can also be obtained using geostatistical, inverse
distance, fuzzy logic and other modeling techniques. The package can be developed by adding the geostatistical estimation method as well as block geometry. Solid models are created using different meth-ods in mining software, such as with the aid of two surfaces or cross-sections of ore deposits. In this study, this was created by combining three-dimensional boxes obtained between the surfaces. One of the greatest advantages of our program is that as this solid model was produced from boxes using common commercial software, it can be interpolated with vari-ous estimation techniques.
Clearly, some of the propositions that we have offered are not entirely unique but they are simple sample steps to understanding how common geological modeling software works. Furthermore, we feel that our study enhances academic understanding of the programming ap-proaches for solid modeling.
Acknowledgment
The research reported in this paper was inancially supported in part by the
Scientiic Research Project Unit of Cuku-rova University (MMF2007YL12).
References
BOURKE, P. Equation of a circle from 3 points (2 dimensions). 1990 (unpublished). BREUNIG, M., ZLATANOVA, S. 3D geo-database research: retrospective and
futu-re difutu-rections. Computers & Geosciences, v.37, n.7, p.791-803, 2011.
CALCAGNO, P., CHILÈS, J. P., COURRIOUX, G GUILLEN, A. Geological mo-delling from ield data and geological knowledge-Part I. Momo-delling method cou-pling 3D potential-ield interpolation and geological rules. Physics of the Earth and Planetary Interiors, v.171, n.1, p.147-157, 2008.
CAUMON, COLLON-DROUAILLET, P., LE CARLIER DE VESLUD, C., VISEUR, S., SAUSSE, J. Surface-based 3D modeling of geological structures. Mathematical
Geosciences, 41, p. 927-945, 2009
DAG, A., OZDEMIR A.C. A comparative study for 3D surface modeling of coal deposit by spatial interpolation approaches. Resource Geology, 63, p.394, 2013. JIANG, Y. D. An interactive 3-D Mining Engineering. Canada: 1998. 213p. (The
Degree of Doctor of Philosophy).
KAUFMANN, O., MARTIN, T. 3D geological modelling from boreholes, cross--sections and geological maps, application over former natural gas storages in coal mines. Computers & Geosciences, v.34, n.3, p.278-290, 2008.
LAD, A., RAO, A.S. Design and drawing automation using solid works application programming interface. International Journal of Emerging Engineering Research and Technology, v.2, n.7, p.157-167, 2014.
LEMON, A.M., JONES N.L. Building solid models from boreholes and user-deined Cross-sections. Pergamon, Computers & Geosciences, 29, p.547-555, 2003. LIU, G., ZHAO, H., FU, E. Three-dimensional modeling of open-pit based on
autoCAD and its application. Applied Mechanics and Materials, p.275-277, 2624-2628, 2013.
LLOYD, C. D. Local models for spatial analysis. (2 nd. Ed.). Boca Raton: CRC Press, 2010. 352, 2010.
pro-346
Received: 13 September 2016 - Accepted: 30 March 2017.
gram for voxelizing AutoCAD solid models. Computers & Geosciences, p.74, 110-120, 2015.
SUTPHIN, J. AutoCAD 2006 VBA: a Programmer’s reference. New York: Springer--Verlag, 2005. p.743.
TUTMEZ, B., KAYMAK, U., TERCAN, A.E., LLOYD, CD. Evaluating geo--environmental variables using a clustering based areal model. Computers &
Geosciences, 43, p.34-41, 2012.
Utrecht University. Dept. of information and computing sciences, Delaunay Triangulations (http://www.cs.uu.nl/geobook/interpolation.pdf), 2014. Last visit: 12.12.2014.
WEBSTER, R., OLIVER M.A. Geostatistics for environmental scientists. (2nd Ed.). Chichester: John Wiley & Sons, 2007. p.330.
WU, Q., XU, H. An approach to computer modeling and visualization of geological faults in 3D. Computers & Geosciences, v.29, n.4, p.503-509, 2003.
WU, Q., XU, H., ZOU, X. An effective method for 3D geological modeling with mul-ti-source data integration. Computers & Geosciences, v.31, n.1, p.35-43, 2005. ZLATANOVA, S. 3D geometries in spatial DBMS. In: Innovations in 3D geo
information systems. Springer Berlin Heidelberg, p.1-14, 2006. p. 247.
ZLATANOVA, S., PROSPERI, D. 3D large scale data integration: challenges and opportunities. Boca Raton: CRC Press, Taylor & Francis Group, 2006.