A case study of rainfall-derived infiltration and inflow of a separate
sanitary sewer system
Nelson J. G. Carriço
1, Rita Brito
2, Manuel Baptista
11BarreiroSchool of Technology, Polytechnic Institute of Setubal, Rua Américo da Silva Marinho, 2839-001 Lavradio, Portugal 2National Laboratory of Civil Engineering, Avenida do Brasil, 101, 1700-066 Lisbon, Portugal
Correspondence to: Nelson J. G. Carriço ([email protected])
Abstract. Rainfall-deriver infiltration and inflow (RDII) can interfere with the performance of domestic wastewater drainage systems. It is also a major cause for the deterioration of the functional performance of those drainage systems and for the occurrence of untreated discharges of domestic wastewater to the water environment. In most cases, the actual size and location of these inflows are unknown. To assess this subject of the RDII, it is required to hold a detailed knowledge of the network and to do the diagnosis of the main problems, namely, the type of inflows, the magnitude of its occurrence and the places where the impacts are most relevant. This paper presents the application of an estimation methodology of RDII to a Portuguese case study.
1 Introduction
Separate sanitary sewer systems are designed to convey wastewater and stormwater in separate sewers. There are three major components of wastewater flow in a sanitary sewer system, base sanitary (or wastewater) flow, groundwater infiltration and rainfall-derived inflow and infiltration (RDII), more commonly referred to as inflow (EPA, 2014). This inflow may be considered excessive when the cost to transport and treat exceeds the cost to eliminate it. Often, excessive inflow is collected during rainfall via illicit connections from roof leaders, house drains, sump pumps, or storm sewers, as well as through defects in pipes and manholes (Harold, 2007). Sewers which are found connected from the storm drainage system must either be permanently plugged or disconnected and rerouted as soon as possible.
After a strong rainfall, performance of separate sanitary sewer systems may decrease significantly due inflows which can cause: an increase of operation and capital costs of sewers and wastewater treatment plants; a decrease of sewers capacity which potentiate non-treated wastewater discharges, and consequently increases pollution; occurrence of floods; etc. (Amorim et al., 2007)
appropriate actions to promote the gradual reduction of RDII in order to increase systems efficiency and effectiveness in economic, environmental and operational terms.
This paper presents the application to a real case study of an estimation methodology of RDII.
2 Methodology
RDII can be assessed in different ways, in this paper a two-step based methodology was adopted, namely i) hydraulic modelling and assessment and ii) calculation of performance indicators.
2.1 Hydraulic modelling and assessment
Hydraulic modelling can be used to analyse existing sewer collection systems, to identify potential problems, and to design best corrective solutions (Nicklow et al., 2004). There are several computer applications available in the market, commercial or free, that allow building hydraulic models.
In this paper, Storm Water Management Model (SWMM) from Environmental Protection Agency (EPA) was used to model the system hydraulic behaviour. SWMM is used throughout the world for planning, analysis and design related to stormwater runoff, combined and sanitary sewers, and other drainage systems in urban areas. Furthermore, SWMM is free to use and has a vast user community that participates intensely in forums and newsgroups.
The use of SWMM implies collecting several data such as sewers and manholes cadastral information, amount of sewage discharged per manhole and flow measurements. The amount of sewage discharged per manhole can be estimated from the product of population, per capita water use and ratio of water rejected to the sewer system. Flow measurement can be used to calibrate the hydraulic model. Furthermore, it is necessary to collect precipitation data measurement to investigate RDII in a separate sanitary sewer system.
The hydraulic model can be used for dry-weather flow and for contributing impervious area determination. The former is generally used to establish a dry-weather flow pattern from flowmeter data. The latter is used to quantify the amount of impervious area connected to the sewer pipes (Brito et al., 2009).
When facing a separate sewer system with unwanted stormwater sewer connections, the contributing impervious area is difficult to quantify. Being so, in such systems it may not be useful to accurately determine the real impervious areas. This would mean that the whole amount of net precipitation would drain to the pipes, which is of course not correct (Brito et al., 2009). The part of runoff that derives from the hydrological model could be determined considering that the rainfall volume (R-value) method calculates RDII volume as a fixed percentage of the rainfall amount. Based on the R-value method and the Rational Method, it is feasible to adopt an auxiliary parameter, contributing impervious area A’, suitable to estimate extraneous
2.2 Calculation of performance indicators
Performance Indicators (PIs) may be considered as providing key information needed to define the efficiency and effectiveness of the delivery of services. A PI may thus be used as a quantitative (or in some cases qualitative) measure of a particular aspect
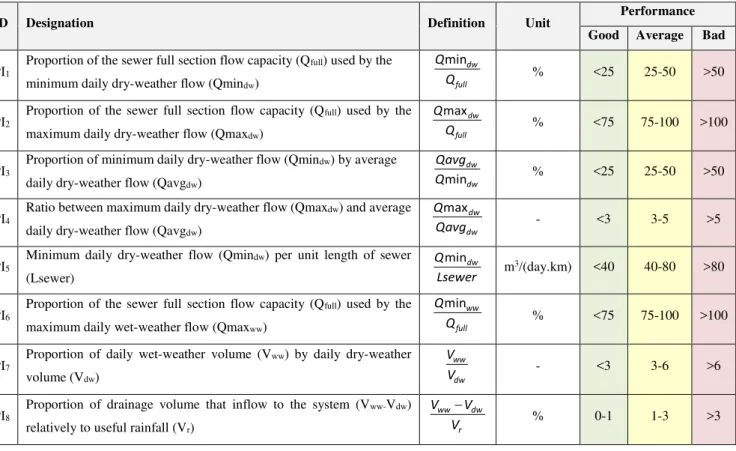
of an undertaking’s performance or standard of service (Matos et al., 2003). PIs are considered to be a means of aggregating information on system characteristics and data gathered from monitoring or modelling and translated into performance values (Cardoso and Frehmann, 2010). PIs can be classified in relation to “good” or “bad” performance. Table 1 shows the Performance Indicators for RDII used in this paper.
Table 1 - Performance Indicators for RDII
ID Designation Definition Unit Performance
Good Average Bad
PI1
Proportion of the sewer full section flow capacity (Qfull) used by the
minimum daily dry-weather flow (Qmindw) full
dw
Q Qmin
% <25 25-50 >50
PI2
Proportion of the sewer full section flow capacity (Qfull) used by the
maximum daily dry-weather flow (Qmaxdw) full
dw
Q
Qmax
% <75 75-100 >100
PI3
Proportion of minimum daily dry-weather flow (Qmindw) by average
daily dry-weather flow (Qavgdw) dw
dw
Q Qavg
min % <25 25-50 >50
PI4
Ratio between maximum daily dry-weather flow (Qmaxdw) and average
daily dry-weather flow (Qavgdw) dw
dw
Qavg
Qmax
- <3 3-5 >5
PI5
Minimum daily dry-weather flow (Qmindw) per unit length of sewer
(Lsewer) Lsewer
Qmindw
m3/(day.km) <40 40-80 >80
PI6
Proportion of the sewer full section flow capacity (Qfull) used by the
maximum daily wet-weather flow (Qmaxww) full
ww
Q Qmin
% <75 75-100 >100
PI7
Proportion of daily wet-weather volume (Vww) by daily dry-weather
volume (Vdw) dw
ww
V V
- <3 3-6 >6
PI8
Proportion of drainage volume that inflow to the system (Vww-Vdw)
relatively to useful rainfall (Vr) r
dw ww
V V
V
% 0-1 1-3 >3
3 Case study
3.1 System description
minimum diameter allowed by the Portuguese design codes). The system has a pump that raises wastewater from a lower to a higher elevation of the network. At the final end of the system there is a flowmeter that measures the amount of wastewater delivered by Municipality to a public company that will convey it to the wastewater treatment plant. A study made by Municipality concluded that the total amount of potable water sold in the urban catchment of the case study was lower in about 56% than the wastewater delivered to the company for treatment. This is a huge difference that can only be explained by some kind of RDII.
From a hydrogeological point of view, Portugal is a favoured country and major groundwater unit of the Iberian Peninsula is the huge Tagus-Sado aquifer system. Despite the case study is located above the Tagus-Sado aquifer system in a first approach, groundwater infiltration is neglected and the study will focus only the inflow component.
3.2 Flow and precipitation data
The flowmeter installed at the final end of the system is used to measure the amount of wastewater delivered by the Municipality to the company that manages the wastewater treatment plant (WWTP). The provided flow data are for a period of 181 days (from 5th June 2014 to 2nd December 2014), and have a time step of 15 minutes. This time step is not the most suitable to allow a comparative analysis with precipitation data, once this events have a high variability in periods of 15 minutes.
Precipitation data were obtained from a temporary rain gauge installed in the neighbouring Municipality. Despite the rain gauge is not located in the catchment area is the only where is possible to obtain data with a time step smaller than 1 hour. The provided precipitation data are for a period of 1 year (from 3rd February 2014 to 4th February 2015).
The annual climatologic bulletins of 2014 and 2015 from the Portuguese atmospheric and ocean institute evidence that 2014 was the rainiest year of the last 25 years and 2015 was the sixth dryer year since 1931 and the fourth from 2000, respectively. Since flow data refers only to the second half of 2014, the analysis will merely focus on this period.
3.3 Hydraulic modelling
The hydraulic model was built considering a drawing provided by the Municipality which included cadastral information from the sewers and manholes. Since some data were inexistent (e.g. sewer without diameter) or were wrongly attributed (e.g. sewer with negative slope) it was rectified with the Municipality. The Portuguese design code has several criteria to be checked such as maximum length between manholes (Lmax), minimum sewer diameter (DNmin), minimum and maximum slope (imin and imax,
respectively) and minimum depth (hmin). Table 2 shows the percentage of sewers in default by design criteria.
Table 2 – Percentage of sewers in default by design criteria
Design criteria Lmax DNmin imin imax hmin
The amount of sewage discharged per manhole is estimated considering population, per capita water use and ratio of water rejected to the sewer system. According to the Portuguese Census in the urban catchment resident population were of 4,018 inhabitants in 2011. So, dividing the flow measured in 181 days (i.e. 143,647.4 m3) by resident population we obtain a per
capita sewage generated of 197 L/(inhabitant.day). This value is considered higher than others estimated from a Municipality study. The study shows that water consumptions for 2008 and 2012 were of 193,260.5 m3 and 160,688.6 m3, respectively.
Thus, per capita water use is of 132 and 110 L/(inhabitant.day), respectively. The Portuguese design code refers for design purposes the quantity of sewage generated is about of 80% of quantity of water use. Therefore, the per capita sewage generated is about 105 L/(inhabitant.day) for 2008 and 88 L/(inhabitant.day) for 2012. So a value of 100 L/(inhabitant.day) was considered corresponding to an average flow rate of 4,65 L/s.
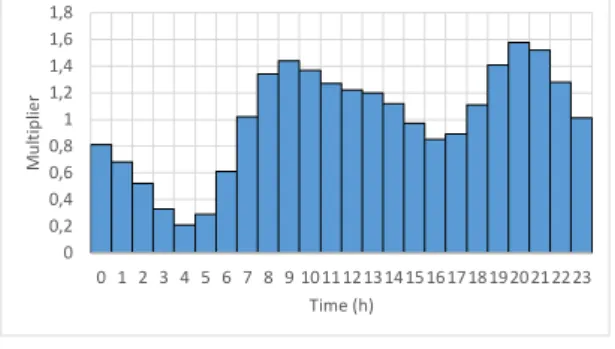
The dryweather inflows were obtain considering the contribution from sanitary sewage in sewer systems which are represented by the average inflow rate of 4,65 L/s adjusted on an hourly basis by applying the time pattern multipliers shown in Figure 1.
Figure 1- Hourly dry-weather inflows pattern
The pumping station installed at the system has circa 20 years old and has two pumps, one of service and the other of emergency. These pumps are installed in a wet well, are of vertical axis centrifugal type and were designed for a flow rate of 20.3 m3/hr. This pumping station was modelled with a storage tank connected to a pump. The pump curve type chosen was
type 4 because the flow varies continuously with inlet node depth. Two control rules were implemented, the first starts the pump when water depth in wet well is higher than 0.5 m and the second stops the pump when water depth is lower than 0.5 m. After model calibration of the dry-weather scenario is necessary to assess network behaviour during a rainfall event. Therefore, subcatchments should be added and characterized. Simulation models require the definition of the subcatchment’s impervious area, and assume that all this area is about to contribute to pipe flow. For the case study were considered three different contributing impervious areas (A1’=16%, A2’=27% and A3’=38%) in three rainy days (10 of September of 2014, 12 and 13 of
October of 2014) resulting in nine different scenarios.
3.4 Performance indicators
To compute performance indicators, the most upstream sewers without flow were not considered in both simulations (i.e. dry weather and wet-weather), since this is a consequence of the simplification made to the manhole that receives inflows from the buildings. Some of the results obtained by PIs calculation are shown in Figure 2.
0 0,2 0,4 0,6 0,8 1 1,2 1,4 1,6 1,8
0 1 2 3 4 5 6 7 8 9 10 11 12 13 14 15 16 17 18 19 20 21 22 23
M
u
lt
ip
li
e
r
(a) (b) (c)
Legend
PI1
0,000000 - 25,000000 25,000001 - 50,000000 50,000001 - 75,000000
Legend
PI2
0,012105 - 75,000000 75,000001 - 100,000000 100,000001 - 11120,453538
Legend
PI3
0,724638 - 25,000000 25,000001 - 50,000000 50,000001 - 100,000000 Null
(d) (e) (f)
Legend
PI5
0,031858 - 40,000000 40,000001 - 80,000000 80,000001 - 120,000000 Null
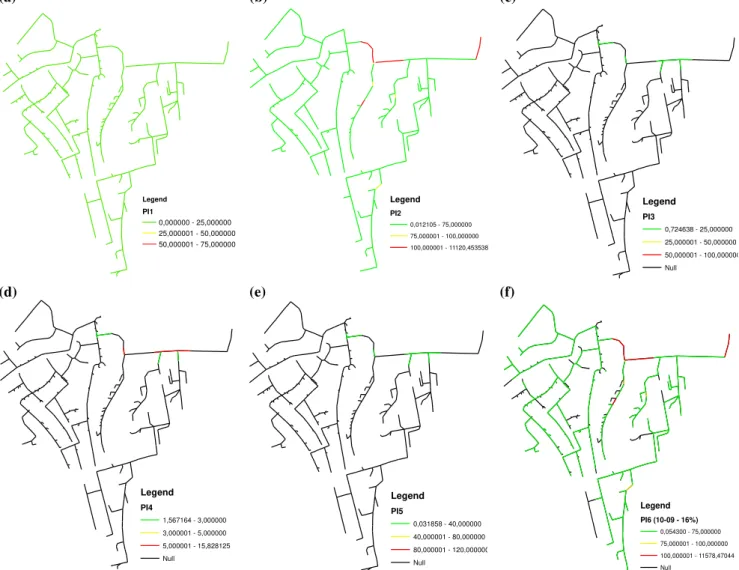
Figure 2 - Performance Indicators for RDII: (a) PI1; (b) PI2; (c) PI3; (d) PI4; (e) PI5; (f) PI6 for 10-09 and A1’=16% scenario
Figure 2 (a) shows that all sewers in the network are below 25% which means a good performance in PI1.
In the case of PI2 nine sewers have a value exceeding 100% which means bad performance in this indicator. Only two of the nine sewers are within the regulatory slope and three of them have very constrained sections. Most of the sewers (i.e. 295) present a good performance and 4 present an average performance in indicator PI2 (see Figure 2b).
The indicator PI3 only was computed for the sewers immediately downstream of the subcatchments. As shown in Figure 2 (c)
all sewers present an indicator below 25% which represents a good performance.
PI4 represents the ratio between maximum daily dry-weather flow and average daily dry-weather flow and can be associated
to a peak factor. The Portuguese design code has an article which says that for wastewater drainage systems the peak factor is the ratio between maximum flow rate and the annual average flow of domestic wastewater being influenced by water consumption, the number of connections and the median time that sewage stays in the sewer and can be determined by Eq. (1):
Legend
PI4
1,567164 - 3,000000 3,000001 - 5,000000 5,000001 - 15,828125 Null
Legend
�� = 1,5 + 600,5 (1)
In which fp = peak factor and pop = number of inhabitants served by the wastewater drainage system. Table 3 shows the results obtained for the five subcatchments considered in the case study,
Table 3 – Results of fp and PI4 obtained
Subcatchment Pop
(inhabitants) fp
(-) PI4
(-)
SC1 378 4,6 1,58
SC2 402 4,5 1,58
SC3 234 5,4 15,54
SC4 456 4,3 12,04
SC5 2208 2,8 5,07
It appears that there is no direct relation between these two parameters neither in terms of magnitude nor the proportion of PI4
with the contributing population. This observation suggests the existence of other uses in addition to the domestic uses. Like PI3, this indicator was computed for the sewers at the downstream end of the subcatchments. Figure 2 (d) shows that two
sewers present good performance and the other three have bad performance.
In PI5, the results obtained for the upstream sections of subcatchments give values below 40 m3/(day.km) which means a good
performance. The lowest value obtained in PI5 was 0.31 m3/(day.km) and the highest was 1.31 m3/(day.km).
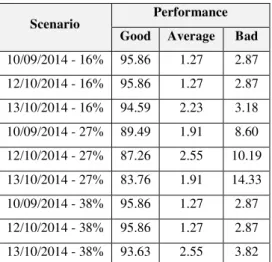
PI6 is computed for all sewers, except for those where flow is null (see Figure 2 f), for the three different contributing impervious areas (A1’=16%, A2’=27% and A3’=38%) and for the three rainy days considered. Table 4 shows the percentage
of sewers by performance level obtained by calculating PI6.
Table 4 – Percentage of sewers by performance level in PI6
Scenario Performance Good Average Bad
10/09/2014 - 16% 95.86 1.27 2.87
12/10/2014 - 16% 95.86 1.27 2.87
13/10/2014 - 16% 94.59 2.23 3.18
10/09/2014 - 27% 89.49 1.91 8.60
12/10/2014 - 27% 87.26 2.55 10.19
13/10/2014 - 27% 83.76 1.91 14.33
10/09/2014 - 38% 95.86 1.27 2.87
12/10/2014 - 38% 95.86 1.27 2.87
13/10/2014 - 38% 93.63 2.55 3.82
PI7 represents the proportion of daily wet-weather volume by daily dry-weather volume and is computed for all sewers for the
present a good performance since all values obtained were below 3. This means in a general point of view that there is no problem of excess of stormwater volume from the contributing subcatchments.
Finally, the results obtained for PI8 indicate that there is no problem of systems inflow since all sewers present a good
performance in all the nine scenarios considered.
4 Final remarks
In this paper an application of an estimation methodology of RDII to a Portuguese case study was presented. A two-step based methodology based in hydraulic modelling and assessment and performance indicators calculation were explained. The aim of the study was to quantify the amount of RDII and locate the priority intervention areas to reduce it on a case study. This case study is a small sanitary sewer system located in Lisbon Metropolitan Area, Portugal. The results obtained showed that there is no major problem of RDII in the case study. Note that the study has some limitations that can influence the final results such as i) the flow data collected showed values with large fluctuations in many days’ due pump operation which was difficult to model in SWMM; ii) precipitation data were available only for 2014; iii) precipitation data were available with a time period of 15 minutes not allowing a correct analysis of a rainfall event which has high variability in time; and iv) the rain gauge is not located in the system subcatchments. In future works is recommended to install a rain gauge in the system subcatchments and collect precipitation data with a time period of 1 minute during an entire year. Additionally, hydrogeological studies should be carried out in order to analyse the influence of the water table to the wastewater drainage system.
References
Almeida, M. C., Cardoso, M. A. (2010). Infrastructure Asset management of Wastewater and Stormwater Services. An approach based on
rehabilitation (in Portuguese). Technical Guide n.17. ERSAR, LNEC, IST, Lisboa (ISBN: 978-989-8360-05-2).
Amorim, H, Valente-Neves, M. and Matos, J. S. (2007). Undue turnout in sewers caused by improper drainage of wastewater (in Portuguese).
2ª Jornadas de Hidráulica, Recursos Hídricos e Ambiente. Porto (Portugal). pp. 169-177.
Brito, R., Matos, J. S., Monteiro, A., Ferreira, F., Machado, B. (2009). A simplified methodology to estimate rainwater contribution to
domestic sewers. Water Asset Management International. Dec 2009, 5 (4) 12-15.
Cardoso, A., Frehmann, T. (2010). Economic and operational aspects (Chapter 12). Assessing Infiltration and Exfiltration on the
Performance of Urban Sewer Systems. Eds. Bertrand-Krajewski, J., Ellis, B. IWA Publishing.
EPA (2014). Guide for Estimating Infiltration and Inflow. A New England Water Infrastructure Outreach.
Harold, E. (2007). Dry Wastewater Flows in Wastewater Collection System Modelling and Design. Bentley Institute Press (ISBN
0-9657580-9-5).
Matos, M. R., Cardoso, M. A., Ashley, R., Duarte, P., Molinari, A., Shulz, A. (2003). Performance Indicators for Wastewater Services –
Manual of Best Practice Series, IWA Publishing, London (ISBN 1-900222-90-06).
Nicklow, J.W., Boulos, P.F., and Muleta, M.K. (2004). Comprehensive sewer collection systems analysis handbook for engineers and