OBESITY
POVERTY
and
A New Public Health Challenge
OBESIT
Y
and
PO
VER
T
Y
ND
I N
A L UT
S
O R O P S
A H O ND
I N
P E
O V I M U P Pan American Health Organization Pan American Sanitary Bureau, Regional Office of the
World Health Organization
Scientific Publication No. 576
Sci. P
u
b.
N
o. 576
PAHO
Pan American Health Organization
Pan American Sanitary Bureau, Regional Office of the
World Health Organization
525 Twenty-third Street, N.W. Washington, D.C. 20037 U.S.A.
www.paho.org ISBN 92 75 11576 1
Obesity and Poverty: A New Public Health Challenge
is an essential
source for understanding the new face of poverty in the Americas. This
up-to-date examination of the prevalence of overweight and obesity in
Latin American and Caribbean countries looks at these conditions’
medium- and long-term harmful consequences and explores their
impli-cations for planning public health interventions.
The book analyzes how the region’s countries experience the nutritional
transition process that is under way worldwide, a process that is tied to
the global demographic and epidemiologic transition. In this context, the
increase in obesity and overweight observed in Latin America and the
Caribbean coexists with a risk factor that differs from traditional risk
factors seen in developed countriesæthe persistence or the increase of
inequalities and inequities in health.
The Pan American Health Organization offers this publication to the
general public and to researchers, students, communicators, and
politi-cians charged with planning and executing activities designed to promote
the population’s health and well being.
Editors:
Mission of the Pan American Health Organization
Obesity and Poverty:
A New Public Health
Challenge
PAN AMERICAN HEALTH ORGANIZATION Pan American Sanitary Bureau, Regional Office of the
WORLD HEALTH ORGANIZATION 525 Twenty-third St., N.W. Washington, D.C. 20037 U.S.A.
Also published in Spanish (2000) with the title:
La obesidad en la pobreza: un nuevo reto para la salud pública.
Publicación Científica de la OPS No. 576 ISBN 92 75 31576 0
PAHO Library Cataloguing in Publication Data
Pan American Health Organization.
Obesity and Poverty: A New Public Health Challenge.—Washington, D.C.: PAHO, © 2000.
xi, 124 p.—(Scientific Publication No. 576)
ISBN 92 75 11576 1
I. Title II. (series)
1. OBESITY–epidemiology 2. POVERTY 3. PUBLIC HEALTH 4. LATIN AMERICA 5. CARIBBEAN REGION
NLM WD210
The Pan American Health Organization welcomes requests for permission to repro-duce or translate its publications, in part or in full. Applications and inquiries should be addressed to the Publications Program, Pan American Health Organization, Washing-ton, D.C., U.S.A., which will be glad to provide the latest information on any changes made to the text, plans for new editions, and reprints and translations already available.
© Pan American Health Organization, 2000
Publications of the Pan American Health Organization enjoy copyright protection in accordance with the provisions of Protocol 2 of the Universal Copyright Convention. All rights are reserved.
CONTENTS
Preface . . . v
Introduction . . . vii
Obesity and Its Economic, Sociocultural, and Environmental Determinants
Obesity among the Poor: An Emerging Problem in Latin America
and the Caribbean . . . 3
Manuel Peña and Jorge Bacallao
Socioanthropological Aspects of Obesity in Poverty . . . 11
Patricia Aguirre
Factors in Obesity: Current Views . . . 23
Albert J. Stunkard
Physical Activity Patterns in Central America . . . 29
Benjamín Torún
The Epidemiologic Transition in Selected Countries: Case Studies
Obesity and Poverty: A Pending Challenge in Chile . . . 41
Cecilia Albala and Fernando Vío
The Epidemiologic Transition in Cuba . . . 51
Carmen Porrata, Arturo Rodríguez-Ojea, and Santa Jiménez
The Epidemiologic Transition in Brazil . . . 67
Carlos Monteiro
Epidemiologic and Demographic Transition:
A Typology of Latin American and Caribbean Countries . . . 77
Jorge Bacallao
Methodologic Aspects for Studying Obesity from a Public Health Perspective
Issues for Public Health Surveillance of Obesity:
Prevalence, Incidence, and Secular Trends . . . 87
David F. Williamson
iv Contents
Anthropometric Indicators of Obesity: Epidemiologic and
Public Health Aspects of Their Development and Use . . . 95
John H. Himes
Factors in Intrauterine Life and Adolescence Linked to Obesity in Adulthood
Poor Fetal and Child Growth and Later Obesity and Chronic Disease:
Relevance for Latin America . . . 103
Dirk G. Schroeder and Reynaldo Martorell
Obesity in Adolescence . . . 117
Insert text here v
PREFACE
Throughout history, obesity and overweight have been underestimated as public health problems in Latin America and the Caribbean. Both conditions are on the rise in the region, however, although this is difficult to measure, given the fact that the studies that have been carried out are not very representative. For many years, the harm to health from these conditions was overlooked. And even when it became apparent, it was viewed as an issue that was valid only in other socioeconomic contexts, and it was seen as insig-nificant or less important than protein-energy malnutrition and other nutritional defi-ciencies specifically linked to poverty.
The rising trend in obesity and overweight is part of the global demographic and epidemiologic transition that the Region’s countries are undergoing. This trend should not be seen simply as a concomitant manifestation of development, however, or merely as a minor evil that emerges as other, more serious, ills fade away. Although the term “transition” connotes change, substitution, and irreversibility in demographic, socio-economic, and epidemiologic profiles, it would be ingenuous to assume that obesity in Latin America and the Caribbean represents the same byproduct of excess that it does in high-income societies.
It also is incorrect to think that the variation in the “epidemiologic transition” process between developed and developing countries is a simple temporal phenomenon, whereby the former begin the process before the latter. Moreover, it is mistaken to believe that the efforts to cope with the consequences of obesity and overweight undertaken by some wealthy countries can be effectively cloned. The problem in poor countries is altogether different—and probably more serious.
The Pan American Health Organization is pleased to present this book, which includes contributions from well respected researchers in nutritional science. The book is the prod-uct of an editorial endeavor that aims at defining the problem of obesity and establishing its particular features in the region, as well as its trends and determinants; it also high-lights the most promising research efforts and activities for the near future.
Our support for this publication and for its dissemination underscores our commit-ment to integrate facts, information, research, knowledge, and action. If this message reaches the scientific community and decision makers, the objectives that sparked this publication will have been fulfilled.
George A. O. Alleyne Director
vii
INTRODUCTION
This book presents an up-to-date overview of the prevalence of overweight and obe-sity in the countries of Latin America and the Caribbean, their medium- and long-term adverse effects, and their implications for planning public health actions. It also ana-lyzes the characteristics specific to these countries in the worldwide process of nutri-tional transition, which is in turn related to the processes of demographic and epide-miological transition.
In the epidemiological transition, the most diverse manifestations of the morbidity and mortality profile coexist: non-communicable chronic diseases, infectious diseases, emerging and reemerging diseases, violence, addiction, and diseases associated with environmental deterioration. In this context, the increase in obesity and overweight seen in the region is overlaid by an additional risk factor that differs from the traditional risk factors in the developed countries: the persistence or growth of inequalities and inequi-ties in health.
The four sections that make up this publication do not presume to be a full discussion of the complexity of the regional problem but seek rather to present its economic, socio-cultural, and environmental determinants and to describe the specific characteristics of the epidemiological transition in a few selected countries of the Americas. In addition, they suggest some methodological aspects for studying obesity from the public health perspective, and discuss the relationship between certain factors of intrauterine life and adolescence that may be associated with obesity in adults.
In the first section, the article by Manuel Peña and Jorge Bacallao places obesity in the context of the demographic, epidemiological, and nutritional transition in Latin America and the Caribbean. Using a health promotion and disease prevention approach, the authors suggest that the monitoring of obesity is the foundation for a strategy to confront the growing prevalence of non-communicable chronic diseases associated with nutrition, a trend that emerges as a result of the aforementioned transition. The au-thors point out that the increased prevalence of obesity should not be interpreted as a sign of the transition to development and that obesity should not be considered solely as a disorder derived from an energy imbalance but rather as a nutritional disorder that can coexist with micronutrient deficiencies and other deficiency diseases, particu-larly in the most vulnerable socioeconomic groups. As a result, they suggest the exist-ence of “various obesities,” with probable differexist-ences in geographic, ethnic, and cul-tural patterns, an understanding of which should be reflected in research, policy formulation, and decision-making.
viii Introduction
level of satiety they produce, and the family’s economic situation. The author indicates that in Argentina there is a mechanism whereby the mother sacrifices her own dietary requirements to afford her children and husband a more balanced and adequate diet. Gender is another important aspect in the prevalence of obesity among women of low socioeconomic status. Cultural norms make women victims of an urban segregation pro-cess that limits their opportunity for activity and sources of cultural stimulation and, in turn, diminishes the social value of their bodies by limiting their social role solely to procreation.
Albert J. Stunkard analyzes the relative influence of genetic, socioeconomic, and cul-tural factors in obesity and interprets studies that calculate the contribution of heredi-tary and environmental factors to obesity. He also includes a review of works that lay the foundation for an inverse relationship between socioeconomic status and the prevalence of obesity in women. The author uses as a reference the large number of studies con-ducted on women, men, and children, both in developed and developing countries, in which the socioeconomic and cultural determinants of obesity are different. As a corol-lary, he suggests the need to study the relationship that exists among the prevalence of obesity, socioeconomic status, acculturation processes, and generational effects.
In the article on the patterns of physical activity in Central America, Benjamín Torún describes the effects of urbanization and industrialization on the lifestyles of rural popu-lations. Economic pressures and incentives that promote migration to urban peripheral areas (more health centers, schools and communication channels, and more free time for recreational activities) determine an increase in the risk of obesity. A population that prior to migrating engaged in the demanding physical activity associated with agricul-tural production becomes a marginal urban population that engages in less physical labor, consumes an imbalanced diet high in fat and calories, increases its consumption of alcohol and sweet beverages, and adopts a sedentary lifestyle. Based on the hypothesis that humans have a natural tendency to maintain energy equilibrium, the author indi-cates that the changes that promote inadequate dietary habits and discourage physical activity create conditions favorable to the increase in the risk of obesity and other associ-ated morbidities.
The second section of the publication includes four articles that describe the epide-miological transition in Chile, Cuba, and Brazil, as well as the proposed typology of the Latin American and Caribbean countries according to the characteristics of the phase of the demographic and epidemiological transition in which each country is found.
Peña and Bacallao ix
Carmen Porrata, Arturo Rodríguez-Ojea, and Santa Jiménez describe the characteris-tics of the epidemiological transition in Cuba in recent decades and highlight the dietary and nutritional aspects associated with it. They begin with an analysis of the socioeco-nomic characteristics of the population, its educational level, access to community and health services, food marketing dynamics, the availability of food and food consump-tion trends, breast-feeding, dietary habits, and the morbidity and mortality profile. They then describe the effects of the economic changes that occurred as a result of the disap-pearance of the Union of Soviet Socialist Republics and the socialist bloc in Eastern Eu-rope. They place Cuba in an advanced phase of the epidemiological transition, similar to the situation of the developed countries, though Cuba suffers greater economic under-development. The authors conclude that the prevalence of obesity is high for both sexes. Inadequate dietary patterns, sedentary lifestyles, the cultural influence of a favorable view of overweight, and ignorance of adequate nutritional principles would be some of the factors that determine this high prevalence. Consequently, the authors suggest an integrated primary care approach that would give priority to health promotion and com-munity participation in order to deal with the risk factors for obesity, take preventive measures, and perform early diagnoses.
Carlos Monteiro presents the results of his research on some aspects of the nutritional transition in Brazil in recent decades. The prevalence of malnourished children fell 60% in all socioeconomic strata and the prevalence of infant obesity, which is relatively low in Brazil, remained unchanged. The percentage of malnourished adults also fell substan-tially, but the percentage of obese adults nearly doubled. The changes also indicate a continuation of the strong inverse relationship between family income and the preva-lence of malnutrition and increased frequency of obesity in the poorest families. There is also a change in the relationship between family income and the body mass index (BMI) in women. Favorable changes in eating patterns do not seem to have been a result of the population’s awareness of the benefits of a healthy diet, but rather the result of availabil-ity and affordabilavailabil-ity of various foods. The greatest gap in information relates to the population’s patterns of physical activity, an aspect that is very important in explaining the increase in obesity. The author points out that the nutritional transition in Brazil should be taken into account when establishing public health priorities and action strat-egies: the prevention and control of non-communicable chronic diseases and education on food and nutrition for all socioeconomic strata must be definitively incorporated, and the supply of healthy foods and access to them must be promoted.
x Introduction
The third section of the publication contains two articles on the methodological as-pects that should be taken into account when studying obesity from the public health perspective. The work of David F. Williamson explains the basic measurements of the presence of a disease that are indispensable for monitoring obesity: prevalence, inci-dence, and secular trends. The author comparatively analyzes the application of these three indicators and, based on the recognized functional relationship among them, de-velops procedures for calculating the incidence and average duration of obesity, stress-ing the need to discern secular trends or temporal changes in prevalence usstress-ing longitu-dinal or cohort designs.
In his article, John J. Himes asserts that developing appropriate anthropometric indi-cators for obesity poses three critical questions: the objective of identifying obese or over-weight people; the selection of an anthropometric indicator; and the selection of an opti-mum cutoff point for that indicator. The objectives must take into account the level of analysis (individual or population group), use (screening, evaluation of prevalence, or program evaluation), and the foreseeable measures involved in obtaining information. The selection of the indicator must consider the objective, the intrinsic attributes of the indicator (sensitivity, specificity, and predictive value), and the practical aspects of ob-taining it in the actual sociocultural setting. Finally, the selection of the optimum cutoff point will depend on the objective and the attribute of the indicator that is considered most important in terms of the objective (specificity and positive predictive value). In addition, the selection of the cutoff point for screening purposes should be adapted to the resources available for the intervention.
Peña and Bacallao xi
final part analyzes the predictive value of obesity in childhood for obesity in adulthood. The author suggests some measures that should be considered in adolescence for reduc-ing or preventreduc-ing the risks associated with obesity in adulthood.
Although this work does not completely cover the problem of obesity in poverty, it does seek to inform and hold the active interest of the general public, researchers, stu-dents, communicators, and politicians responsible for planning and implementing ac-tivities designed to promote health and welfare for the entire population.
3
OBESITY AMONG THE POOR:
AN EMERGING PROBLEM IN LATIN AMERICA
AND THE CARIBBEAN
Manuel Peña
1and Jorge Bacallao
2ECONOMIC CHANGES AND NUTRITIONAL STATUS
The 1980s had a negative effect on economic growth in Latin America and the Caribbean. Conditions of inequity among social groups, characterized by very uneven distribution of income, were exacerbated with the implemen-tation of stabilization measures that helped to increase poverty and its extreme forms. Mi-gration of rural inhabitants to the urban pe-riphery and from poorer countries to countries with better conditions brought about signifi-cant changes in the living conditions and lifestyles of these groups. For example, in 1983 there were more than 917,000 displaced per-sons and refugees due to armed conflicts in Central America (1).
The social, economic, and demographic transformation of the last two decades coin-cided with changes in the epidemiological profile and in eating patterns (2) and physical activity in the region. The processes of demo-graphic, epidemiological (3, 4), and nutritional transition show specific characteristics in each country, depending on the onset and speed of
change. This diversity is consistent with the different models described by Omran (4, 5).
A universal characteristic of the epidemio-logical transition in Latin America and the Caribbean is increased life expectancy and reduced mortality rates in different age groups for most infectious diseases. The use of oral rehydration salts, family planning, and the success of mass immunization campaigns, as well as other techniques, have played a deci-sive role in reducing mortality, particularly during the first years of life. However, the fact that some infectious diseases still exist or are reappearing poses new challenges for public health.
Despite the general reduction in the preva-lence of protein-energy malnutrition (6) in Latin America and the Caribbean, in 1995 there were some six million children under the age of 5 with low weight-for-age. This figure (11% of the population in this age group) (7) is one of the more visible manifestations of poverty. Figure 1 shows that low height-for-age due to inadequate nutrition, and associated with fre-quent and prolonged episodes of infection and a harmful environment, is the most frequent anthropometric manifestation of nutritional deficiency in the region (8).
Micronutrient (iron, iodine, and vitamin A) deficiencies are also relevant nutritional
4 Obesity among the Poor: An Emerging Problem
lems. Iron deficiency and its effects on physi-cal, functional, and intellectual capacity affect most children in poor areas of Latin America and the Caribbean. It is estimated that 45% of children between 6 and 23 months of age, 30% of preschool and school children, 20% of women who are not pregnant, and 35% of pregnant women (9) suffer some degree of anemia due to iron deficiency. In 1997, it was estimated that 25% of the children under the age of 5 in Latin America suffered from a sub-clinical vitamin A deficiency (10) (weighted average of mean prevalence in the countries with information available), contributing to the high incidence of infectious diseases.
OBESITY: A GROWING PROBLEM
In many Latin American and Caribbean countries, a notable increase was reported in the prevalence of overweight (BMI3 between 25 kg/m2 and 29 kg/m2) and obesity (BMI ≥ 30 kg/m2). For example, in Chile, 3.7% of the children under age 6 fall below one standard deviation of the reference average weight es-tablished by the United States National Cen-ter for Health Statistics (NCHS) and the per-centage of those who fall above that deviation
3BMI = Body mass index (ratio of weight (kg) to height2
(m)). 60
50
40
30
20
10
0
Guatemala Honduras
Peru Haiti
Bolivia Ecuador
NicaraguaEl Salvador Mexico
Dominican Republic Paraguay
Brazil
Colombia Uruguay Venezuela JamaicaArgentina
Cuba Chile
䡵 Weight-for-age ratio
䡵 Height-for-age ratio
䡺 Weight-for-height ratio
Prevalence (%)
Peña and Bacallao 5
is 21.6%. These values reflect a notable dis-placement to the right in the distribution of the weight-for-age indicator (11).
Household surveys conducted in Brazil from 1974 to 1975 and during 1989 (12) showed a notable increase in overweight be-tween those periods in all age groups bebe-tween 18 and 65 years, for both women and men. The rising trend is confirmed in a 1996 report (13) that indicates an even higher prevalence of overweight. In São Paulo, Brazil, a study of 535 families (2,411 individuals) in a marginal urban population (14) showed that 30% of the children had a relative height deficit and that 5.8% of the boys and 6.8% of the girls were overweight. In addition, 9% of the adult fam-ily members were obese. These findings show the coexistence of malnutrition and obesity in the same setting.
The results of the ENDES survey conducted in Peru in 1996 (15), which examined 9,600 women who had given birth to at least one child during the preceding five years, showed an average BMI of 25.1 (± 3.8 kg/m2). It was also estimated that 34.5% of the women had a BMI between 25 kg/m2 and 29.9 kg/m2, and that 9.4% had a BMI above 30 kg/m2. The average BMI in the metropolitan area of Lima was 25.8 kg/m2. Diachronic studies conducted in Costa Rica and Panama also show an increased preva-lence of obesity among adults (16).
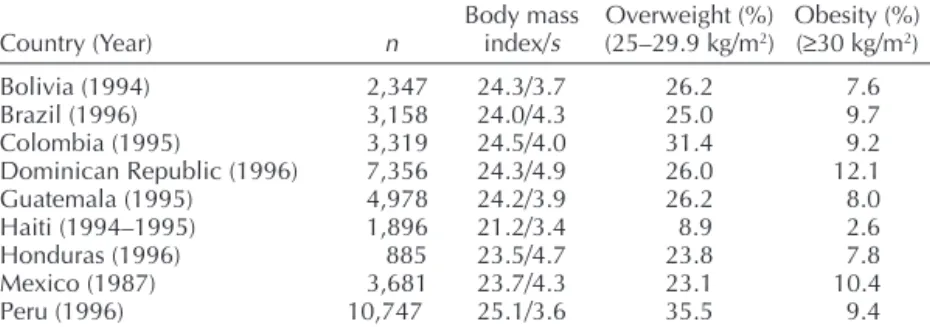
Table 1 shows the prevalence of overweight and obesity among women in various Latin
American and Caribbean countries based on Demographic and Health Surveys sponsored by the United States Agency for International Development (USAID) (17).
STUDIES ON OBESITY
Obesity is a current pandemic and its study as a priority public health issue is justified for the following reasons:
• It is a risk factor for various nutrition-related non-communicable chronic dis-eases (NCCDs), some of which are signifi-cant causes of death in the region. Ex-amples of such diseases are ischemic heart disease, type II or non–insulin-dependent diabetes mellitus (NIDDM), hypertension, some types of cancer, osteoarthritis, and osteoporosis, among others;
• The measures for preventing obesity, par-ticularly those that aim to improve nutri-tion and increase systematic physical activ-ity, coincide to a great extent with the measures for preventing other NCCDs; • Obesity is a useful indicator for monitoring
because it is easy to detect using traditional anthropometric measurements.
From the anthropometric point of view, fat distribution, the total amount or percentage of fat, and bodyweight, in that order, have
TABLE 1. Prevalence of overweight and obesity in women aged 15 to 49 in Latin American countries.
Body mass Overweight (%) Obesity (%) Country (Year) n index/s (25–29.9 kg/m2) (≥30 kg/m2)
Bolivia (1994) 2,347 24.3/3.7 26.2 7.6
Brazil (1996) 3,158 24.0/4.3 25.0 9.7
Colombia (1995) 3,319 24.5/4.0 31.4 9.2
Dominican Republic (1996) 7,356 24.3/4.9 26.0 12.1
Guatemala (1995) 4,978 24.2/3.9 26.2 8.0
Haiti (1994–1995) 1,896 21.2/3.4 8.9 2.6
Honduras (1996) 885 23.5/4.7 23.8 7.8
Mexico (1987) 3,681 23.7/4.3 23.1 10.4
Peru (1996) 10,747 25.1/3.6 35.5 9.4
6 Obesity among the Poor: An Emerging Problem
great explanatory value as additional risk fac-tors for NCCDs. According to data from the second United States Health and Nutrition Survey (18), obese people between the ages of 20 and 75 have 2.9 times greater relative risk of developing NIDDM than people of normal weight. The same survey shows that this rela-tive risk is 3.8 for obese people between the ages of 45 and 75, and 2.1 for those between 20 and 25. The survey also indicates the im-portance of the type of distribution of body fat. Pi-Sunyer (19) referred to the effect of weight loss on reducing morbidity and mor-tality among diabetics and recommended that the BMI values be no higher than 25 kg/m2. Must (20) states that the risk of suffering health problems throughout the life cycle doubles in individuals who were overweight in child-hood, and that the risks are higher if the ex-cess weight was retained during adolescence. Meisler and St. Jeor (21) feel that being mod-erately overweight is also associated with high mortality during adulthood. The data from the Framingham study (22) show that overweight significantly increases the frequency of NCCDs. Twenty-six years of longitudinal follow-up in-dicated that an increase of one standard devia-tion for relative weight was associated with greater frequency of cardiovascular complaints: 15% in women and 22% in men.
There are specific suggestions on “healthy weight” or recommended weight for prevent-ing NCCDs, includprevent-ing cardiovascular diseases (22) and NIDDM (19). It has also been shown that there is an association between weight reduction and improvement in certain clini-cal parameters. However, there are no reliable data for making recommendations regarding diseases such as hypertension (23) and colon cancer (24). In addition, there is unanimity regarding the need for further study of over-weight in children and the elderly before rec-ommendations regarding “ideal weight” can be made (25). Promoting appropriate eating behaviors and regular physical exercise con-sistent with economic, social, and cultural re-alities is an important remedy for preventing obesity at any age.
Obesity as a Marker of the Risk of Nutrition-related NCCDs
Compared to diseases related to other en-vironmental conditions and diseases with a genetic origin, nutrition-related NCCDs rep-resent a very high percentage of all NCCDs. Obesity, particularly overweight, can be a very useful marker for monitoring activities due to its sensitivity and because the screening and detection of at-risk subjects are procedures that are easily applied and cost little. Any other more specific condition would doubtless be much more expensive and difficult to detect. For epidemiological purposes, obesity is evaluated using anthropometric techniques, customarily by measuring weight and height, and using established reference and cut-off points. The measurement of these variables requires a simple, relatively low-cost technol-ogy that allows us to determine whether there is a high association with the risk factors for obesity and other NCCDs (25). In addition, training in measurement-taking is simpler than the training required to apply the diag-nostic techniques for evaluating other NCCDs. For example, to detect high blood pressure one must use a sphygmomanometer and the sub-ject must meet the minimum conditions of rest and relaxation. In the case of NIDDM, bio-chemical techniques are used, the subject must be prepared, and the rules for preserving samples must be followed.
Preventing Obesity and NCCDs
Peña and Bacallao 7
Subsequently, an adequate diet and system-atic physical activity are two key elements for preventing most NCCDs.
From the age of 4, it is necessary to reduce the relative contribution of fats as a source of energy, to control the quality of fats eaten by reducing saturated fats and increasing the rela-tive amount of polyunsaturated (omega-3) fatty acids and monounsaturated fatty acids, to reduce the consumption of simple carbo-hydrates and increase the consumption of complex carbohydrates, to increase the con-sumption of fiber, reduce the concon-sumption of sodium, and systematically meet the require-ments for all essential nutrients. The benefit of regular physical exercise not only makes it possible to maintain an adequate energy balance but it also has favorable effects on the circulatory, respiratory, endocrine and osteomuscular, and other systems (27, 28).
OBESITY AND SOCIOECONOMIC STATUS
The relationship among malnutrition, infec-tious disease, and poverty, and the relation-ship among obesity, chronic disease, and eco-nomic well-being are no longer applicable in the developed countries and are being re-duced daily in the developing countries in the region (29). In peri-urban areas it is normal to find a family in which the father has high blood pressure, may be fat or not, is short, and has a probable history of malnutrition; the mother is anemic, probably obese, and short; and the children suffer frequent infections and show stunting.
In 1989, Sobal and Stunkard (30) performed a broad review of 144 publications that related socioeconomic status to obesity. Thirty stud-ies of women in developed countrstud-ies found a direct relationship between these factors, 28 studies found an inverse relationship, and two found no relationship. In the case of men, 12 studies found an inverse relationship, 11 found a direct relationship, and three found no relationship. In contrast, the studies
con-ducted in the developing countries found a direct relationship between obesity and socio-economic status (SES) for both men and women (Figure 2). Although the diversity of the indicators and cut-off points used to qualify obesity and to characterize socioeco-nomic status are limitations of these studies, the trends are significant.
Studies conducted in the 1980s in the met-ropolitan region of Santiago, Chile found that 5% of the male population and 28% of the fe-male population were obese (weight-for-height values were 120% higher than the ref-erence value) (31). The stratification of the sample according to socioeconomic status makes it possible to note that obesity is more frequent in the poorest socioeconomic sec-tors. Monteiro (32) analyzed two national diachronic samples in Brazil and noted that there was increased obesity in groups at the poorest socioeconomic level over a period of 15 years. Working with the same data, Sichieri et al. (12) showed that the percentage of women with low weight decreased during the same period and the percentage of overweight men and women increased. In a document from the Nutrition Institute cited in Uruguay’s report to the International Conference on Nu-trition held in Rome in 1992, Bove, Severi, and González pointed to a higher percentage of obesity among women of low SES (37.6%) than among women of high SES (33) and, when gender-related factors were considered, the greatest differences were also recorded at the low socioeconomic levels. Another study con-ducted in popular restaurants in the poor neighborhoods of a district in metropolitan Lima found a direct association between obe-sity and SES: the prevalence of overweight and obesity among women was 32.6% and 13.1%, respectively (33).
8 Obesity among the Poor: An Emerging Problem
factors. In some countries of the Americas, the relationship between obesity and SES is simi-lar to the relationship in the developed coun-tries. In other countries, the relationship may be the inverse. It is likely that this variable behavior pattern is heading toward an inverse relationship pattern, according to the pace and the model of epidemiological and nutritional transition specific to each country.
THE “POOR” OBESE PERSON AND THE “RICH” OBESE PERSON
The characteristics of obesity may be differ-ent among the poorest and richest people of the same country, or between the poorest and richest people of the developed or develop-ing countries. In order to analyze these differ-ences, it is important to consider the effect of different types of factors.
Adaptive Genetic Factors
According to the thrifty genotype hypoth-esis (34), the obese poor may have developed
a mechanism for metabolic adaptation. The hypothesis postulates that populations ex-posed to inadequate or fluctuating food con-sumption generate adaptive methods to achieve a high level of efficiency in the use of energy and depositing of fats. If these meth-ods are retained when these groups succeed in having food regularly available, there may be an increase in the prevalence of overweight and NIDDM.
Nutritional Factors
Urban populations in different countries have changed their diets, increasing fat and sugar consumption and decreasing fiber con-sumption (35–37). In some low-income urban sectors, the percentage of fat in daily energy intake increased considerably over the last 25 years (38). High prices for fresh fruits and veg-etables and other foods with high nutritional quality make these foods inaccessible to the lowest income groups (39). In addition, the food industry offers various foods that have high energy density (rich in fats and sugars) but are deficient in other essential nutrients: their great
Condición socioeconómica
FIGURE 2. Relationship between obesity and socioeconomic status.
Developed societies Developing societies
Proportion of obesity
Peña and Bacallao 9
ability to satiate, their pleasing taste, and their low cost make them socially acceptable and preferable to the poorest groups.
Sociocultural Factors
The aggressive and insecure environment that characterizes life in peri-urban areas pre-vents the poor population from engaging in systematic physical exercise. In addition, those who live in these areas usually receive less information on the health and quality-of-life benefits of exercise. Inequities in access to health promotion messages, health education, and adequate health care services make it dif-ficult to know the importance of changes in behavior needed to achieve a healthier lifestyle (40, 41).
Acculturation at a Distance
As a result of contact with the cultural pat-terns of the developed countries, the process of acculturation in Latin America and the Car-ibbean throughout the 20th century took on particular nuances due to rapid advances in science and communications. This “accultura-tion at a distance,” skillfully manipulated by consumer industry, tends to awaken in people the need to incorporate some elements of the projected image and leads them to adopt in-appropriate habits and lifestyles. Studies of Mexican-American populations showed the differential influence of acculturation in men and women (42, 43) and that the process gen-erates more obesity in women (43).
The more prosperous groups manage to adapt to these changes more easily. In contrast, the poorer groups suffer from the conflict be-tween their abilities and the ideal image with which they identify. As a result, those who have more limited cultural and social oppor-tunities and live in a violent and insecure en-vironment show micronutrient deficiencies and excess bodyweight and are at the same time at risk of contracting infectious diseases and chronic non-communicable diseases as-sociated with their diets.
Gender-based Factors
If gender-based factors are taken into ac-count, the difference between the “two types of obesity” is even more striking: women have more limited opportunities, bear heavier so-cial burdens, and have an undervalued body image. In addition, their traditional social sub-ordination to men increases their susceptibil-ity to that complex set of unfavorable influ-ences. The sum of these factors shows the need to conduct further studies of them.
REFERENCES
1. Delgado HL, Ramírez M. Dieta y salud en la región centroamericana. In: Proyecto multicentro Dieta y Salud en Latinoamérica y el Caribe. PAHO/Kellogg; 1994.
2. Drewnowski A, Popkin BM. The nutrition transition: New trends in the global diet. Nutr Rev 1997;55(2):31– 43.
3. Omran AR. “The epidemiologic transition.” A theory of the epidemiology of population change. Milbank Mem Fund Q 1971;49(4):509–538.
4. Omran AR. The epidemiologic transition in the Ameri-cas. Washington, DC: Pan American Health Organi-zation; 1996.
5. Bacallao J. Diet and health in the Americas: A review. In: Technical Meeting on Obesity in Poverty: Situa-tion in Latin America, Havana, 15–19 May 1995. 6. Gillespie S, Mason J, Martorell R. How nutrition
im-proves. Geneva: United Nations, ACC/SCN; 1996. (State-of-the-Art Series 15).
7. World Health Organization. Nutrition: Highlights of recent activities in the context of the World Declaration and Plan of Action for Nutrition. Geneva: WHO; 1995. (WHO/NUT/95.2).
8. Pan American Health Organization. Health in the Americas. 1998 Edition. Washington, DC: PAHO; 1998. (Scientific Publication 569; 2 vol).
9. Mora JO, Mora OL. Deficiencias de micronutrientes en América Latina y el Caribe: anemia ferropriva. Washing-ton, DC: Pan American Health Organization; 1998. 10. Mora JO, Mora OL. Deficiencias de micronutrientes en
América Latina y el Caribe: vitaminas. Washington, DC: Pan American Health Organization; 1998.
11. Chile, Ministry of Health. Report of the Minister of Health. Santiago: Ministry of Health; 1996. 12. Sichieri R, Coitinho DC, Leao MM, Recine E, Everhart
JE. High temporal, geographic, and income variation in body mass index among adults in Brazil. Am J Pub-lic Health 1994;84(5):793–798.
10 Obesity among the Poor: An Emerging Problem
from less and more developed regions of Brazil. In: 8th International Congress on Obesity, Paris, 29
Au-gust–3 September 1998.
14. Sawaya AL, Dallal G, Solymos G, De Sousa MH, Ventura ML, Roberts SB, et al. Obesity and malnutri-tion in a shantytown populamalnutri-tion in the city of São Paulo, Brazil. Obes Res 1995;3(Suppl 2):107s–115s. 15. Perú, Instituto Nacional de Estadísticas e Informática.
Encuesta demográfica y de salud familiar (ENDES) 1991– 1992. Lima: INEI; 1992.
16. Pan American Health Organization, Nutrition Insti-tute of Central America and Panama. Informe del proyecto multicentro Dieta y Salud en Latinoamérica y el Caribe. Guatemala: OPS, INCAP; 1994. (DOE/ IP/049).
17. Martorell R, Kettel Khan L, Hughes ML, Grummer-Strawn LM. Obesity in women from developing countries. (Submitted for publication).
18. Ohlson L, Larsson B, Svardsudd K. The influence of body fat distribution on the incidence of diabetes mellitus. 13.5 years of follow-up of the participants in the study of men born in 1913. Diabetes 1985;34(10): 1055–1058.
19. Pi-Sunyer F. Weight and non-insulin dependent diabe-tes mellitus. Am J Clin Nutr 1996;63(Suppl 3):426S–429S. 20. Must A. Morbidity and mortality associated with el-evated body weight in children and adolescents. Am J Clin Nutr 1996;63(Suppl 3):445S–447S.
21. Meisler JG, St. Jeor S. Summary and recommenda-tions from the American Health Foundation’s Expert Panel on Healthy Weight. Am J Clin Nutr 1996 Mar;63(Suppl 3):474S–477S.
22. Kannel WB, D’Agostino RB, Cobb JL. Effect of weight on cardiovascular disease. Am J Clin Nutr 1996; 63(Suppl 3): 419S–422S.
23. McCarron DA, Reusser ME. Body weight and blood pressure regulation. Am J Clin Nutr 1996;63(Suppl 3):423S–425S.
24. Shike M. Body weight and colon cancer. Am J Clin Nutr 1996;63:442S–444S.
25. World Health Organization. Physical status: The use and interpretation of anthropometry. Report of a WHO Expert Committee. Geneva: WHO; 1995:312–340. (Tech-nical report series 854).
26. Barker DJ. Fetal origins of coronary heart disease. Br Med J 1995;311(6998):171–174.
27. Williamson DF. Dietary intake and physical activity as “predictors” of weight gain in observational pro-spective studies of adults. Nut Rev 1996;54(4Pt2): S101–S109.
28. Peña M, Amador M, Bacallao J. Obesity. In: Johnston FE, ed. Nutritional anthropology. New York: Alan R Liss; 1987.
29. Peña M, Freire W. Informe de la Reunión Técnica sobre Obesidad en la Pobreza: Situación de América Latina.
Washington, DC: Pan American Health Organization; 1996. (PAHO/HPP-HPN 96-02).
30. Sobal J, Stunkard AJ. Socioeconomic status and obe-sity: A review of the literature. Psychol Bull 1989; 105(2):260–275.
31. Vio F, Albala C, García F, Martínez J, Uauy R. Conse-cuencias de la transición epidemiológica en la salud y nutrición del adulto en Chile. Santiago: Universidad de Chile, Instituto de Nutrición y Tecnologia de los Ali-mentos. Universidad de Chile; 1995. (Technical report). 32. Monteiro CA, Mondini L, de Souza AL, Popkin BM.
The nutrition transition in Brazil. Eur J Clin Nutr
1995;49(2):105–113.
33. Zavaleta N. Evaluación de comedores populares de Chorrillos, Lima. In: Peru, Instituto de Investigación Nutricional. Informe final a “Interamerican Foundation.”
Lima: IIN; 1995.
34. Neel JV. Diabetes mellitus: A thrifty genotype ren-dered detrimental by “progress”? Am J Hum Genet
1962;14:353–362.
35. Amador M, Peña M. Nutrition and health issues in Cuba: Strategies for a developing country. Food and Nutrition Bulletin 1991;13:311–317.
36. Popkin BM. Nutritional patterns and transition. Pop Dev Rev 1993;19:138–157.
37. Popkin BM, Keyou G, Hai F, Guo X, Ma H, Zohoori N. The nutrition transition in China: A cross-sectoral analysis. Eur J Clin Nutr 1993;47(5):333–346. 38. Sánchez-Griñán MI, Bernui I, Ganoza L. Dieta y salud
en el Perú en relación a enfermedades crónicas no transmisibles. In: Proyecto multicentro Dieta y Salud en Latinoamérica y el Caribe. PAHO/Kellogg; 1995. 39. Aguirre P. How the very poor survive: The impact of hyper-inflationary crisis on low-income urban house-holds in Buenos Aires, Argentina. Geo Journal 1994;34: 295–304.
40. Jeffery RW. Population perspectives on the preven-tion and treatment of obesity in minority populapreven-tions.
Am J Clin Nutr 1991;53(Suppl 6):1621S–1624S. 41. Pawson IG, Martorell R, Mendoza FE. Prevalence of
overweight and obesity in US Hispanic populations.
Am J Clin Nutr 1991;53(Suppl 6):1522S–1528S. 42. Kettel Khan L, Martorell R. Overweight and obesity
in US Hispanics. In: Sanjur D, ed. Hispanic foodway, nutrition and health. Boston: Allyn and Bacon; 1995: 221–246.
11
SOCIOANTHROPOLOGICAL ASPECTS
OF OBESITY IN POVERTY
Patricia Aguirre
1Observation of the direct relationship between malnutrition and obesity in the poorest sec-tors of Argentine society, particularly among women, demonstrated the need to investigate the causes of the problem and the factors pro-moting its development. The decision was then made to conduct a retrospective study of people living in a poor environment in order to analyze the socioeconomic factors that in-fluence access to food, the practice of physi-cal exercise, and body image. The study con-sidered the information obtained between 1965 and 1995 by the National Development Council (CONADE) (1), the National Institute of Statistics and Censuses (INDEC) (2–4), and the Social Programs Information and Moni-toring System (SIEMPRO) (5).
The study found that the poor do not eat what they want, or what they know they should eat, but what they can afford. Restric-tions on access to food determine two simul-taneous phenomena that are two sides of the same coin: the poor are malnourished because they do not have enough to feed themselves and they are obese because they eat poorly, with a significant energy imbalance. The foods available to them are industrialized, mass-produced, undifferentiated, and inexpensive products. In the Buenos Aires metropolitan
area, Argentina’s major urban conglomerate, prices for fruits and vegetables, lean meats, and dairy products tend to increase faster than the average rate of inflation. Given this situa-tion, the poor choose foods that are rich in carbohydrates, fats, and sugars, which do not provide them with adequate nutrition, but do satisfy their appetites and are easily incorpo-rated in their traditional consumption patterns and their standards of commensalism (group meals). For its part, the food industry fosters this behavior by compartmentalizing supply and marketing mass, low-quality products with a higher fat and sugar content that are targeted to sectors with less purchasing power. In addition, we note that the close associa-tion between obesity and malnutriassocia-tion has a greater effect on poor women. Because they skip meals to allow their children and hus-bands who work outside the home to eat, they sate themselves by consuming teas and bread. This diet, together with the social devaluation of a poor woman’s body, fosters a process of deterioration, and obesity is its most visible sign. In Argentina, these processes occur within a social and economic environment in which capital accumulation and the opening of markets are promoted in order to maintain economic stability. This economic model has advantages and disadvantages: although the decline in inflation causes a reduction in the “inflation tax” that weighs more heavily upon 1 Ministerio de Salud y Acción Social, Dirección Salud
12 Socioanthropological Aspects of Obesity in Poverty
the poorest sectors, it also promotes a strong concentration of income. As a result, the poor become increasingly poor and the magnitude of their poverty grows more and more.
This situation was used as a frame of refer-ence and justification for studying variations in consumption patterns among the poor population of the Buenos Aires metropolitan area during the period 1965–1995 as well as the effects of these variations on people’s nu-tritional status. Considering that consumption patterns, or food habits, are built over the long term through the selection of those foods that bring more economic and nutritional advan-tages, an effort was made to determine the relative advantages that the poor find in the foods they eat. The anthropological approach used to describe the strategies and rationality of food consumption among the poor made it possible to analyze macroeconomic factors that determine the level of access to foods and the microsocial factors that determine that access in the household setting.
In Argentina, with an urban population of 86.4% and a virtually unrestricted market economy, consumption patterns are strongly influenced by the components of food access: purchasing power, social assistance policies, and consumption strategies. Food purchasing power, which is the relationship between the prices of products and the incomes of buyers, changes with fluctuations in the economic cycle (which determines incomes) and the agro-industrial cycle (which determines food prices). Both factors currently have a greater impact on the nourishment of the poor than do health and education plans, as government adjustment policies significantly reduced in-vestment in these areas.
Although the poor know the advantages of harmonious and balanced nourishment, they eat those foods that allow them to obtain the greatest possible yield (primarily economic) from their limited incomes. When they do this, their diet becomes monotonous and the nu-tritional content of the products they eat is inadequate because of their high carbohydrate and fat content. However, comparative
advan-tages in terms of access do not of themselves determine the adoption of a consumption pat-tern if they are not related to the standards of commensalism and gender- and age-based activity that are characteristic of each social group. Thus, obesity among poor women is associated not only with their restricted access to food but also with their particular living conditions, their self-image, the work they do, and their eating habits.
The Problem of Knowing What to Eat
A very widespread idea is that malnutrition is the result of ignorance, that the poor fill their food baskets with bread and pasta because they do not know what constitutes adequate nourishment. To demonstrate the fallacy of this notion, a comparison was made of food baskets over a period of 20 years (Table 1). It was apparent that the same products appeared throughout the period, showing a stable con-sumption pattern, but that the total average volume of the foods consumed fell by 20%.
Aguirre 13
it is always significant for the poor and for industry. For example, in 1985 food assistance represented 12% of total income for house-holds below the poverty line, and the State purchased 30% of the powdered milk pro-duced in the country in order to use it in its assistance programs. In conclusion, the analy-sis indicates that the food pattern remains stable and that the overall decline in food con-sumption cannot be attributed solely to a prob-lem of education, but must be attributed to a problem of access as well.
Trends in the Components of Access
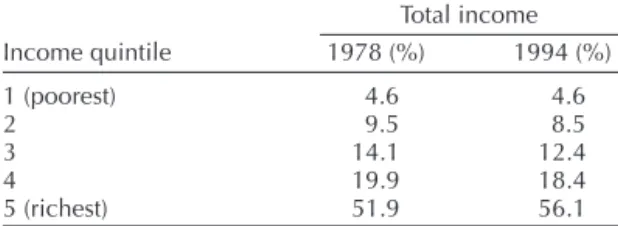
Income Distribution
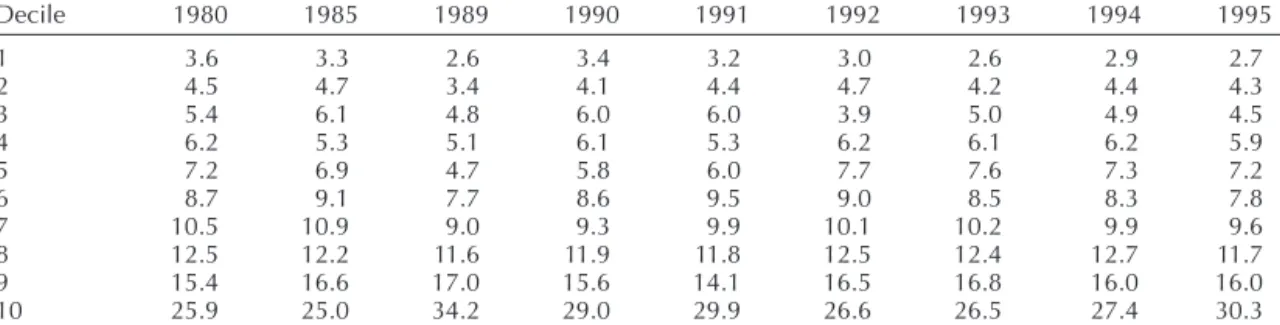
The distribution of income in Argentine so-ciety in recent years shows that all population groups, with the exception of the wealthiest, have suffered a loss. Table 2 shows that be-tween 1980 and 1995 there was a decrease in the incomes of the first eight deciles and an
increase in the last two deciles. The progres-sive impoverishment of the society is not only a reflection of an increase in the number of poor. Poverty becomes worse in poor house-holds because incomes decline. For example, the poorest groups in the first decile received 3.6% of total income in 1980, but received only 2.6% in 1995—a 25% loss (6). As the decline seen in the surveys indicates, when poor households receive less income, they change their diet and they eat less.
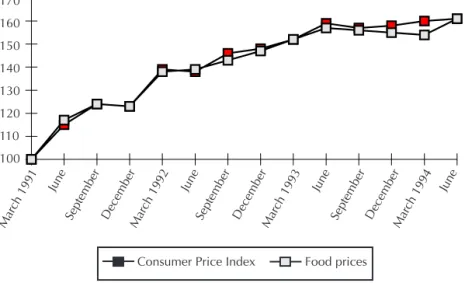
Food Prices
The comparison between the Food and Bev-erage Relative Price Index and the Consumer Price Index between 1991 and 1995 indicates that the decline in income was accompanied by a permanent increase in food prices. Even in a period of stability, food and beverage prices remained above the average inflation rate (Table 3). The combination of rising prices and falling incomes meant that all of
Argen-TABLE 1. Variation in food product consumption (in kilograms), 1965 and 1985.
1965 1985 Variation
Product (kg) (kg) (%)
Grains 105.71 79.08 –25.2
Beef (fatty cuts) 13.19 8.16 –38.1
Beef (lean cuts) 38.24 47.52 24.3
Pork and lamb 5.40 1.20 –77.8
Poultry 11.00 16.80 52.7
Cold cuts and sausages 7.92 5.88 –25.8
Fish and shellfish 6.78 4.56 –32.7
Fresh milk 102.45 71.40 –30.3
Powdered milk 0.31 0.60 93.5
Cheeses (soft and hard) 10.14 11.28 11.2
Butter 3.49 1.68 –51.9
Fruits (fresh and preserved) 64.26 48.12 –25.1
Vegetables and legumes 129.56 91.68 –29.2
Sugar and sweets 73.45 66.32 –9.7
Coffee 4.21 1.68 –60.1
Maté tea 7.06 7.20 20.0
Bottled water and carbonated beverages 87.00 51.72 –40.6
Beer 5.15 4.68 –9.1
Wine 55.78 32.16 –42.3
14 Socioanthropological Aspects of Obesity in Poverty
tine society had to devote a larger percentage of their overall household budget to food. In 1970, the poorest groups spent 45.23% of their incomes on food; by 1985, the figure had risen to 53% and unofficial surveys indicate that this spending reached 67.27% in 1992 (Table 4).
An analysis of the characteristics of the diet of the poor is even more justified given evi-dence that restrictions on access affect half the population and all social strata (7). In the case of the poorest groups, the decline in consump-tion must also be associated with differences in the foods they eat. As shown in Table 5, the food baskets of the poor contain more bread, grains, potatoes, tubers, and sugar, an equal amount of oils, and fewer meats, dairy prod-ucts, fruits and vegetables, eggs, wine, and carbonated drinks than do the baskets of the other socioeconomic strata.
Trends in Relative Food Prices
To determine the underlying causes for the composition of the food basket, the factors that determine the poor’s access to the products they eat most, the products they always eat, and the products they stopped eating were analyzed. According to INDEC’s surveys of general spending, food product consumption depends on the amount of income: the foods that are consumed more when incomes de-cline (bread, potatoes, pasta, wheat flour, sugar, soy oil, maté, and popular cuts of meat) are the foods that are consumed less when incomes rise. Figure 1 shows that the foods the poor eat when their incomes fall remained below the increase in inflation (Consumer Price Index, general level), although in recent years they tended to become equal. The com-parative advantages of carbohydrates and fatty meats are evident: not only are they less
TABLE 2. Percentage distribution of per capita family income in the Buenos Aires metropolitan area, Argentina, 1980, 1985, and 1989–1995.
Decile 1980 1985 1989 1990 1991 1992 1993 1994 1995
1 3.6 3.3 2.6 3.4 3.2 3.0 2.6 2.9 2.7
2 4.5 4.7 3.4 4.1 4.4 4.7 4.2 4.4 4.3
3 5.4 6.1 4.8 6.0 6.0 3.9 5.0 4.9 4.5
4 6.2 5.3 5.1 6.1 5.3 6.2 6.1 6.2 5.9
5 7.2 6.9 4.7 5.8 6.0 7.7 7.6 7.3 7.2
6 8.7 9.1 7.7 8.6 9.5 9.0 8.5 8.3 7.8
7 10.5 10.9 9.0 9.3 9.9 10.1 10.2 9.9 9.6
8 12.5 12.2 11.6 11.9 11.8 12.5 12.4 12.7 11.7
9 15.4 16.6 17.0 15.6 14.1 16.5 16.8 16.0 16.0
10 25.9 25.0 34.2 29.0 29.9 26.6 26.5 27.4 30.3
Source: Argentina, Instituto Nacional de Estadística y Censos. Encuesta de Gastos e Ingresos de los Hogares: cantidades consumidas. Buenos Aires: INDEC; 1992.
TABLE 3. Comparison between the Consumer Price Index (general level) and the Food and Beverage Relative Price Index, Argentina, 1991–1995a.
Consumer Food and
Year Price Index beverage portion
1991 100 100
1992 130 143
1993 145 158
1994 153 162
1995 160 168
a March 1991 = 100.
Source: Argentina, Instituto Nacional de Estadística y Censos. Estadística Mensual. Índice de Precios al Consumidor, serie 1980– 1996. Buenos Aires: INDEC; 1997.
TABLE 4. Food cost by income level, Argentina, 1970, 1985, and 1992.
Quintile
Year 1 2 3 4 5 Total
1970 45.23 41.15 35.96 29.84 22.91 31.22 1985 53.00 40.50 44.20 39.00 29.50 38.20 1992a 67.27 52.38 49.14 45.00 25.48 47.86
a Unofficial estimates.
Aguirre 15
expensive but they also produce a feeling of being full. The poor do not choose this group of products because they do not know better but because they cannot afford to eat other more expensive foods. They recognize that
they “don’t nourish” (a characteristic of pro-teins in the popular belief), but that they “fill” or “fool the stomach.” In addition, the trends in prices for the food products eaten by the middle-income sectors coincided with in-creased inflation (Figure 2), and the prices for foods eaten by the high-income sectors ex-ceeded average inflation (Figure 3). Accord-ing to INDEC’s Household SpendAccord-ing and In-come Survey, the cost for 1000 kcal in each sector according to income level shows a posi-tive cost-benefit ratio for the low-income sec-tors (Table 6).
However, the poor do not fill up their bas-kets with the foods that cost least and provide 1000 kcal at the lowest price based solely on the cost-benefit criterion. They also consider the satiety and satisfaction they obtain from these foods, and whether these foods are eas-ily incorporated with the group’s patterns of commensalism, with the customary method of preparing products, and with beliefs regard-ing the contribution each food makes to the body image endorsed by society.
TABLE 5. Average monthly percentage of food consumption by product and per capita income level, Argentina, 1992.
Quintile 1 Quintile 3 Quintile 5
Product (%) (%) (%)
Oil 2.20 2.12 2.18
Sugar 4.03 3.56 3.45
Meat 14.86 15.93 15.95
Grains 17.77 13.43 10.30
Spices 0.78 0.86 0.89
Fruits and
vegetables 13.69 16.31 19.39
Carbonated
beverages 15.62 17.35 19.10
Eggs 1.49 1.76 1.69
Tea 1.27 1.31 1.53
Dairy products 13.47 14.33 14.13
Potatoes 9.40 7.27 5.52
Wine 5.32 5.77 5.87
Source: Argentina, Instituto Nacional de Estadística y Censos. Encuesta de Gastos e Ingresos de los Hogares: cantidades consumidas. Buenos Aires: INDEC; 1992.
Source: Argentina, Instituto Nacional de Estadística y Censos. Encuesta de Gastos e Ingresos de los Hogares e Índice de Precios al Consumidor.
100 110 120 130 140 150 160 170
ar-91
j s d
Mar-92
j s d
Mar-93
j s d
Mar-94 j
I.P.C Precio Alim
Mar ch 1991
June
September DecemberMar ch 1992
Mar ch 1993
Mar ch 1994
June June June
September December September December
170
160
150
140
130
120
110
100
Food prices Consumer Price Index
16 Socioanthropological Aspects of Obesity in Poverty
Prices Compared
Comparing the prices of the foods the poor eat most (bread, pastas, and fatty cuts of meat) and the foods they eat least (vegetables and
fruits) indicates that between 1980 and 1994 the poor were able to buy 700 g of beef or 1.5 k of pasta or 1.3 k of bread for the price of 500 g of lettuce and 500 g of tomatoes. It is obvi-ous that fresh vegetables or fruits do not meet 00
10 20 30 40 50 60 70
ar-91
j s d
Mar-92
j s d
Mar-93
j s d
Mar-94 j
I.P.C. Precio Alim
170
160
150
140
130
120
110
100
Mar ch 1991
June
September December December December
June June June
September September Mar
ch 1992
Mar ch 1993
Mar ch 1994
I.P.C. Precio AlimFood prices Consumer Price Index
FIGURE 2. Trend in relative weighted prices for consumption tracer foods in middle-income sectors, Argentina, March 1991 to June 1994.
Source: Argentina, Instituto Nacional de Estadística y Censos. Encuesta de Gastos e Ingresos de los Hogares e Índice de Precios al Consumidor.
Mar ch 1991
September March 1992 September March 1993 September March 1994 170
160 150 140 130 120 110 100
June
December
June
December December
June June
Consumer Price
Index Food Price
䡵 䡵
䡵
䡵
䡵
䡵 䡵 䡵
䡵
FIGURE 3. Trend in relative weighted prices of consumption tracer foods in upper-income sectors, Argentina, March 1991 to June 1994.
Source: Argentina, Instituto Nacional de Estadística y Censos. Encuesta de Gastos e Ingresos de los Hogares e Índice de Precios al Consumidor.
Aguirre 17
the criteria of satisfaction or convenience be-cause their prices are very high and they are not very filling (Table 7).
The price structure is contradictory in a country with a temperate climate: fruit and vegetable products are as expensive as beef, even though beef requires a more costly and complex industrial process (slaughter, cutting, cold storage, packaging, distribution, etc.), plus the time to raise the animal. However, the stable relationship among prices since 1980 indicates that the price the consumer must pay will keep the poor from consuming these products if the marketing of fruits and
veg-etables does not change (7). In addition, we note that the cuts of meat selected differ ac-cording to the various sectors’ income levels. The high-income population chooses lean, juicy, tender meats from the animals’ hind-quarters, which are the most expensive cuts. The poor choose tougher and fattier cuts of meat (brisket and topsides) from the forequar-ters because they are cheaper. All social sec-tors eat the three “multi-function” cuts (ground meat, rump, and sirloin). It should be empha-sized that the cuts of meat consumed by the low-income sectors provide them with protein at a lower price, but that the fat content is also much higher. If the composition of 100 g of topside meat is compared with 100 g of steak meat, it can be seen that topside meat provides more kilocalories than steak (331 kcal versus 248 kcal, respectively), but it also provides less protein (15.9 g versus 17.8 g, respectively) and more fat (29.7 g versus 19.7 g, respectively). In conclusion, in order for the poor to vary their food selection and consume fewer carbohy-drates and fats and more fruits, vegetables, fish, and cheese, the real conditions for access to these latter products must be changed.
TABLE 6. Cost of 1000 kcal by income level, Argentina, 1992 and 1994.
December 1992 December 1994
Quintile (Arg$) (Arg$)
1 5.5 6.60
2 7.6 8.20
3 8.7 9.98
4 9.6 11.15
5 12.4 14.34
Source: Argentina, Instituto Nacional de Estadística y Censos. Encuesta de Gastos e Ingresos de los Hogares e Índice de Precios al Consumidor.
TABLE 7. Equivalence between average price for a kilogram of fresh fruits and vegetables and a kilogram of beef, dry pasta, and bread, Argentina, 1980, 1985, 1990, and 1994.
Product 1980 1985 1990 1994
Peaches
Brisket 0.702 0.990 1.360 0.743
Ground beef 0.506 0.714 0.981 0.679
Pasta 1.129 1.075 1.418 1.676
Bread 1.340 1.593 2.045 1.188
Lettuce
Brisket 0.953 0.645 0.633 0.717
Ground beef 0.687 0.465 0.457 0.655
Pasta 1.532 0.859 0.660 1.618
Bread 1.821 1.226 0.952 1.146
Apples
Brisket 0.537 0.691 0.757 0.735
Ground beef 0.387 0.498 0.546 0.671
Pasta 0.863 0.750 0.789 1.657
Bread 1.026 1.111 1.139 1.174
Tomatoes
Brisket 0.914 0.944 1.042 0.613
Ground beef 0.659 0.681 0.752 0.560
Pasta 1.469 1.025 1.086 1.328
Bread 1.745 1.519 1.567 0.979
18 Socioanthropological Aspects of Obesity in Poverty
Integration with Standards of Commensalism
The poor eat foods rich in carbohydrates and fats because, in addition to being inexpen-sive, they are suited to their standards of com-mensalism. Meals based on pasta, flour, pota-toes, and oil (stews and soups) are easily included in group meals. Bread, the product consumed most, makes it possible to “stretch” any meal and obtain a feeling of satiety. Sugar is included in the diet to sweeten maté, which is consumed all day long and in abundance by the poor.
The food baskets of the low-income popu-lation are filled with “high-yield” foods that are cheap, “filling,” and “tasty.” An inexpen-sive food that filled one up would be worth-less if it remained on the plate. More than the nutritional quality of foods, the family con-sumption strategy seeks to ensure that each meal provides satisfaction and satiety, and can be eaten every day (6). Moreover, if the price differential is high, the poorest people will not include the most nutritional foods in their diet. The advice of food education messages can-not be acted upon if the chances for obtaining access to more harmonious and balanced nourishment do not improve. The poor know what foods they should eat, but they cannot afford them. It can be seen that to the extent that poverty diminishes because incomes in-crease, the consumption of fruits and dairy products increases. Otherwise, variety is re-served for children to the point that fruits are considered food for children (a custom that is disappearing due to the introduction of pack-aged juice that is consumed like a dessert).
If the declining income and increasing price trends continue, it can be inferred that the food consumed by the poorest urban population will contain increasingly more carbohydrates and fats. The comparison between the trend in the food and beverage relative price index and the trend in the fruit and beverage rela-tive price index between 1991 and 1994 shows that economic order and price stability have not succeeded in reversing this increasingly
marked rising historical trend (Table 8). Food and beverage prices continue to increase faster than the general rate of inflation, and the high-est increases are concentrated in the prices of fruits and vegetables.
Ideal Cost of Adequate Nourishment
In order to determine the cost of nutrition-ally adequate nourishment, a comparison was made between the price for an ideal basket containing the foods necessary to maintain a good diet and the price of the basket that is actually consumed (Table 9). The higher car-bohydrate and fat content cheapens the latter basket by 31.78%. If the cost of a minimum and adequate food basket were projected over time, a poor family in the first two income dis-tribution deciles would be able to eat for 20.7 days in a month. With the foods that ac-tually make up the basket, with an abun-dance of grains, fatty meats, oils, and sugars, the family is able to eat for the entire month (30.2 days).
The Role of Industry
The 1965 survey shows that the foods eaten by the poor at that time had little added value. At that time, agribusiness gave preference to the supply of fresh, bulk, and minimally pro-cessed foods that were prepared by women. In addition, the economically active female population represented barely 11% of the to-tal population and a single salary was enough to maintain a household. Throughout the
TABLE 8. Trend in the food and beverage compo-nent, and in the fruit and vegetable component of the Consumer Price Index, Argentina, 1991–1994a.
Food and Fruit and Consumer beverage vegetable Year Price Index component component
1991 100.0 100.0 100.0
1992 130.3 143.8 165.9
1993 144.5 155.3 175.6
1994 155.6 162.2 183.5
a 1991 = 100.


![TABLE 8. Apparent consumption of index foods, Chile, 1980–1994. Variation Food 1980–1994 [(kg/person)/year] 1980 1994 (%) All meats 32.6 55.2 +69.3 Beef 15.0 21.2 +41.3 Lamb 1.1 0.7 –36.4 Pork 5.0 11.0 +120.0 Poultry 10.3 21.5 +109.0 Fish 4.9 4.4 –10.2 Cu](https://thumb-eu.123doks.com/thumbv2/123dok_br/18584807.380869/59.783.406.712.735.958/table-apparent-consumption-index-chile-variation-person-poultry.webp)
