An Empirical Study on the Impact of Brand Loyalty
in Remembering Slogans
Submitted 02/01/20, 1st revision 23/02/20, 2nd revision 28/03/20, accepted 15/05/20
Paulo Duarte Silveira
1, Susana Galvão
2Abstract:
Purpose: This paper examines the influence of brand loyalty on the individuals’ capacity to
recall and recognize brand slogans.
Design/Methodology/Approach: Empirical quantitative research, gathering data via an
online questionnaire among 370 costumers of three telecom B2C service providers in Portugal.
Findings: In general terms, the influence of brand loyalty on the ability of the customers to
recall and recognize slogans was not verified.
Practical implications: For a brand interested in raising its slogan awareness, either by
recall or recognition, the level of marketing efforts should not vary according to the customer loyalty degree.
Originality/Value: The study contributes to the analysis of an influence not yet explored in
the previous studies dedicated to improving slogans’ effectiveness.
Keywords: Slogans, brand loyalty, recall, recognition. JEL codes: M31, M37.
Paper type: Research article.
Acknowledgements: The authors are grateful and acknowledge the cooperation of the
respondents and the funding support of Polytechnic Institute of Setúbal. CEFAGE-UE has the support from Fundação para a Ciência e a Tecnologia (grant UID/ECO/04007/2013) and FEDER/COMPETE (POCI-01-0145-FEDER-007659).
1College of Business Administration-Polytechnic Institute of Setúbal, Setúbal, Portugal, and CEFAGE-UE, Évora, Portugal. ORCID 0000-0003-2703-3008.
E-mail: [email protected]
2College of Business Administration and CICE (Centro de Investigação em Ciências Empresariais)-Polytechnic Institute of Setúbal, Setúbal, Portugal.
1. Introduction
According to Qu et al. (2020), in today's over and cluttered communicated society, the information that is not sufficiently attention-grabbing will lose communication value. Knowing that slogans are short phrases that convey descriptive or persuasive information about brands (Keller, 2008), they can play an important role in communication actions. In other words, if managed effectively slogans have a direct and positive impact on brand perception (Cheema et al., 2016), improving brand image, including brand recall, brand trust and brand recognition (Tsaur et al., 2020). By that, it is essential to ensure that slogans are designed to have the highest potential to be noticed. It is known that to be identified and to function subsequently, slogan information must activate the corresponding mental unit in the perceptual human system (Sternberg and Sternberg, 2016). However, there is an academic lacuna regarding the prerequisites of the slogan's effectiveness (Qu et al., 2020). Previous studies on slogans’ effectiveness have been mostly devoted to examining slogan characteristics that are more probable to improve the slogan remembrance. Séraphin et al. (2017) report that slogans that personalize the message and focus on a differentiated feature will allow better positioning. However, given that marketing is about establishing mutual positive relations with customers, it is possible to consider that external factors like brand loyalty might also impact slogan efecctiveness. To bridge this research gap, this study’s purpose is to analyze the influence of brand loyalty on the effectiveness of slogans, using empirical quantitative evidence.
2. Problem Setting
Oliver (1999) defines brand loyalty as a deeply held commitment to rebuy or repatronize a preferred product or service consistently in the future, thereby causing repetitive same brand purchasing, despite situational influences and marketing efforts, having the potential to cause switching behaviors. Brand loyalty is different from repeated purchasing behavior (Jacoby and Kyner, 1973), because in repeated purchasing only the behavior of rebuying is important, regardless of the consumer's degree of commitment towards the brand (Bloemer and Kasper, 1995). Therefore, brand loyalty encompasses behavioral and attitudinal dimensions (Chaudhuri and Hoibrook, 2001; Dick and Basu, 1994). The behavioral dimension of brand loyalty consists of repeated willingness to purchase the brand, while the attitudinal dimension consists of the level of dispositional commitment of some unique value associated with the brand (Chaudhuri and Hoibrook, 2001). Such a consumer's commitment to the brand might induce several marketing benefits, such as reduced marketing costs, more new customers, greater trade leverage, a favorable word-of-mouth, resistance among loyal consumers to competitive strategies (Dick and Basu, 1994).
In the context of customer engagement principles, customers are thought to make proactive contributions to brand interactions, rather than act as passive recipients of brand-related cues (Hollebeek, 2011). In fact, under the social exchange theory, customers are predicted to reciprocate positive thoughts, feelings and behaviors toward an object upon receiving specific benefits from the brand relationship (Hollebeek, 2011). This means that it might be expected that customer-focused constructs, like loyalty, might influence the brand marketing performance and components, where slogans fit into. The rationale behind is that a deeper commitment to the brand might raise the consumer’s attention towards the brand communications and, consequently, lead to a higher probability of remembering the communications components. In that context, we propose that a higher level of brand loyalty towards a certain brand will increase the probability of customers remembering the slogan of that brand. Therefore, we expect that a higher brand loyalty evokes a higher recall and recognition of the slogan. By that, the following research hypothesis were established:
H1: Behavioral/purchase brand loyalty is positively related to slogan recall. H2: Attitudinal brand loyalty is positively related to slogan recall.
H3: Behavioral/purchase brand loyalty is positively related to slogan recognition. H4: Attitudinal brand loyalty is positively related to slogan recognition.
3. Research Methods
An empirical quantitative study was conducted, gathering primary data via an online questionnaire, analyzing three brands of telecom service-providers (brands later identified as X, Y, and Z). This industry was chosen due to its competitive branding landscape, since it is dominated by the three brands studied and they all have used their slogans in the verbal and written advertising.
To obtain the responses, a two-stage sampling was used, combining the convenience technique and the snow-ball technique. In total, 370 real customers from the selected brands were considered. The variables measured with the questionnaire were: - Slogan recall (spontaneous) for each brand - measured by the question “What is the actual slogan for brand X?”. The answers were later coded in the categories, totally correct slogan, partially correct, incorrect and does not know. The correct slogan recognition rates were not high, which is coherent with Katz and Rose (1969) study - brand X correct recall was 20%, brand Y was 7% and brand Z was 20%.
- Slogan recognition (assisted) for each brand - four possible slogans were presented and the subjects had to choose only one. The possibilities included the brand actual slogan, an older slogan, the oldest slogan, and a competitor slogan. The slogans’ recognition rates were much higher than the recall rates, for all brands: brand X correct recognition rate was 37%; brand Y was 67% and brand Z was 78%.
- Purchase dimension of brand loyalty - was measured with the two items used by Chaudhuri and Hoibrook (2001). “I will buy this brand the next time” (variable
named purchase loyalty A); “I intend to keep purchasing this brand” (variable named purchase loyalty B). The items were measured with the previously mentioned Likert scale. The coefficient alpha for brand X was .883, for brand Y was .913 and brand Z was .917.
- Attitude dimension of brand loyalty – measurement based on the items of Chaudhuri and Hoibrook (2001). “I am committed to this brand” (variable named attitude loyalty A); “I would be willing to pay a higher price for this brand” (variable named attitude loyalty B). Both items were measured with the Likert scale, and the coefficient alpha for brand X was .676, for brand Y was .779 and brand Z was .721.
4. Findings
Table 1 provides descriptive statistics for the variables used to measure each dimension of brand loyalty, crosstabed with the slogan recall rates for each brand. Table 2 is similar but presents results for slogan recognition. We then developed a model using the logistic regression Forward:LR to evaluate the influence of the independent variables of loyalty on correctly recalling and recognizing the slogans. For each brand, the model fits the observed data since, in the brand recalling models, the brand X model Hosmer and Lemeshow test which is X2HL(8)=3.921, p=0.864, for
brand Y is X2HL(7)=5.207, p=0.635 and for brand Z is X2HL(7)=0.340; p=1.
Considering the brand recognition models, these models also fit the observed data, given the Hosmer and Lemeshow test values: brand X model X2HL(8)=4.004,
p=0.857, brand Y model X2HL(7)=2.770, p=0.905, and brand Z model X2HL(8)=4.430,
p=0.816. Given that the logistic regression Forward:LR models fits the observed
data, the analysis of the relation of loyalty on slogan recall was made, having reported that no independent variable considered in the models has shown predictable power over the slogan recall in brand X (G2(16)=13.386; p=0.644;
R2CS=0.089; R2N=0.0.122). The same is noted for brand Y (G2(16)=16.136; p=0.444;
R2CS=0.189; R2N=0.290) and also for brand Z (G2(16)=22.382; p=0.131; R2CS=0.280;
R2N=0.463). These results are confirmed by X2Wald ‘s tests for brands X, Y and Z,
shown in detail in Tables 3, 4 and 5. Therefore, neither purchase loyalty nor attitude loyalty presents significant statistical effects on the Logit of slogan recall probability.
Table 1. Descriptive measures of loyalty items by slogan recall
Brand X Slogan Recall Brand Y Slogan Recall Brand Z Slogan Recall
Item* correct not
correct** correct
not
correct** correct
not correct** I will buy this brand the
next time (purchase loyalty A) =2,87 s=1,55 =2,69 s=1,33 =2,50 s=1,37 =2,40 s=1,25 =3,68 s=1,29 =3,15 s=1,31 I intend to keep purchasing this brand (purchase loyalty B) =3,52 s=1,53 =3,13 s=1,52 =2,58 s=1,46 =2,50 s=1,47 =4,02 s=1,13 =3,51 s=1,44 I am committed to this =2,60 =2,49 =2,24 =2,08 =3,28 =3,03
brand (attitude loyalty A) s=1,48 s=1,52 s=1,48 s=1,38 s=1,46 s=1,50
I would be willing to pay a higher price for this brand (attitude loyalty B) =1,66 s=1,109 =1,54 s=0,92 =1,90 s=1,37 =1,52 s=0,96 =2,14 s=1,27 =2,06 s=1,34
Note: * max=5; min=1 | ** not correct= incorrect + does not know
Source: Authors’ calculations.
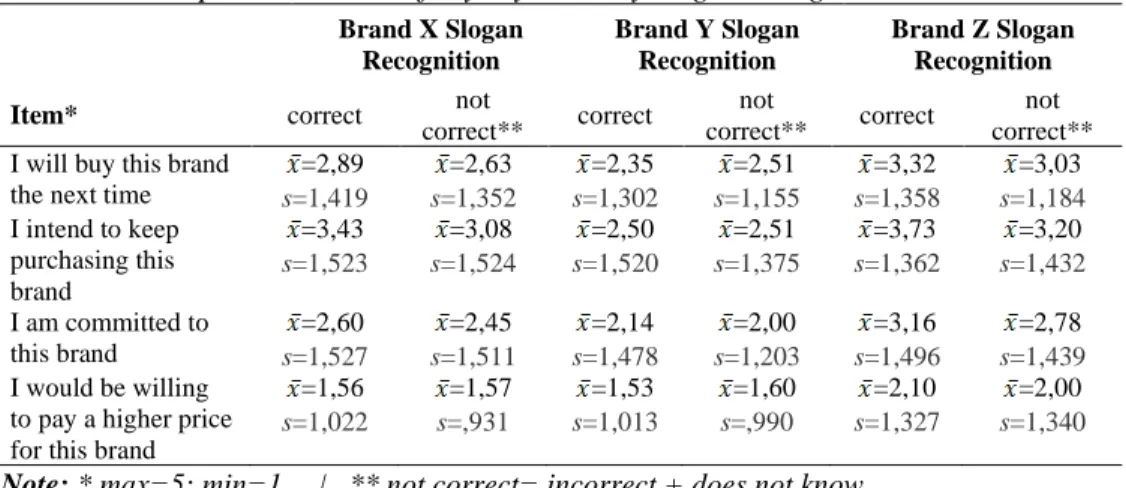
Table 2. Descriptive measures of loyalty items by slogan recognition
Brand X Slogan Recognition Brand Y Slogan Recognition Brand Z Slogan Recognition
Item* correct not
correct** correct
not
correct** correct
not correct** I will buy this brand
the next time
=2,89 s=1,419 =2,63 s=1,352 =2,35 s=1,302 =2,51 s=1,155 =3,32 s=1,358 =3,03 s=1,184 I intend to keep purchasing this brand =3,43 s=1,523 =3,08 s=1,524 =2,50 s=1,520 =2,51 s=1,375 =3,73 s=1,362 =3,20 s=1,432 I am committed to this brand =2,60 s=1,527 =2,45 s=1,511 =2,14 s=1,478 =2,00 s=1,203 =3,16 s=1,496 =2,78 s=1,439 I would be willing to pay a higher price for this brand
=1,56 s=1,022 =1,57 s=,931 =1,53 s=1,013 =1,60 s=,990 =2,10 s=1,327 =2,00 s=1,340 Note: * max=5; min=1 | ** not correct= incorrect + does not know
Source: Authors’ calculations.
Table 3. Variables in the binary logistic equation for brand X slogan recall
Variable B S.E. X2
Wald df Sig. Exp(B)
puchaseloyalty A 4,242 4 ,374 puchaseloyalty A(1) -1,783 ,969 3,385 1 ,066 ,168 puchaseloyalty A(2) -1,282 ,740 3,004 1 ,083 ,277 puchaseloyalty A(3) -1,152 ,830 1,928 1 ,165 ,316 puchaseloyalty A(4) -,886 ,890 ,990 1 ,320 ,412 puchaseloyalty B 2,657 4 ,617 puchaseloyalty B(1) 1,228 1,036 1,406 1 ,236 3,416 puchaseloyalty B(2) ,766 ,801 ,915 1 ,339 2,152 puchaseloyalty B(3) ,785 ,884 ,789 1 ,374 2,192 puchaseloyalty B(4) 1,269 ,918 1,912 1 ,167 3,557 attitudeloyalty A 5,000 4 ,287 attitudeloyalty A(1) ,671 ,782 ,736 1 ,391 1,957 attitudeloyalty A(2) ,524 ,678 ,598 1 ,439 1,689 attitudeloyalty A(3) -,766 ,703 1,189 1 ,276 ,465 attitudeloyalty A(4) -,294 ,824 ,127 1 ,721 ,745 attitudeloyalty B 2,729 4 ,604 attitudeloyalty B(1) ,338 ,559 ,366 1 ,545 1,402 attitudeloyalty B(2) -,612 ,648 ,891 1 ,345 ,542 attitudeloyalty B(3) ,960 1,157 ,689 1 ,407 2,611 attitudeloyalty B(4) ,233 ,961 ,059 1 ,809 1,262 Constant -,405 ,411 ,974 1 ,324 ,667
Note: * rejection of the null hypothesis for p=.05 Source: Authors’ calculations.
Table 4. Variables in the binary logistic equation for brand Y slogan recall
Variable B S.E. X2
Wald df Sig. Exp(B)
puchaseloyalty A 4,372 4 ,358 puchaseloyalty A(1) 1,608 1,622 ,984 1 ,321 4,995 puchaseloyalty A(2) -,442 1,288 ,118 1 ,731 ,643 puchaseloyalty A(3) -3,740 2,348 2,536 1 ,111 ,024 puchaseloyalty A(4) 17,855 12071,627 ,000 1 ,999 56804494,180 puchaseloyalty B 5,347 4 ,253 puchaseloyalty B(1) -2,805 2,280 1,513 1 ,219 ,060 puchaseloyalty B(2) -1,055 1,382 ,582 1 ,445 ,348 puchaseloyalty B(3) 3,080 2,397 1,651 1 ,199 21,756 puchaseloyalty B(4) -19,571 12071,626 ,000 1 ,999 ,000 attitudeloyalty A 3,010 4 ,556 attitudeloyalty A(1) ,729 2,208 ,109 1 ,741 2,072 attitudeloyalty A(2) 2,167 1,535 1,994 1 ,158 8,734 attitudeloyalty A(3) -,326 1,927 ,029 1 ,866 ,722 attitudeloyalty A(4) ,766 2,008 ,145 1 ,703 2,151 attitudeloyalty B 3,470 4 ,482 attitudeloyalty B(1) -19,933 15985,213 ,000 1 ,999 ,000 attitudeloyalty B(2) -1,228 1,239 ,981 1 ,322 ,293 attitudeloyalty B(3) 2,397 1,859 1,661 1 ,197 10,985 attitudeloyalty B(4) -38,811 19014,740 ,000 1 ,998 ,000 Constant -,988 ,480 4,237 1 ,040* ,372
Note: * rejection of the null hypothesis for p=.05 Source: Authors’ calculations.
Table 5. Variables in the binary logistic equation for brand Z slogan recall
Variable B S.E. X2
Wald df Sig. Exp(B)
puchaseloyalty A ,839 4 ,933 puchaseloyalty A(1) 17,950 49807,370 ,000 1 1,000 62435888,953 puchaseloyalty A(2) 19,451 16735,635 ,000 1 ,999 280081490,367 puchaseloyalty A(3) 20,837 16735,635 ,000 1 ,999 1120383935,781 puchaseloyalty A(4) 2,328 19456,646 ,000 1 1,000 10,253 puchaseloyalty B ,145 4 ,997 puchaseloyalty B(1) 21,203 40192,970 ,000 1 1,000 1615474864,509 puchaseloyalty B(2) 1,341 21866,129 ,000 1 1,000 3,824 puchaseloyalty B(3) ,718 21866,129 ,000 1 1,000 2,051 puchaseloyalty B(4) 38,605 21866,128 ,000 1 ,999 58318330358766672 attitudeloyalty A ,106 4 ,999 attitudeloyalty A(1) -,263 28598,187 ,000 1 1,000 ,768 attitudeloyalty A(2) -19,154 14072,883 ,000 1 ,999 ,000 attitudeloyalty A(3) -18,834 14072,883 ,000 1 ,999 ,000 attitudeloyalty A(4) -18,668 14072,883 ,000 1 ,999 ,000 attitudeloyalty B 1,530 4 ,821 attitudeloyalty B(1) -1,670 1,595 1,096 1 ,295 ,188 attitudeloyalty B(2) -,212 1,476 ,021 1 ,886 ,809 attitudeloyalty B(3) -22,181 9923,686 ,000 1 ,998 ,000 attitudeloyalty B(4) -21,078 9923,686 ,000 1 ,998 ,000 Constant ,000 1,000 ,000 1 1,000 1,000
Note: * rejection of the null hypothesis for p=.05 Source: Authors’ calculations.
To triangulate the previous results, we compared the groups of individuals who correctly recalled the slogans with the individuals who did not correctly recall the slogans. This procedure was used for each independent variable, separately for each brand, analyzing if there would be rejections of the null hypothesis of the median test, meaning that slogan recall would be significantly higher in the group that correctly recognized it. The respective results are coherent with our previous findings, confirming that in none of the independent variables (i.e., loyalty) the slogan recall was significantly higher in the group that correctly recalled the slogan. So, taking in consideration the previous results, H1 and H2 were rejected.
Table 6. U and Median tests of slogan recall Brand X Slogan Recall Brand Y Slogan Recall Brand Z Slogan Recall Item Sig. U* Sig. Median Test Sig. U* Sig. Median Test Sig. U* Sig. Median Test I will buy this brand
the next time
,343 ,799 ,163 ,694 ,101 ,590
I intend to keep purchasing this brand
,348 ,509 ,251 ,838 ,071 ,223
I am committed to this brand
,265 ,173 ,328 ,950 ,481 ,835
I would be willing to pay a higher price for this brand
,456 ,889 ,257 ,939 ,082 ,551
Note: * exact sig. 1-tailed applying Mann-Whitney test | ** rejection of the hypothesis for
p=.05.
Source: Authors’ calculations.
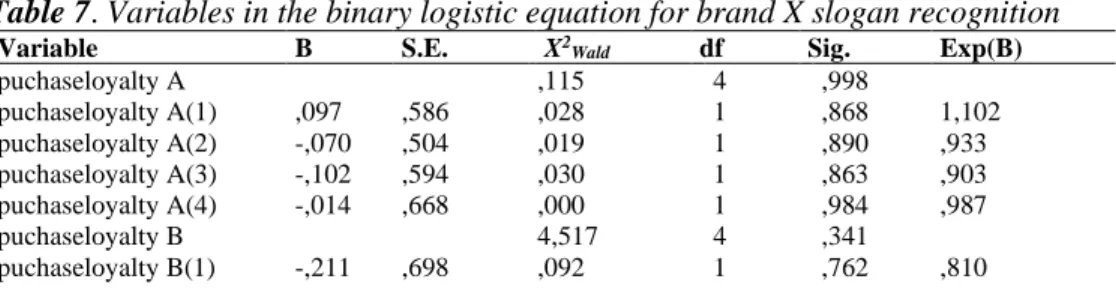
Analyzing the slogan recognition instead of slogan recall, the results do not show predictable power of the independent variables for brand X (G2(16)=17.526;
p=0.352; R2CS=0.066; R2N=0.090). The same is noted for brand Y (G2(16)=11.857;
p=0.754; R2CS=0.061; R2N=0.084) and for brand Z (G2(16)=20.075; p=0.217;
R2CS=0.077; R2N=0.122). Consequently, in a global manner, no significant relation
emerged between loyalty and slogan recognition. The results are also confirmed by
X2Wald ‘s tests for brands X, Y and Z, presented in Tables 7, 8 and 9. Therefore, the
purchase loyalty and attitude loyalty are not significantly associated to correctly recognizing the slogans.
Table 7. Variables in the binary logistic equation for brand X slogan recognition
Variable B S.E. X2
Wald df Sig. Exp(B)
puchaseloyalty A ,115 4 ,998 puchaseloyalty A(1) ,097 ,586 ,028 1 ,868 1,102 puchaseloyalty A(2) -,070 ,504 ,019 1 ,890 ,933 puchaseloyalty A(3) -,102 ,594 ,030 1 ,863 ,903 puchaseloyalty A(4) -,014 ,668 ,000 1 ,984 ,987 puchaseloyalty B 4,517 4 ,341 puchaseloyalty B(1) -,211 ,698 ,092 1 ,762 ,810
puchaseloyalty B(2) ,360 ,558 ,417 1 ,519 1,433 puchaseloyalty B(3) ,677 ,602 1,267 1 ,260 1,969 puchaseloyalty B(4) 1,290 ,670 3,713 1 ,054 3,633 attitudeloyalty A 3,574 4 ,467 attitudeloyalty A(1) ,782 ,550 2,020 1 ,155 2,186 attitudeloyalty A(2) -,362 ,499 ,526 1 ,468 ,696 attitudeloyalty A(3) -,079 ,497 ,025 1 ,873 ,924 attitudeloyalty A(4) ,073 ,609 ,014 1 ,905 1,076 attitudeloyalty B 4,255 4 ,373 attitudeloyalty B(1) -,277 ,445 ,388 1 ,533 ,758 attitudeloyalty B(2) -,919 ,486 3,571 1 ,059 ,399 attitudeloyalty B(3) -,497 ,742 ,448 1 ,503 ,608 attitudeloyalty B(4) ,314 ,945 ,110 1 ,740 1,368 Constant -,830 ,280 8,783 1 ,003* ,436
Note: * rejection of the null hypothesis for p=.05 Source: Authors’ calculations.
Table 8. Variables in the binary logistic equation for brand Y slogan recognition
Variable B S.E. X2
Wald df Sig. Exp(B)
puchaseloyalty A 2,595 4 ,628 puchaseloyalty A(1) -,720 ,705 1,044 1 ,307 ,487 puchaseloyalty A(2) -,397 ,605 ,432 1 ,511 ,672 puchaseloyalty A(3) ,310 ,796 ,152 1 ,697 1,364 puchaseloyalty A(4) ,271 1,319 ,042 1 ,837 1,311 puchaseloyalty B 2,521 4 ,641 puchaseloyalty B(1) ,438 ,819 ,286 1 ,593 1,550 puchaseloyalty B(2) ,037 ,717 ,003 1 ,959 1,038 puchaseloyalty B(3) ,284 ,947 ,090 1 ,764 1,329 puchaseloyalty B(4) -1,232 1,135 1,178 1 ,278 ,292 attitudeloyalty A 4,600 4 ,331 attitudeloyalty A(1) -,051 ,804 ,004 1 ,949 ,950 attitudeloyalty A(2) -,341 ,665 ,262 1 ,609 ,711 attitudeloyalty A(3) -,795 ,978 ,660 1 ,416 ,452 attitudeloyalty A(4) 2,082 1,412 2,176 1 ,140 8,022 attitudeloyalty B ,744 4 ,946 attitudeloyalty B(1) -,561 ,679 ,685 1 ,408 ,570 attitudeloyalty B(2) -,154 ,566 ,075 1 ,785 ,857 attitudeloyalty B(3) -,425 ,956 ,198 1 ,657 ,654 attitudeloyalty B(4) -,554 1,484 ,139 1 ,709 ,574 Constant ,943 ,268 12,421 1 ,000* 2,567
Note: * rejection of the null hypothesis for p=.05 Source: Authors’ calculations.
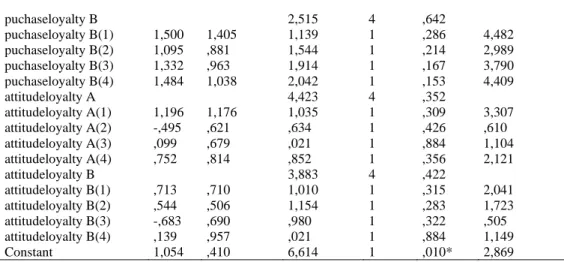
Table 9. Variables in the binary logistic equation for brand Z slogan recognition
Variable B S.E. X2
Wald df Sig. Exp(B)
puchaseloyalty A 2,630 4 ,621
puchaseloyalty A(1) -,927 1,114 ,693 1 ,405 ,396 puchaseloyalty A(2) -1,235 ,820 2,269 1 ,132 ,291 puchaseloyalty A(3) -,885 ,995 ,792 1 ,373 ,413 puchaseloyalty A(4) -,925 1,075 ,741 1 ,389 ,396
puchaseloyalty B 2,515 4 ,642 puchaseloyalty B(1) 1,500 1,405 1,139 1 ,286 4,482 puchaseloyalty B(2) 1,095 ,881 1,544 1 ,214 2,989 puchaseloyalty B(3) 1,332 ,963 1,914 1 ,167 3,790 puchaseloyalty B(4) 1,484 1,038 2,042 1 ,153 4,409 attitudeloyalty A 4,423 4 ,352 attitudeloyalty A(1) 1,196 1,176 1,035 1 ,309 3,307 attitudeloyalty A(2) -,495 ,621 ,634 1 ,426 ,610 attitudeloyalty A(3) ,099 ,679 ,021 1 ,884 1,104 attitudeloyalty A(4) ,752 ,814 ,852 1 ,356 2,121 attitudeloyalty B 3,883 4 ,422 attitudeloyalty B(1) ,713 ,710 1,010 1 ,315 2,041 attitudeloyalty B(2) ,544 ,506 1,154 1 ,283 1,723 attitudeloyalty B(3) -,683 ,690 ,980 1 ,322 ,505 attitudeloyalty B(4) ,139 ,957 ,021 1 ,884 1,149 Constant 1,054 ,410 6,614 1 ,010* 2,869
Note: * rejection of the null hypothesis for p=.05 Source: Authors’ calculations.
Comparing the groups of respondents who correctly recognized the slogans with the individuals that did not correctly recognize the slogans, some statistically significant differences between those groups were found. In fact, in Table 10 the rejection of the null hypothesis of the median test means that recognition was significantly higher in the group that correctly recognized the slogan. However, those differences were not consistent in all the brands, which poses limitations to a generalization of results. Given all the previous results, both H3 and H4 were rejected.
Table 10. U and Median tests of slogan recognition
Brand X Slogan Recognition Brand Y Slogan Recognition Brand Z Slogan Recognition Item Sig. U* Sig. Median Test Sig. U* Sig. Median Test Sig. U* Sig. Median Test
I will buy this brand the next time
,062 ,228 ,278 ,419 ,035** .023** I intend to keep
purchasing this brand
,024** ,061 ,361 ,775 ,003** ,023** I am committed to this
brand
,183 ,857 ,264 ,743 ,033** ,103 I would be willing to pay
a higher price for this brand
,370 ,842 ,381 ,433 ,239 ,338
Note: * exact sig. 1-tailed applying Mann-Whitney test | ** rejection of the hypothesis for
p=.05
Source: Authors’ calculations. 5. Conclusions
The main contribution of this research was the use of quantitative analysis to understand if there might be a positive impact of brand loyalty in recalling and
recognizing slogans, in order to have empirical evidence to help companies in managing their brand slogans communicating efforts.
The overall conclusion is that such relation was not found. More particulalry, behavioral and attitudinal brand loyalty were not positively related to slogan recognition nor to slogan recall, on the contrary to what was hypothesized. These results have practical managerial implications. If slogans contribute to enhance the brand image, marketeers might aim to improve the slogan awareness. But, to do so, the results point to the way that it is not advisable to distinguish the degree of marketing efforts between the level or type of customer loyalty. In other words, a customer with a higher level of purchase loyalty should be targeted with not less (neither higher) marketing communications efforts than a customer with a lower level of purchase loyalty. The same applies to attitude loyalty.
Like other studies conducted with samples, this research has limitations, due to the specific characteristics of the individuals considered, as well as the moment of the questionnaire administration. Consequently, different samples should be analyzed, to confirm the results found, namely the non-verified influence of brand loyalty on recalling and recognizing slogans. Studying diferent brands, business sectors, and regions will contribute to this debate.
References:
Bloemer, J.M., Kasper, H.D. 1995. The complex relationship between consumer satisfaction and brand loyalty. Journal of economic psychology, 16(2), 311-329.
Chaudhuri, A., Holbrook, M.B. 2001. The chain of effects from brand trust and brand affect to brand performance: the role of brand loyalty. Journal of Marketing, 65(2), 81-93. Cheema, F.E.A., Rehman, S., Rehman, M.U. 2016. Do taglines have a positive impact on
building the brand perception? A case study on kit kat. IBT Journal of Business Studies, 12(1), 52-64.
Dick, A.S., Basu, K. 1994. Customer loyalty: toward an integrated conceptual framework. Journal of the Academy of Marketing Science, 22(2), 99-113.
Hollebeek, L. 2011. Exploring customer brand engagement: definition and themes. Journal of strategic Marketing, 19(7), 555-573.
Jacoby, J., Kyner, D.B. 1973. Brand loyalty vs. repeat purchasing behavior. Journal of Marketing Research, 1-9.
Keller, K. 2008. Strategic Brand Management, 3rd ed. New Jersey, Prentice Hall. Oliver, R.L. 1999. Whence consumer loyalty? Journal of Marketing, 63, 33-44.
Qu, Y., Cao, L., Xu, F. 2020. Design of an attention-grabbing destination slogan using the attenuation model. Journal of Destination Marketing and Management.
https://doi.org/10.1016/j.jdmm.2020.100415.
Sternberg, R.J., Sternberg, K. 2016. Cognitive psychology. Nelson Education.
Tsaur, S.H., Liao, Y.L., Tsai, C.F. 2020. Analyzing the important implications of tourism marketing slogans and logos in Asia Pacific nations. Asia Pacific Journal of Tourism Research, 25(4), 355-368.